








 Web Trader MT5











Key Takeaways
- Precious metals surged to fresh all-time highs, with gold almost touching $5,600 and silver breaking $120 per ounce amid geopolitical risks and falling real yields.
- The S&P 500 briefly touched the 7,000 level, marking a major psychological milestone before reversing sharply.
- A major sell-off unfolded on Thursday, triggered by risk-off sentiment, profit taking, and renewed macro uncertainty.
- Bitcoin and the broader crypto market fell strongly on Thursday, suffering one of the sharpest single day declines of the month.
- The Federal Reserve kept interest rates unchanged, reinforcing a cautious, data dependent stance and disappointing hopes for near term easing.
Stocks & Indices
U.S. equity markets experienced extreme volatility during the week. The S&P 500 initially rallied to a record near 7,000, and ended the week up approximately 0.78%, closing around 6,900 after Thursday’s sharp sell-off. The pullback was driven by profit-taking, rising geopolitical concerns, and uncertainty following the Fed’s policy decision.
The Nasdaq 100 neared its record high during the week, but failed to reach it, weighed down by heavy selling in technology and AI-related stocks.
The Dow Jones Industrial Average declined slightly during the week. Earnings reports were mixed: several mega-cap companies beat revenue expectations but issued cautious forward guidance, reinforcing concerns about slowing growth momentum in early 2026.
Forex Market
The U.S. Dollar Index (DXY) weakened during the week, falling approximately 1.5% to 95.55, before recovering some of its losses and ended the week above 96.00 as markets reacted to the Fed’s decision to hold rates steady while maintaining a neutral-to-dovish bias.
EUR/USD climbed around 2.1%, ending the week above 1.1900, after reaching 1.2080, the highest level since 2021, supported by broad USD weakness and narrowing interest rate differentials.
GBP/USD gained roughly 0.9%, reaching a high of 1.3870, benefiting from dollar selling despite ongoing UK economic challenges.
Overall, forex markets reflected a clear shift away from the dollar, with investors positioning for a slower U.S. policy outlook relative to other major economies.
Commodities
Gold surged to new record highs near $5,600, The rally was fueled by safe haven demand, and persistent geopolitical tensions.
Silver outperformed gold once again, jumping to $121.60 before facing major resistance and closing around $105. Precious metals continue to extend their parabolic move. Strong industrial demand expectations and speculative inflows continued to support silver’s upside momentum.
Oil prices also advanced, with WTI crude up around 4.8% to $64 per barrel. The move was driven by escalating geopolitical risks, especially between the US and Iran, and concerns over potential supply disruptions.
Crypto Market
The cryptocurrency market suffered a sharp sell-off on Thursday, marking one of the worst sessions of the month. Bitcoin plunged to around $80,000, ending the week down approximately 4.6%.
Ethereum fell roughly 2.5%, trading near $2,700, while major altcoins experienced similar losses. Solana dropped 2.8%, and XRP declined about 4% over the week.
The crypto crash reflected a broader risk-off move, as investors reduced exposure to risk assets following the Fed decision and equity market sell-off. Liquidity-driven support faded quickly, highlighting crypto’s continued sensitivity to macro conditions.
Key Economic Data of the week
- Delayed data showed US durable good orders jumped 5.3% in November, beating expectations of 3.1% increase.
- Australian CPI inflation rose 3.8% in December, higher than market expectations of 3.5%.
- Bank of Canada kept interest rates unchanged at 2.25% in line with expectations.
- The US Federal Reserve holds rates steady at 3.50% – 3.75% as widely expected by the markets.
- Weekly US unemployment claims show 209K claims, slightly higher than expected.
Major Economic Calendar Events for the Upcoming Week
| Date | Metric | Country | Previous | Time [Dubai] |
| Monday, 2 February | ISM Manufacturing PMI | USA | 47.9 | 7:00 PM |
| Tuesday, 3 February | Interest Rate Decision | Australia | 3.60% | 7:30 AM |
| Tuesday, 3 February | JOLTS Job Openings | USA | 7.15M | 7:00 PM |
| Wednesday, 4 February | Unemployment Rate | New Zealand | 5.30% | 1:45 AM |
| Wednesday, 4 February | ADP Non-Farm Employment Change | USA | 41K | 5:15 PM |
| Wednesday, 4 February | ISM Services PMI | USA | 54.4 | 7:00 PM |
| Thursday, 5 February | Interest Rate Decision | UK | 3.75% | 4:00 PM |
| Thursday, 5 February | Interest Rate Decision | Euro | 2.15% | 5:15 PM |
| Friday, 6 February | Unemployment Rate | Canada | 6.80% | 5:30 PM |
| Friday, 6 February | Non-Farm Employment Change | USA | 50K | 5:30 PM |
| Friday, 6 February | Unemployment Rate | USA | 4.40% | 5:30 PM |
Technical Analysis and Forecast :
Gold Technical Analysis
Gold has experienced a sharp daily correction on Thursday, falling toward the $5,100 area after peaking near $5,600. Despite the size of the pullback, the broader daily trend remains bullish, as price is still far above the major breakout zone and continues to respect the long-term uptrend.
Gold remains above the 30-day moving average, which continues to slope aggressively upward and defines the primary trend support. The $5,050–$5,150 region is now a critical support zone that will determine whether this move remains a pullback or develops into a deeper correction.
Momentum remains bullish on a higher timeframe basis. The MACD is strongly above the zero line, indicating that long term bullish momentum is intact despite the short term momentum reset.
Overall, gold’s price action suggests a healthy correction within a powerful secular uptrend, with the broader bias remaining bullish unless price breaks decisively below the rising 30-day moving average.
Gold Daily Chart
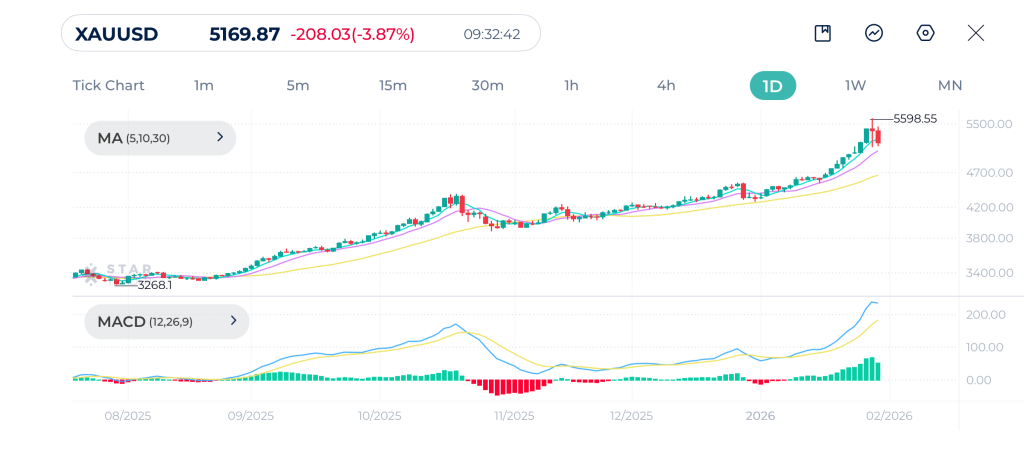
| Resistance | $5,293 – $5,320 | $5,402 – $5,437 | $5,500 – $5,521 |
| Support | $5,097 – $5,120 | $4,950 – $4,970 | $4,921 – $4,950 |
S&P 500 Technical Analysis
The S&P 500 is pulling back modestly from the 7,017 highs, trading near 6,920 after an extended rally. The market remains bullish, with a clear sequence of higher highs and higher lows. The current decline looks corrective, suggesting consolidation after trend extension.
The moving averages strongly reinforce the bullish bias. Price is trading well above the 30-day moving average, which is rising steadily and acting as a dynamic support zone. The shorter daily moving averages MA(5) and MA(10) are flattening after a minor bearish crossover, reflecting short-term cooling momentum. A daily close below the 6,850–6,900 region would be needed to challenge the bullish narrative.
MACD remains above the zero line, but the indicator is signaling a pause in upside momentum. As long as the MACD holds above zero, the broader trend remains constructive.
S&P 500 Daily Chart
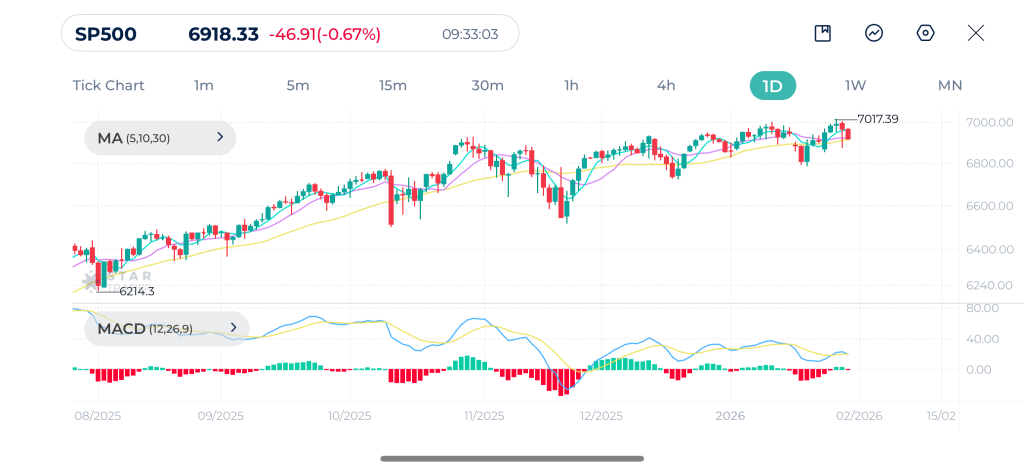
| Resistance | 6,978 – 6,980 | 7,000 – 7,024 | 7,100 – 7,124 |
| Support | 6,840 – 6,870 | 6,803 – 6,820 | 6,717 – 6,734 |
Brent Technical Analysis
Brent is trading near the $69.00 area after a sharp pullback from the recent highs around $70.47. The broader structure has shifted to cautiously bullish.
Price remains above the 30-day moving average, which has started to slope upward for the first time in months, signaling an improving medium term trend. The shorter moving averages MA(5) and MA(10) are still above the 30-day moving average, although the current pullback is testing this short-term structure. As long as price holds above the $66.50–$67.00 support zone and the rising 30-day moving average.
MACD is above the zero line, indicating that bullish momentum remains dominant despite short term selling pressure. Overall, oil appears to be undergoing profit taking after a strong advance.
Brent Daily Chart
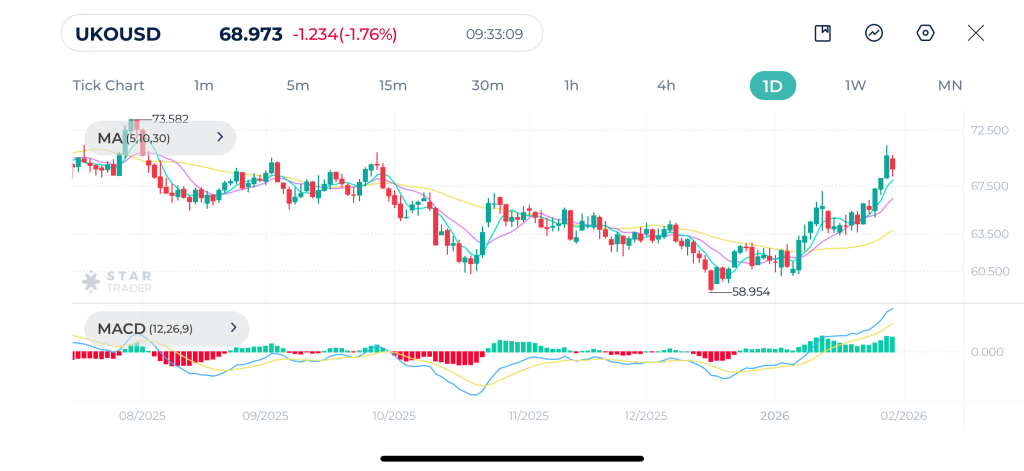
| Resistance | $69.57 – $69.71 | $70.43 – $70.61 | $71.00 – $71.20 |
| Support | $67.40 – $67.50 | $66.35 – $66.52 | $65.30 – $65.42 |
Bitcoin Technical Analysis
Bitcoin is trading near $82,500 after extending its decline from October’s peak, confirming a sustained bearish structure on the daily timeframe. The sequence of lower highs and lower lows remains intact, and the recent breakdown below the $90,000 region has reinforced the medium term bearish bias.
The moving averages clearly reflect this weakness. Price is trading below the three daily moving averages MA(5), MA(10), and MA(30), all of which are sloping downward. The 30-day moving average has now firmly transitioned into dynamic resistance, and each rebound toward this level has been sold aggressively. This alignment suggests that sellers remain firmly in control, and upside attempts are likely to be corrective unless price can reclaim and hold above the $90,000–$92,000 zone.
Momentum confirms the bearish outlook. The MACD is below the zero line, indicating strengthening downside momentum. While the $80,600–$82,000 area may offer temporary support, the broader daily structure remains bearish, and any rebounds are currently best viewed as corrective rallies within a downtrend.
Bitcoin Daily Chart
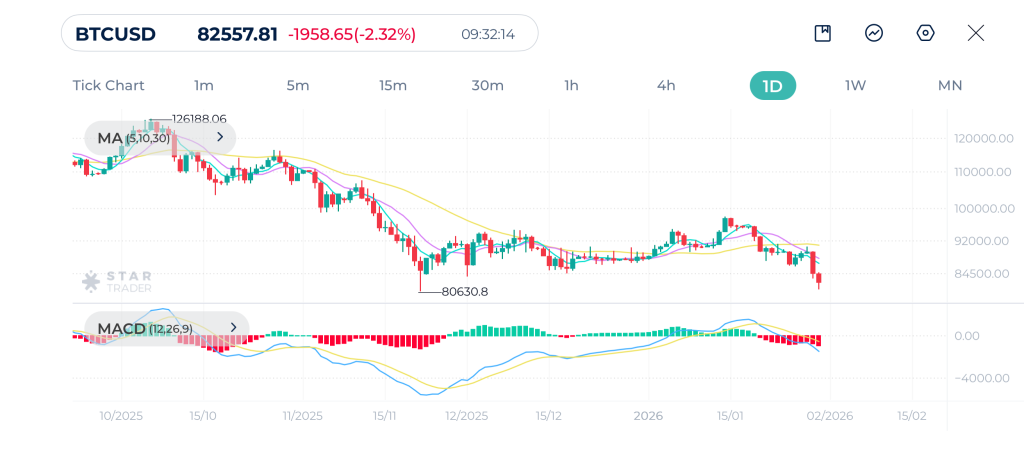
| Resistance | $86,684 – $86,700 | $90,455 – $90,500 | $93,631 – $93,700 |
| Support | $81,026 $81,100 | $79,075 – $79,230 | $77,200 – $77,312 |
Tags


Open Live Account
 Email Address
 Phone Number
Important Notice
STARTRADER does not accept any applications from Australian residents.
To comply with regulatory requirements, clicking the button will redirect you to the STARTRADER website operated by STARTRADER PRIME GLOBAL PTY LTD (ABN 65 156 005 668), an authorized Australian Financial Services Licence holder (AFSL no. 421210) regulated by the Australian Securities and Investments Commission.
Important Notice for Residents of the United Arab Emirates
In alignment with local regulatory requirements, individuals residing in the United Arab Emirates are requested to proceed via our dedicated regional platform at startrader.ae, which is operated by STARTRADER Global Financial Consultation & Financial Analysis L.L.C.. This entity is licensed by the UAE Capital Market Authority (CMA) under License No. 20200000241, and is authorised to introduce financial services and promote financial products in the UAE.
Please click the "Continue" button below to be redirected.


