








 Web Trader MT5









Key Takeaways
- U.S. stock markets reached fresh all-time highs, led by strong AI momentum and continued demand for semiconductor companies.
- The Nasdaq 100 broke above the 30,000 level for the first time in history as tech stocks dominated global markets.
- Micron Technology and SK hynix both surpassed the historic $1 trillion market capitalization milestone during the week.
- Oil prices plunged nearly 10% after optimism surrounding potential U.S.-Iran negotiations reduced supply disruption fears.
- Bitcoin came under strong selling pressure and dropped toward the $73,000 region as inflation concerns weighed on risk sentiment.
- Stronger-than-expected U.S. PCE inflation data reinforced expectations that the Federal Reserve may keep interest rates elevated for longer.
Global Stocks Advance Higher, US Indices at Record Highs
Global financial markets experienced another volatile week as investors navigated record highs in U.S. equities, a sharp collapse in oil prices, renewed pressure on Bitcoin, and critical inflation data from the United States. Market sentiment shifted several times throughout the week, initially driven by geopolitical tensions in the Middle East before optimism surrounding potential negotiations between the United States and Iran pushed energy prices sharply lower and supported risk appetite across global equities.
U.S. stock indices continued their impressive rally, with major benchmarks reaching fresh all-time highs during the week. The Dow Jones Industrial Average opened the week near 50,784 and climbed to a new historical high around 51,129 before giving back part of its gains and eventually closing near its weekly opening levels. Despite the late pullback, the Dow remained supported by strong corporate earnings and continued optimism surrounding the resilience of the U.S. economy.
The Nasdaq 100 remained the strongest-performing major index globally as investor demand for artificial intelligence and semiconductor-related stocks accelerated further. The index opened the week near 29,651 and managed to break above the psychological 30,000 level for the first time in history, ending the week above 30,200. Semiconductor giants continued leading the rally, with both Micron Technology and SK hynix reaching the historic $1 trillion market capitalization milestone during the week. Investors continued pouring capital into AI-related companies amid expectations that global demand for data centers, AI chips, and memory products will remain extremely strong over the coming years.
The S&P 500 also maintained its bullish momentum throughout the week. The index opened above 7,500 and closed near 7,570 after setting fresh record highs during multiple trading sessions. Technology, communication services, and semiconductor companies remained the key drivers behind the broader market rally, while lower oil prices later in the week also helped improve overall investor sentiment.
Asian equity markets followed the positive momentum from Wall Street. Japan’s Nikkei 225 remained near multi-decade highs as weakness in the Japanese Yen continued supporting export-oriented companies and technology shares. South Korea’s KOSPI index outperformed several regional peers after strong gains in semiconductor stocks boosted the overall market. Investors continued focusing heavily on the AI sector, particularly after the strong performance of memory chip manufacturers throughout the week.
One of the most important events of the week was the release of the U.S. Personal Consumption Expenditures (PCE) inflation report, which is considered the Federal Reserve’s preferred inflation gauge. Headline PCE inflation rose to 3.8% year-over-year, while Core PCE increased to 3.3% year-over-year. Monthly Core PCE also came in stronger than expected, reinforcing concerns that inflation in the United States may remain elevated for longer than markets initially anticipated. Following the data release, Treasury yields moved higher while expectations for aggressive Federal Reserve rate cuts later this year declined.
Oil Plummets Nearly 10%, Gold Trades in a Range
Commodity markets witnessed major volatility, especially in oil prices. Crude oil opened the week under pressure and continued declining sharply after reports suggested that negotiations between the United States and Iran were progressing positively. The possibility of easing geopolitical tensions reduced fears of supply disruptions in the Middle East and triggered aggressive selling across energy markets. Brent crude and WTI both declined nearly 10% during the week, marking one of the sharpest weekly declines seen in recent months.
Gold prices also experienced significant volatility during the week. The precious metal opened near $4,569 and initially came under heavy selling pressure as easing geopolitical fears reduced demand for safe-haven assets. Gold eventually dropped toward $4,366 before rebounding strongly during the second half of the week and closing near $4,518.
Bitcoin Loses 5% and Falls Below $75,000
Bitcoin faced notable selling pressure throughout the week as investors reduced exposure to risk assets following stronger U.S. inflation readings and rising Treasury yields. Bitcoin fell toward the $73,000 region before stabilizing near the end of the week. Spot Bitcoin ETF flows remained mixed during the week, with early sessions recording net outflows as traders locked in profits after recent rallies. However, inflows began stabilizing later in the week as institutional buyers returned near key support levels. Despite the correction, medium-term institutional demand for Bitcoin ETFs remained relatively healthy compared to previous months.
Next Week Forecast
Looking ahead to next week, investors are expected to focus heavily on labor market data, Federal Reserve commentary, and ongoing geopolitical developments. U.S. equity markets may continue attempting to push toward new record highs if AI-related momentum remains strong and bond yields stabilize. However, markets remain vulnerable to additional inflation surprises or any hawkish signals from Federal Reserve officials.
Oil prices are likely to remain highly sensitive to developments surrounding negotiations between the United States and Iran. Continued diplomatic progress could keep pressure on crude prices, while any unexpected escalation in geopolitical tensions may quickly reverse the recent decline.
Gold is expected to remain volatile as traders continue reacting to inflation expectations, Treasury yields, and geopolitical uncertainty. As long as prices remain above key support levels, buyers may attempt another move toward recent highs.
Major Economic Calendar Events for the Upcoming Week
| Date | Metric | Country | Previous |
| Monday, 1 June | ISM Manufacturing PMI | USA | 52.7 |
| Tuesday, 2 June | JOLTS Job Openings | USA | 6.87m |
| Wednesday, 3 June | Gross Domestic Product q/q | Australia | 0.80% |
| Wednesday, 3 June | ADP Non-Farm Employment Change | USA | 109K |
| Wednesday, 3 June | ISM Services PMI | USA | 53.6 |
| Thursday, 4 June | Consumer Price Index m/m | Switzerland | 0.30% |
| Friday, 5 June | Unemployment Rate | Canada | 6.90% |
| Friday, 5 June | Non-Farm Employment Change | USA | 115K |
| Friday, 5 June | Unemployment Rate | USA | 4.30% |
Technical Analysis and Forecast:
Brent Technical Analysis
Oil continued to decline during the week as prices dropped nearly $25 in roughly three weeks,a brutal 21% decline. All three moving averages MA(5), MA(10), and MA(20) are now in a bearish alignment and price is trading below all of them.
Bias is overall bearish. Any bounce into the $97–$100 zone is likely to face some resistance. If current lows don’t hold, the next downside targets are $91–$92 and then $85. A reclaim of $100 on a closing basis would be the first sign the selloff is over.
Brent Daily Chart
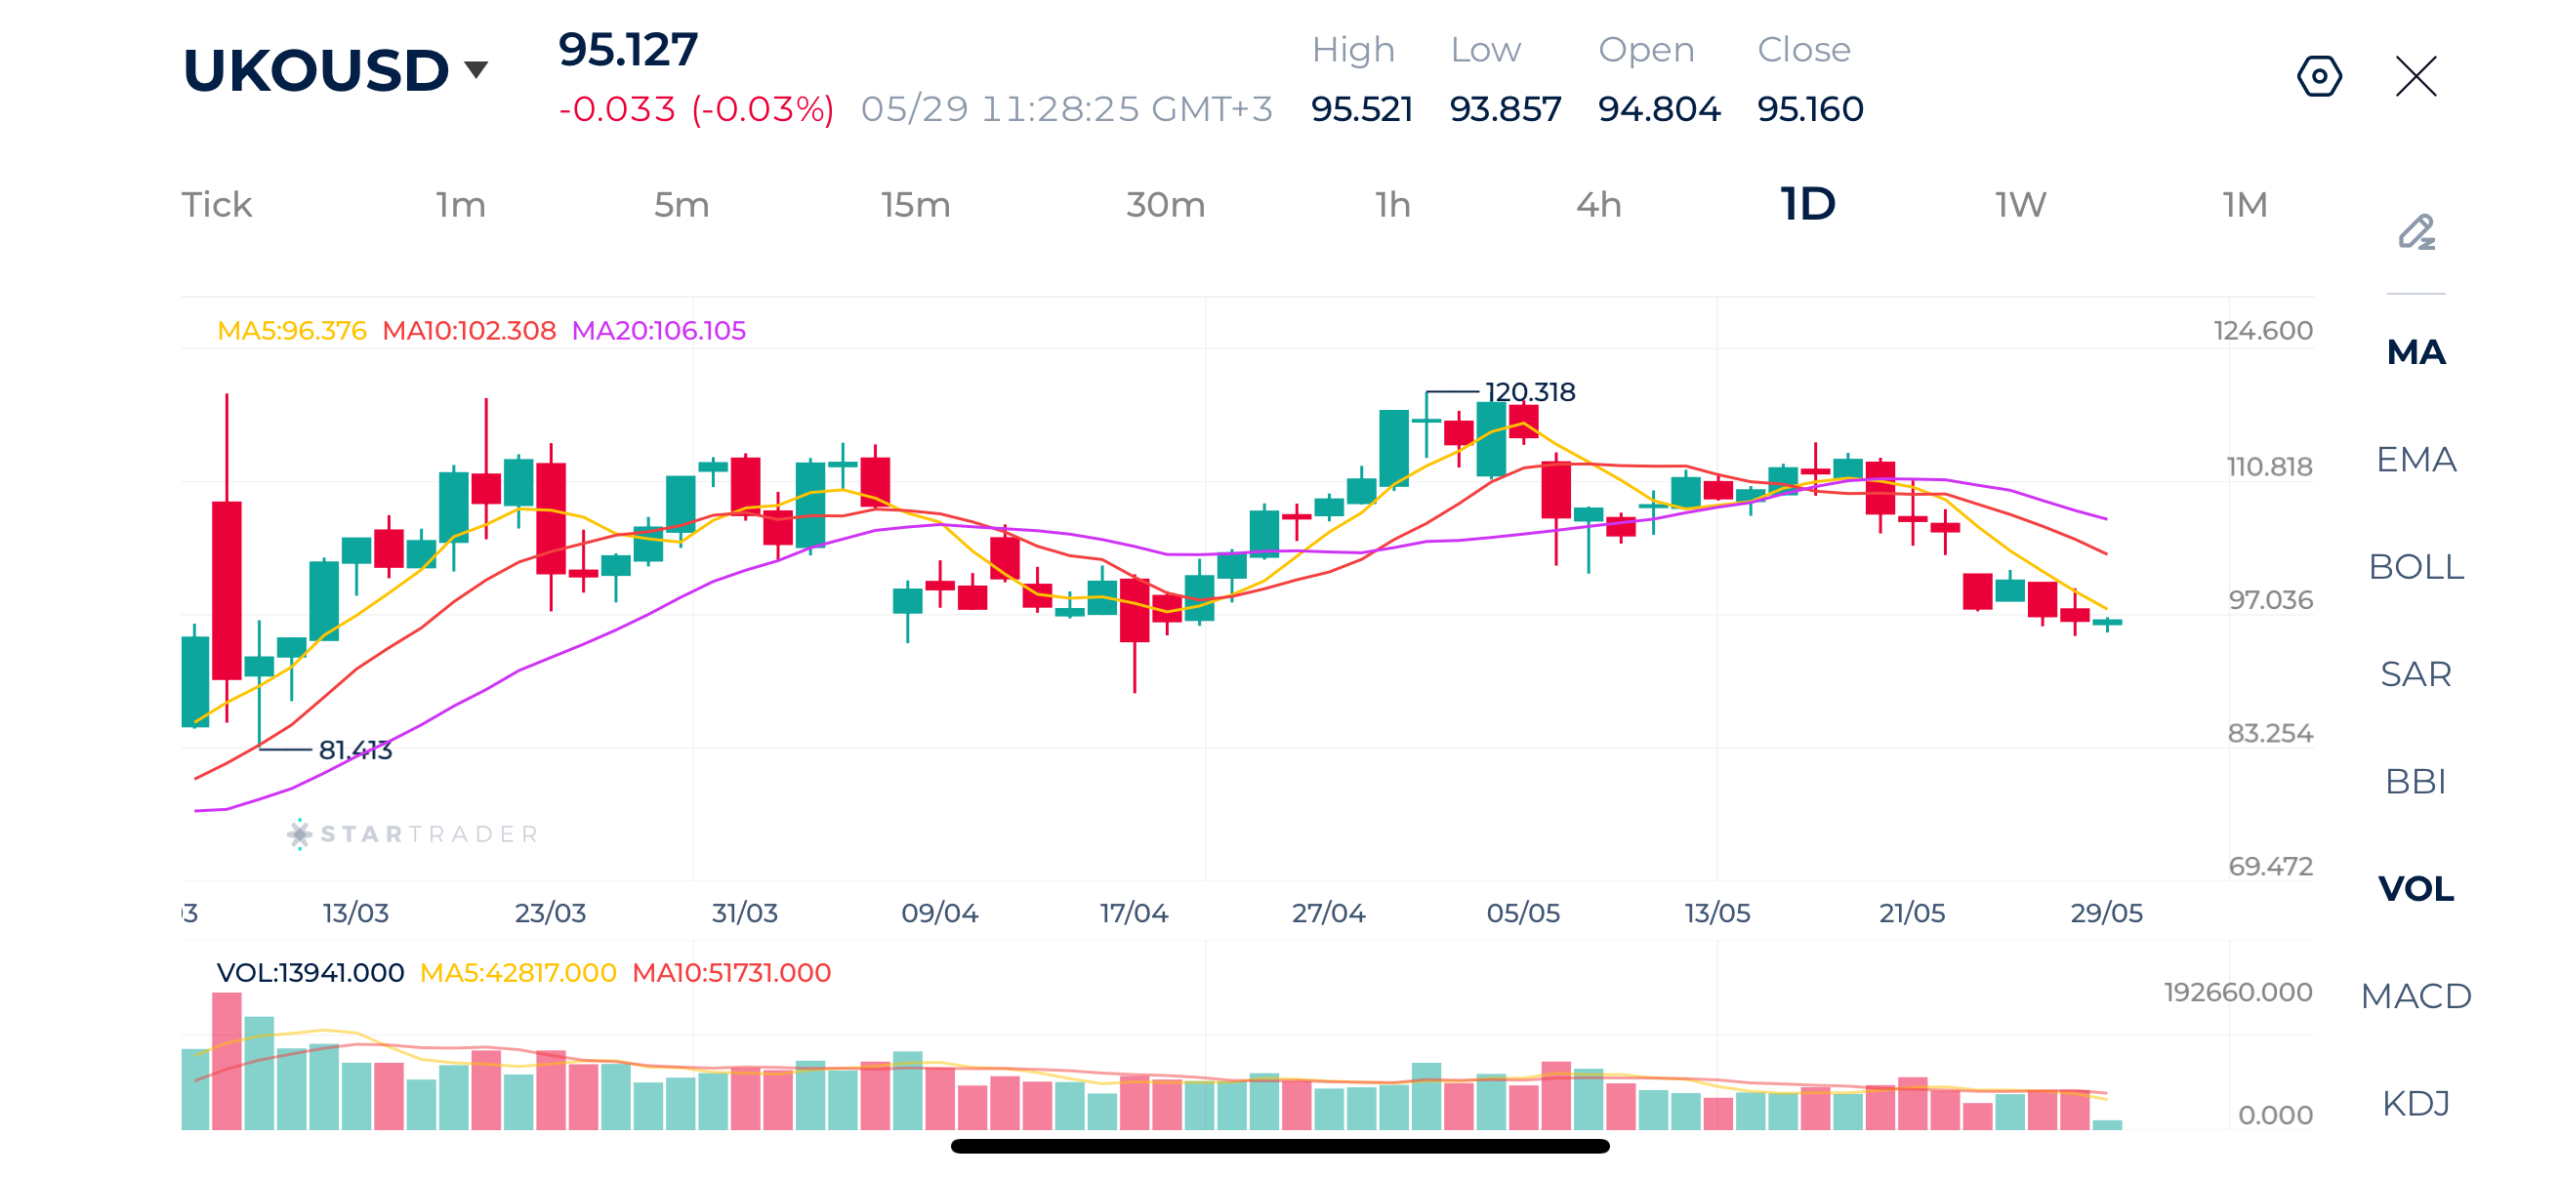
| Resistance | $98.20 – $98.43 | $102.46 – $102.80 | $104.88 – $105.00 |
| Support | $92.60 – $92.90 | $90.22 – $90.45 | $88.20 – $88.43 |
S&P 500 Technical Analysis
S&P 500 has put in a strong 10-week rally of more than 20%. All three moving averages MA(5), MA(10), and MA(20) are stacked bullishly and price is moving above all of them. The MA20 is still well below price, confirming the trend is healthy and not yet overextended on the daily. Volume during the advance has been consistent, adding credibility to the move.
Trend is firmly up. The most probable near-term path is continued grinding higher toward 7,700–7,750. The first meaningful pullback may face support at the 7,558 or the psychological 7500 level. Only a close below 7,400 would begin to threaten the bullish structure.
S&P 500 Daily Chart
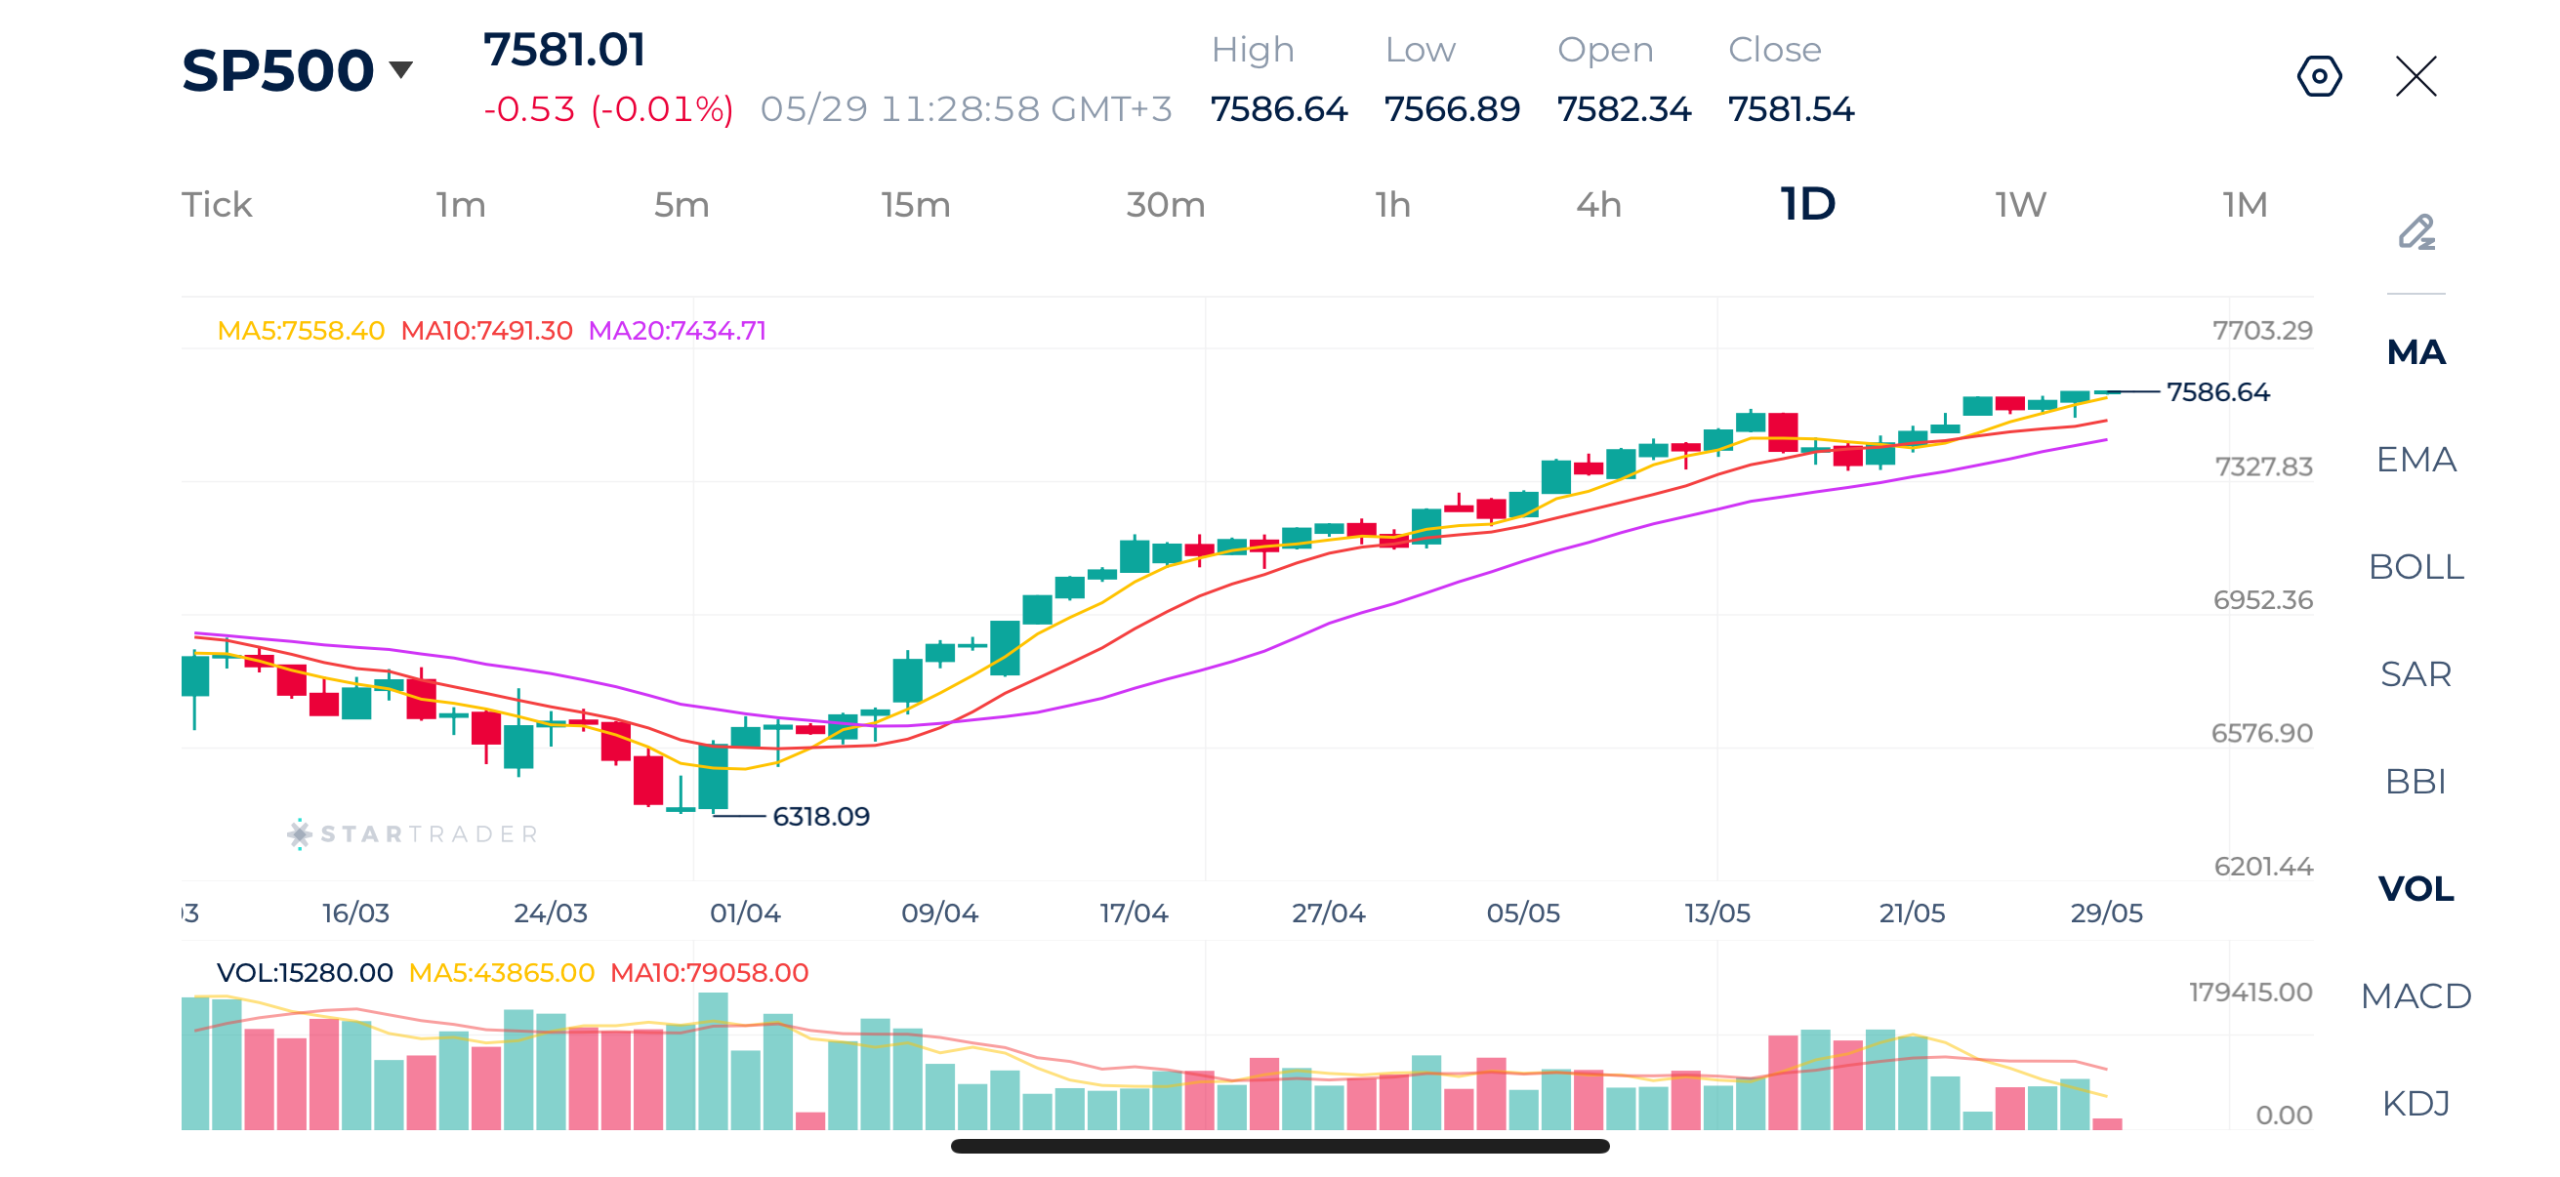
| Resistance | 7,600 – 7,620 | 7,650 – 7,660 | 7,680 – 7,690 |
| Support | 7,500 – 7,510 | 7,428 – 7,446 | 7,326 – 7,340 |
EURUSD Technical Analysis
EURUSD has been in sideway correction movement for the past six weeks, falling back toward the 1.1630 area. The moving averages structure is now compressing. Volume has been declining throughout the pullback, suggesting sellers lack conviction.
The recent consolidation looks corrective. A hold above 1.1600–1.1615 keeps the bullish case alive for a re-test of 1.1750, then 1.1848. A daily close below 1.1600 opens the door to 1.1530 and potentially back toward 1.1410.
EURUSD Daily Chart
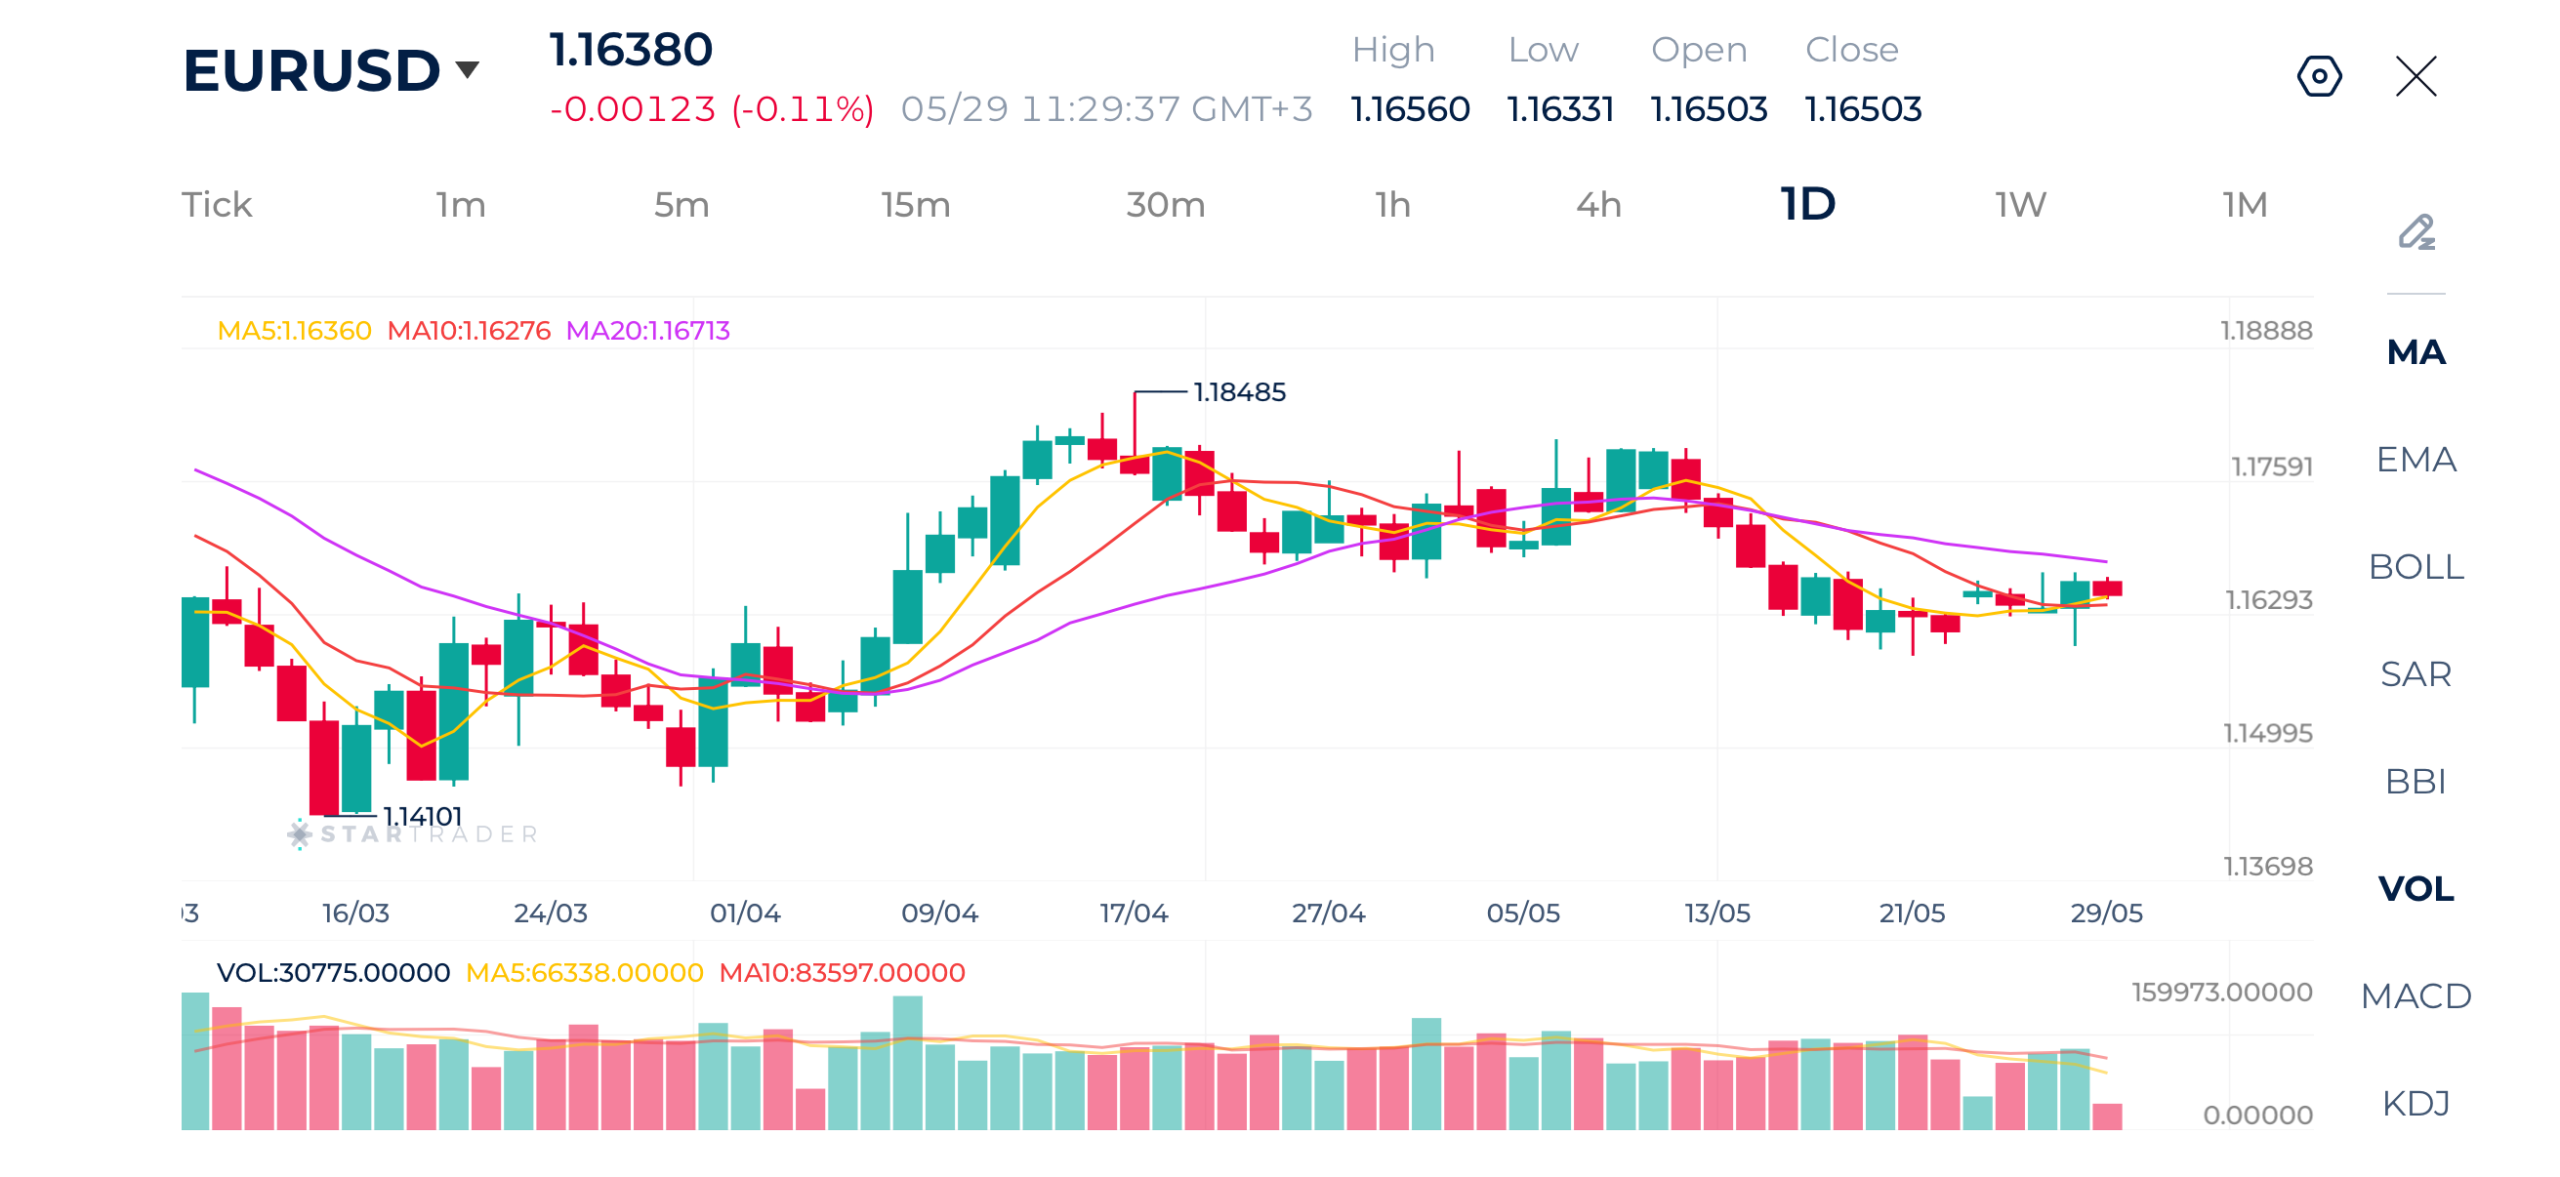
| Resistance | 1.1759 – 1.1770 | 1.1848 – 1.1860 | 1.1900 – 1.1920 |
| Support | 1.1585 – 1.1590 | 1.1500 -1.1513 | 1.1410 -1.1421 |
Gold Technical Analysis
Gold experienced high volatility during the week as the precious metal dropped to the $4,360 levels in the first half before rebounding higher. Price is currently trading below the three key moving averages with no clear bias.
The dominant trend in the short term remains down, but the tight consolidation near $4,490–$4,530 and the slight uptick in today’s volume suggest a short-term bounce is possible toward $4,580–$4,620. For a solid trend reversal, gold would need to reclaim $4,500. To the downside, failure to hold $4,490 reopens the path toward $4,330 and ultimately the key level at $4,098.
Gold Daily Chart
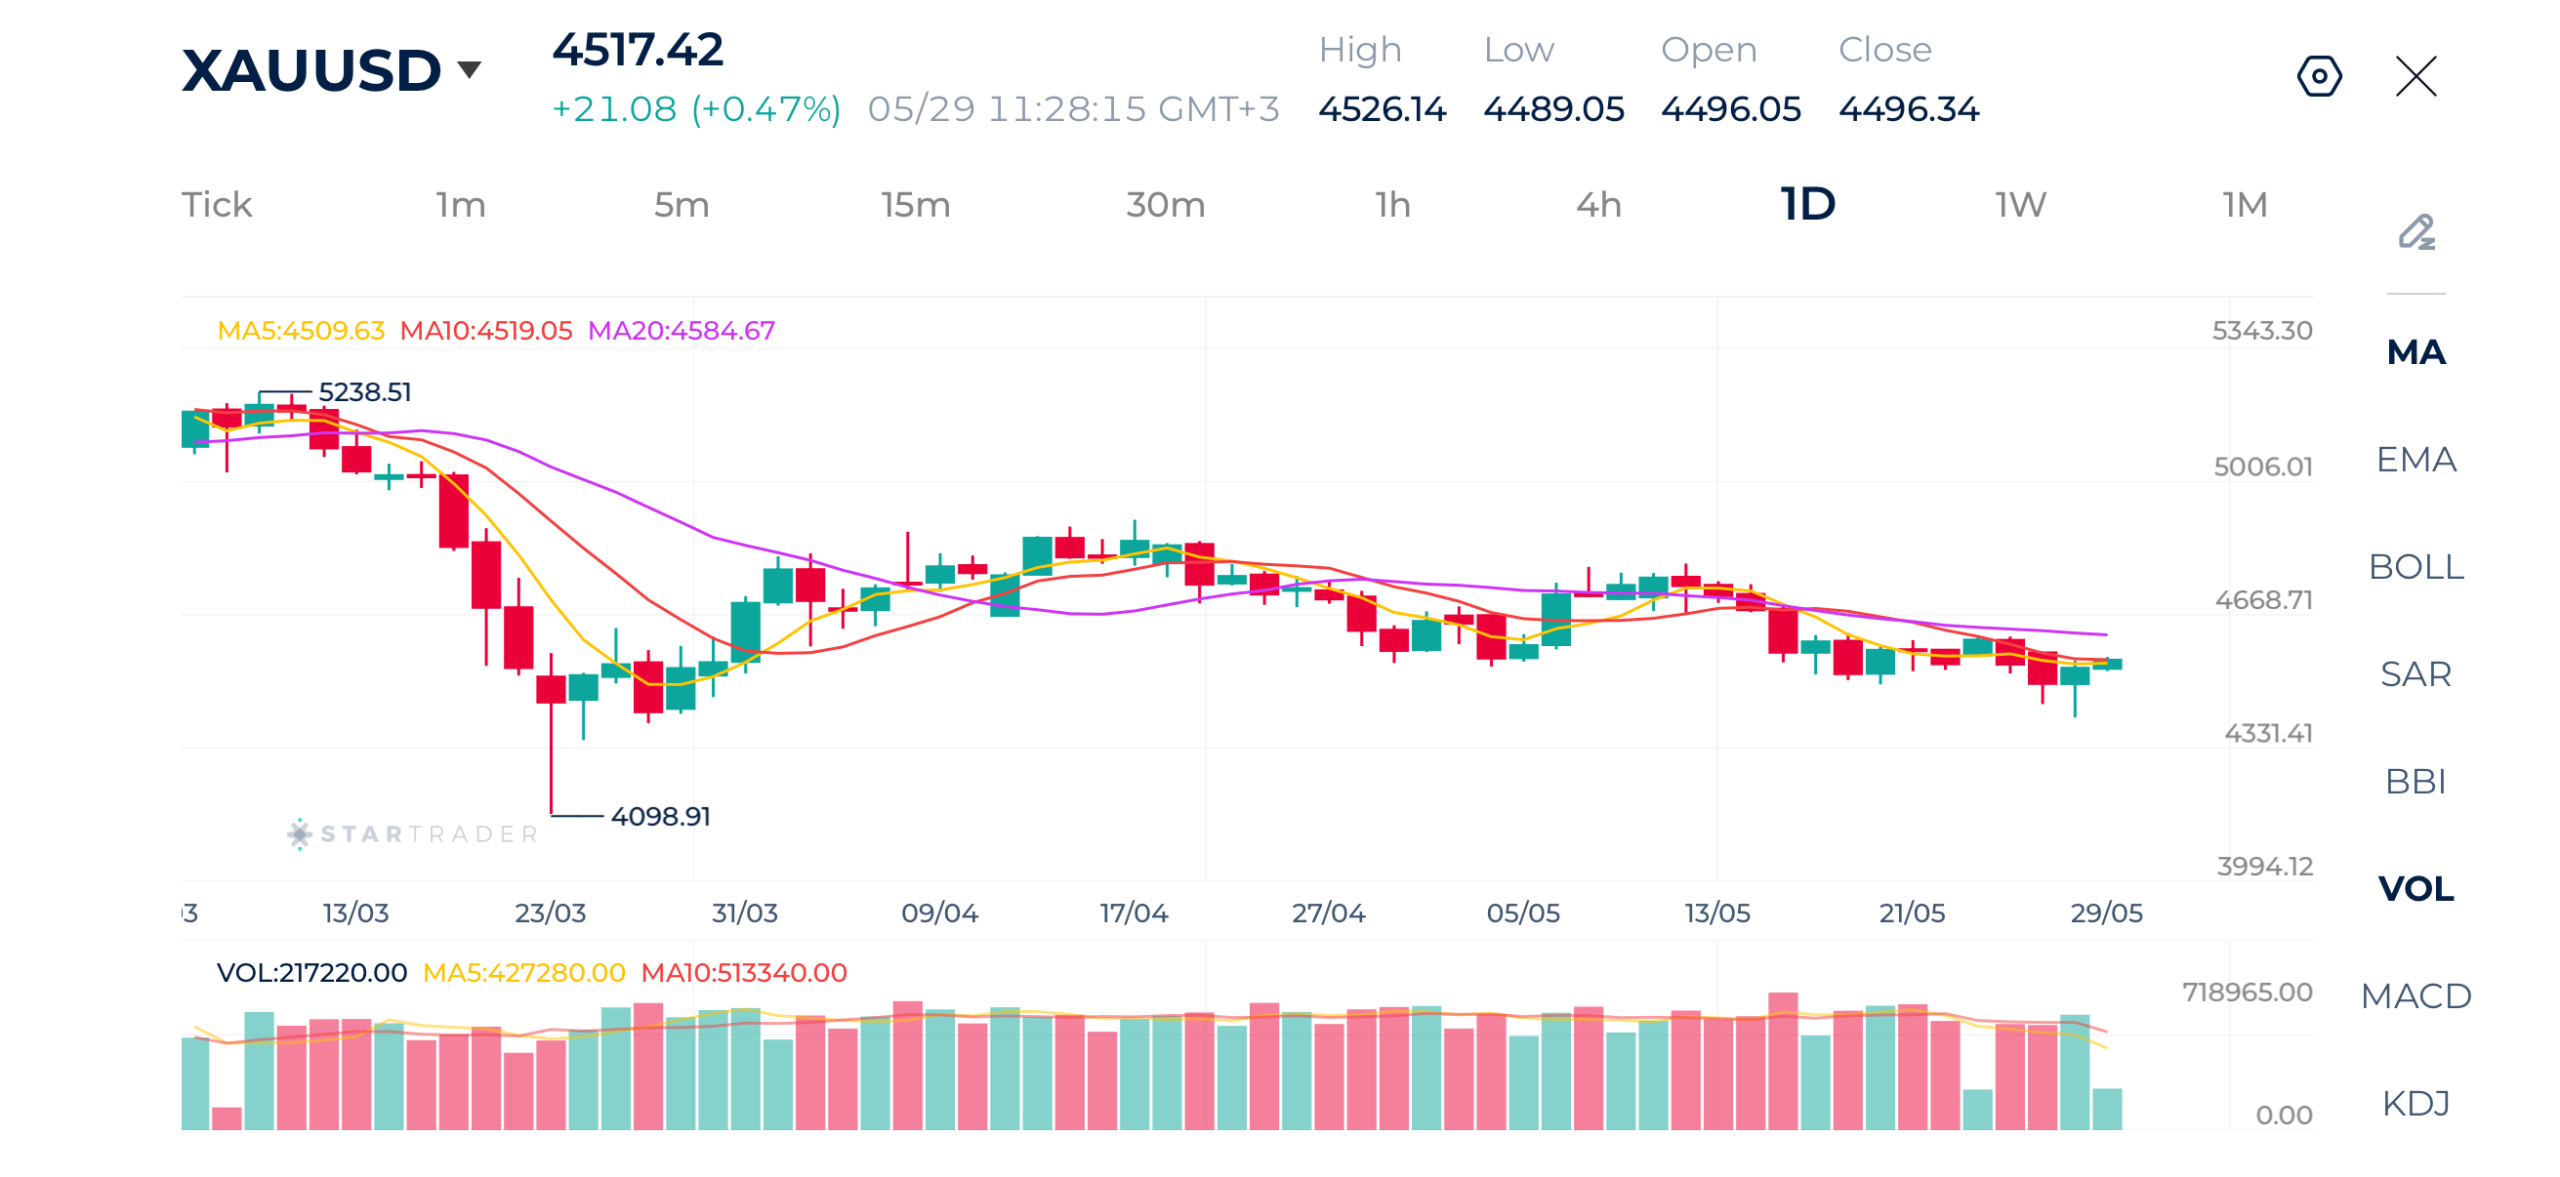
| Resistance | $4,578 – $4,600 | $4,700 – $4,720 | $4,800 – $4,834 |
| Support | $4,420 -$4,435 | $4,360 – $4,375 | $4,311 – $4,320 |
Risk Disclaimer: This material is provided for informational purposes only and does not constitute a recommendation or investment advice. Trading financial instruments on margin involves substantial risk and may not be appropriate for all investors.
Tags


Open Live Account
 Email Address
 Phone Number
Important Notice
STARTRADER does not accept any applications from Australian residents.
To comply with regulatory requirements, clicking the button will redirect you to the STARTRADER website operated by STARTRADER PRIME GLOBAL PTY LTD (ABN 65 156 005 668), an authorized Australian Financial Services Licence holder (AFSL no. 421210) regulated by the Australian Securities and Investments Commission.
Important Notice for Residents of the United Arab Emirates
In alignment with local regulatory requirements, individuals residing in the United Arab Emirates are requested to proceed via our dedicated regional platform at startrader.ae, which is operated by STARTRADER Global Financial Consultation & Financial Analysis L.L.C.. This entity is licensed by the UAE Capital Market Authority (CMA) under License No. 20200000241, and is authorised to introduce financial services and promote financial products in the UAE.
Please click the "Continue" button below to be redirected.


