








 Web Trader MT5











Key Takeaways
- Weak U.S. jobs data and soft economic signals reinforced bets on a 25 basis point rate cut in December, boosting safe-haven assets.
- Gold and silver rally amid dollar weakness and rate-cut bets
- Equities stabilize as investors balance risk sentiment with modest optimism ahead of the Fed.
- Crypto market sees sharp swings. Bitcoin and Ethereum recover from November losses.
Gold advances and silver reaches new record highs
Gold started December with a strong move. On December 1, gold surged nearly 1.7%, reaching around $4,264 per ounce, its highest in about six weeks. This came as markets pivoted toward expectations of a rate cut by the Fed in December’s meeting.
As the week progressed, gold prices held up well. Weak private-payrolls data mid-week reinforced dovish expectations, keeping gold supported above $4,200. And with the dollar under pressure, gold became more attractive to global buyers.
Meanwhile, silver surged even more aggressively. During the week, prices reached a new record high at $58.97 per ounce. The rally in silver is driven by a combination of factors, mainly rate-cut expectations, dollar softness, tightening supply conditions, and renewed safe-haven interest. The metal’s role in various industrial sectors also contributed to its strong performance.
US stocks
The U.S. equity market began December on shaky ground. On December 1, major indices, S&P 500, Dow Jones, and Nasdaq 100 closed lower by roughly 0.5–0.9% as risk-off sentiment hit big-tech and crypto-linked stocks.
Pressure on equities stemmed partly from a sharp sell-off in cryptocurrencies and concerns around AI companies’ valuations, which undermined risk appetite, and prompted some investors to rotate out of growth-sensitive and high-volatility assets. However, by mid-week, markets rebounded and indices pushed higher nearing previous record highs.
Looking forward, sentiment remains cautiously optimistic. With the upcoming Fed decision and economic data due, markets are eyeing a possible Santa rally, though underlying risks, including volatility in AI-linked stocks and macro uncertainty, keep investors on edge.
The Crypto Market Shows Signs of Recovery as Bitcoin Jumpse above $94,000
Crypto got off to a rough start this week. On December 1, crypto markets tumbled as Bitcoin dropped below $85,000, down significantly from recent peaks, while other major coins such as Ethereum and risk-linked crypto stocks also fell sharply as investors fled risk assets.
Midway through the week, crypto showed signs of stabilization. By December 3, Bitcoin bounced back toward the $90,000 level, helping soothe broader selling pressure and supporting some recovery in crypto-linked risk sentiment.
Markets appear to be bracing for sharp swings, as macro forces including policy expectations and USD dynamics may again determine crypto’s direction.
The current sentiment in the crypto market reflects caution about re-entering in force with positioning largely sensitive to policy and macro shifts rather than fundamentals.
Key Economic Data of the week
- ISM Manufacturing PMI numbers disappoint as they fell to 48.2 in November from October’s reading of 48.7
- Australian GDP rose 2.1% on a yearly basis, the strongest expansion since the third quarter of 2023
- Swiss annual inflation fell to 0% in November as prices continue to decline
- ADP Non-Farm Employment numbers fell by 32,000 in November versus 5,000 expected gains
- US ISM Services PMI exceeded expectations in November at 52.6, an increase from 52.4 in November
- US Weekly unemployment claims fall to 191K, below market expectations of 219K
Major Economic Calendar Events for the Upcoming Week
| Date | Metric | Country | Previous | Time [Dubai] |
| Monday, 8 December | Final GDP q/q | Japan | -0.40% | 3:50 AM |
| Tuesday, 9 December | Interest Rate Decision | Australia | 3.60% | 7:30 AM |
| Tuesday, 9 December | ADP Weekly Employment Change | USA | -13.5K | Tentative |
| Tuesday, 9 December | JOLTS Job Openings | USA | 7:00 PM | |
| Wednesday, 10 December | Interest Rate Decision | Canada | 2.25% | 6:45 PM |
| Wednesday, 10 December | Federal Funds Rate | USA | 4% | 11:00 PM |
| Thursday, 11 December | Unemployment Rate | Australia | 4.30% | 4:30 AM |
| Thursday, 11 December | Interest Rate Decision | Switzerland | 0.00% | 12:30 PM |
| Thursday, 11 December | Producer Price Index | USA | Tentative | |
| Friday, 12 December | Gross Domestic Product | UK | -0.10% | 11:00 AM |
Technical Analysis and Forecast:
Bitcoin Technical Analysis
Bitcoin has staged a notable recovery after reaching a recent low at $80,630, forming a sharp V-shaped rebound that lifted the price back above the 5-day and 10-day moving averages. Despite this improvement, the broader trend remains cautious, as the cryptocurrency continues to trade below the 30-day moving average, which is still sloping downward. This longer-term moving average now acts as the key resistance level, positioned around the $93,500–$95,000 zone.
In the short term, momentum has turned constructive thanks to the bullish crossover between the 5-day and 10-day moving averages, signaling early strength. The MACD confirms this shift, as the indicator has generated a bullish crossover.
Resistance at the $94,000–$95,000 area is crucial. A decisive breakout above this zone would signal a proper trend reversal and likely propel the price toward the $101,000 region. On the downside, support is seen near $88,500 and then $86,000, and a drop below $85,500 would invalidate the current bullish attempt.
Bitcoin Daily Chart
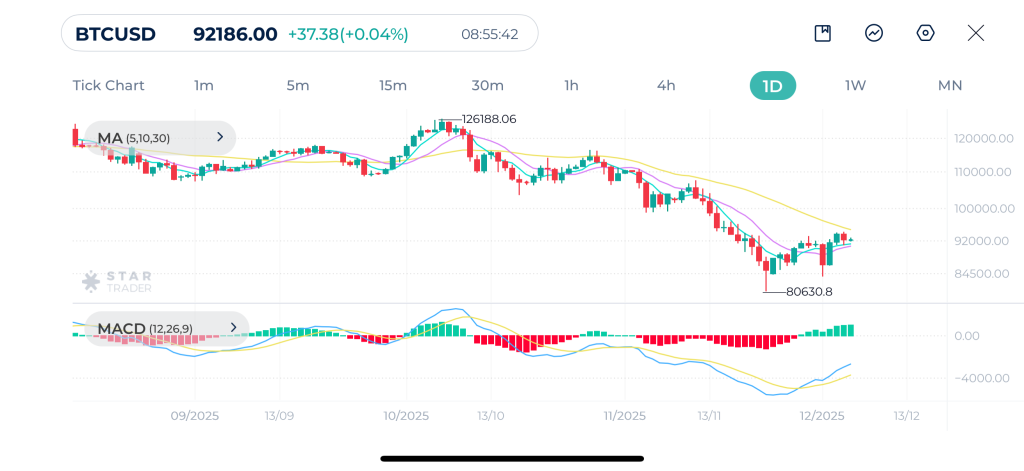
| Resistance | $96,674 – $97,000 | $99,122 – $99,400 | $101,306 – $101,540 |
| Support | $89,132 – $89,250 | $85,294 – $85,400 | $80,663 – $80,700 |
Dow Jones Technical Analysis
Dow Jones shows a clear upward movement on the daily chart. The index has formed clean, consistent higher highs and higher lows, confirming a strong bullish trend. Price action has pushed well above all key moving averages, and the alignment of the moving averages MA(5), MA(10), and MA(30) is now fully bullish.
Further supporting the bullish outlook is the MACD, which shows a strong upside crossover. MACD has also moved above the zero line.
The index is currently testing resistance around the 48,500–48,700 area. A break above this region would open the door for a move toward 49,300 and possibly the psychological 50,000 level. Support lies around 47,600 and then 46,900, and as long as prices remain above these zones, the bullish outlook for the Dow Jones remains firmly intact.
Dow Jones Daily Chart
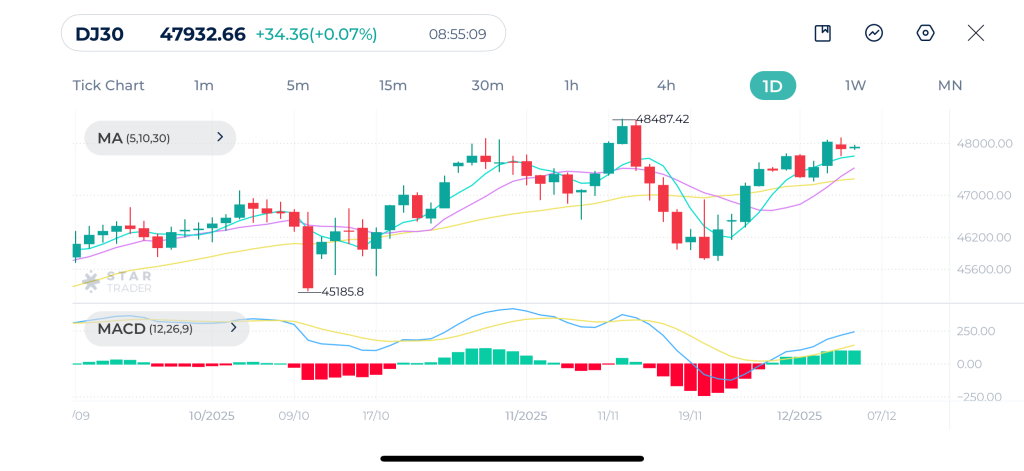
| Resistance | 48,416 – 48,420 | 48,500 – 48,513 | 48,625 – 48,650 |
| Support | 47,672 – 47,687 | 47,212 – 47,225 | 46,954 – 46,968 |
Silver Technical Analysis
The daily chart on silver shows a clear and sustained uptrend. This indicates strong buying interest and solid momentum. The current price of $58.25 is near the recorded high of $58.96, indicating the market is testing or trading around its recent peak.
All three Moving Averages are aligned in the correct order for a bullish trend, with the price trading well above all of them. This confirms the strength of the uptrend. The moving averages have acted as reliable dynamic support throughout the trend. MACD has been consistently positive and showing increasing bullish momentum.
Given the sharp recent rise and the price reaching record highs, It’s important to watch out for potential short-term pullbacks or consolidations. The closest significant support would be the previous highs around $54-$55 and the dynamic support provided by the Moving Averages.
Silver Daily Chart
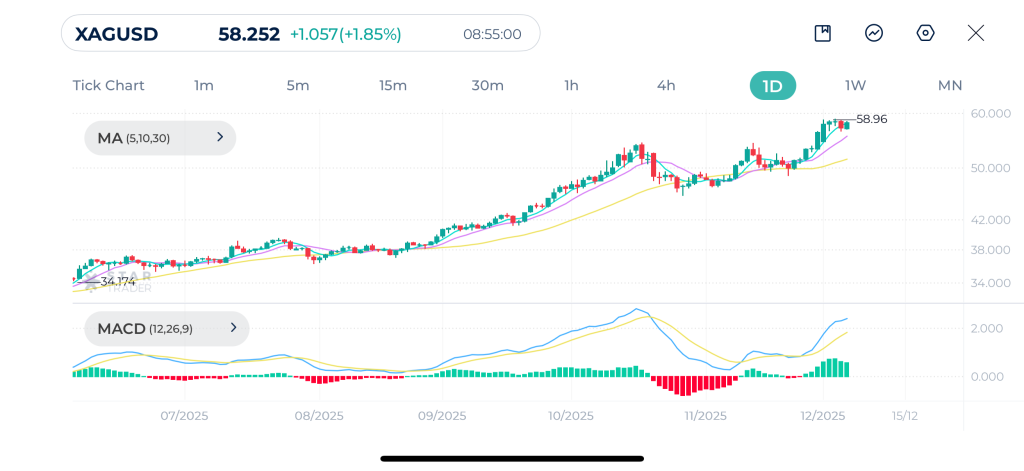
| Resistance | $58.97 – $59.10 | $59.25 – $59.31 | $59.50 – $59.56 |
| Support | $56.54 – $56.60 | $54.54 – $54.62 | $53.28 – $53.35 |
EURUSD Technical Analysis
EURUSD has been showing a steady recovery after bouncing from the November lows around 1.1450, with price action forming a series of higher highs and higher lows. The pair is now trading above the 5-day and 10-day moving averages, indicating improving short-term momentum. Meanwhile, the 30-day moving average has started to flatten, suggesting that the broader bearish structure may be losing strength and potentially shifting toward a medium-term reversal if the upside continues.
The moving averages are starting to align in a supportive structure for buyers, with the 5-day average already pushing above the 10-day one, while price trades comfortably above both. A sustained break above the 30-day moving average would provide additional confirmation that buyers are regaining control.
On the MACD, a fresh bullish crossover has developed, signaling strengthening upward momentum.
Overall, immediate support sits around 1.1580, while resistance lies near 1.1730 and then 1.1800. As long as EURUSD remains above the 1.1550 region, the bullish bias remains intact.
EURUSD Daily Chart
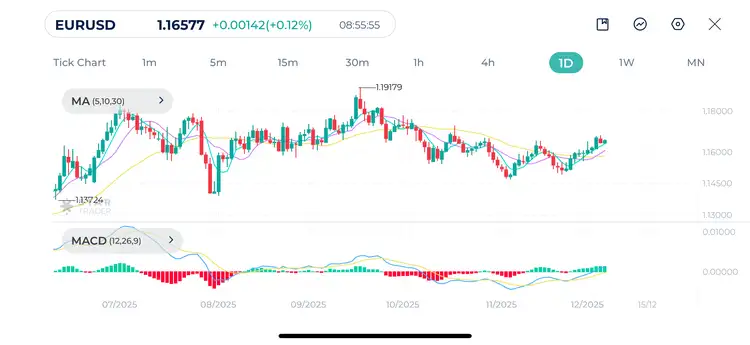
| Resistance | 1.1720 – 1.1727 | 1.1749 – 1.1760 | 1.1821 – 1.1830 |
| Support | 1.1620 – 1.1624 | 1.1586 – 1.1590 | 1.1555 – 1.1560 |
Tags


Open Live Account
 Email Address
 Phone Number
Important Notice
STARTRADER does not accept any applications from Australian residents.
To comply with regulatory requirements, clicking the button will redirect you to the STARTRADER website operated by STARTRADER PRIME GLOBAL PTY LTD (ABN 65 156 005 668), an authorized Australian Financial Services Licence holder (AFSL no. 421210) regulated by the Australian Securities and Investments Commission.
Important Notice for Residents of the United Arab Emirates
In alignment with local regulatory requirements, individuals residing in the United Arab Emirates are requested to proceed via our dedicated regional platform at startrader.ae, which is operated by STARTRADER Global Financial Consultation & Financial Analysis L.L.C.. This entity is licensed by the UAE Capital Market Authority (CMA) under License No. 20200000241, and is authorised to introduce financial services and promote financial products in the UAE.
Please click the "Continue" button below to be redirected.


