








 Web Trader MT5













Key Takeaways
- Global equities under pressure: Hotter than expected US inflation and rising yields weighed on stocks, particularly technology and semiconductor shares.
- South Korean chip stocks plunged: SK Hynix and Samsung fell sharply as CXMT’s progress intensified concerns about Chinese competition and future memory chip oversupply.
- Inflation complicates Fed policy: US CPI rose to 3.7% annually in September, while PPI accelerated, keeping interest rate expectations and Treasury yields in focus.
- AI optimism faces new challenges: Strong TSMC and ASML results highlighted robust AI demand, but concerns over valuations, financing costs, and potential oversupply clouded sentiment.
- Oil remains elevated: Middle East tensions and risks to Strait of Hormuz shipping sustained the geopolitical premium, while potential Russian diesel supplies and sanctions relief could alter the outlook.
- Gold remains resilient: Despite pressure from higher yields and a stronger dollar, gold recovered toward $4,155 after briefly falling below $4,100.
- Next week hinges on earnings and economic data: Corporate results, US housing indicators, jobless claims, and business activity surveys could determine whether markets stabilize or extend their declines.
Global equities: AI concerns trigger a worldwide sell-off
Global equities faced significant selling pressure during the week as investors reassessed technology valuations, financing costs, and the outlook for Federal Reserve policy. After US inflation data came in hotter than expected, technology and semiconductor stocks led the decline, with the Nasdaq falling 1.88% on Wednesday and the S&P 500 losing 1.11%. The sell-off spread across Asia and Europe, reflecting growing concerns about the sustainability of the AI-driven rally.
South Korea was among the hardest hit markets. On Thursday, the KOSPI plunged 8.1%, triggering trading halts as semiconductor stocks suffered heavy losses. SK Hynix fell nearly 11%, while Samsung Electronics declined approximately 9.5%. The market recovered partially on Friday, with the KOSPI gaining around 3%, but investor sentiment remained fragile.
What triggered the semiconductor sell-off?
The decline reflected three interconnected concerns. First, China’s ChangXin Memory Technologies (CXMT) announced advances in memory chip technology, intensifying competition for established manufacturers and raising concerns about potential oversupply as new production capacity comes online toward the end of the decade.
Second, investors became increasingly concerned about the financing requirements of AI infrastructure. Executives from Broadcom and Intel warned that access to capital could become a significant obstacle to further AI expansion, particularly as borrowing costs rise.
Third, stronger US inflation increased the risk of additional interest rate hikes, potentially raising financing costs and reducing the valuation investors are willing to pay for high-growth technology companies.
Despite the sell off, semiconductor fundamentals remain relatively strong. Taiwan Semiconductor Manufacturing Company (TSMC) reported record third quarter revenue and profit, supported by continued AI chip demand. ASML also reported stronger than expected profits. However, these results failed to prevent the broader sector decline, highlighting how macroeconomic risks and valuation concerns are increasingly influencing investor decisions.
Outlook for 19–23 October: Semiconductor stocks are likely to remain volatile as investors assess upcoming technology earnings, AI infrastructure spending, and competition from China. Strong earnings and forward guidance could support a recovery, but disappointing results or further concerns about financing and chip oversupply could extend the sell-off.
US inflation and the Federal Reserve: Rate-hike expectations rise
US inflation was the most important macroeconomic development of the week, reinforcing concerns that price pressures remain too persistent for the Federal Reserve to ease monetary policy.
The September Consumer Price Index (CPI), released Wednesday, showed that headline inflation accelerated to 3.7% year-on-year, up from 3.4% in August and above the 3.6% forecast. Monthly CPI increased by 0.6%, compared with 0.4% in August.
Core CPI, which excludes food and energy, rose to 2.6% year-on-year from 2.4%, exceeding the 2.5% forecast. Monthly core inflation increased by 0.3%, against expectations of 0.2%. Rising gasoline prices contributed significantly to headline inflation, but price increases across other categories suggested that inflationary pressures were not limited to energy.
Thursday’s Producer Price Index (PPI) report reinforced these concerns. Producer prices increased by 1.3% month-on-month in September, the largest monthly rise since March 2022. Annual PPI inflation accelerated to 6.3%, its highest level since December 2022. Energy prices were a major contributor, with final-demand energy prices rising 10.8% during the month. Core PPI, excluding food, energy, and trade services, increased by 0.5% monthly.
Outlook for 19–23 October: With the next Fed meeting approaching on 27–28 October, investors will assess whether inflation remains sufficiently persistent to justify further tightening. The focus will shift to incoming economic indicators, corporate earnings, and comments from policymakers. Continued inflationary pressure could revive expectations of a rate hike, while signs of economic moderation and a more patient Fed could help stabilize equities and bond markets.
Oil: Prices remain elevated amid geopolitical risks and potential changes to Russian sanctions
Oil markets remained volatile throughout the week, with geopolitical tensions and concerns about supply disruptions keeping prices elevated.
Brent crude traded above $100 per barrel, reaching approximately $105.92 on Thursday, while WTI rose to $97.97. Attacks on vessels near the Strait of Hormuz, escalating tensions involving Iran and Saudi Arabia, and uncertainty surrounding the security of energy infrastructure sustained a geopolitical risk premium in oil prices.
At the same time, the market assessed potential measures to increase global fuel availability.
President Donald Trump announced an agreement with Russian President Vladimir Putin under which Russia would supply additional diesel to global markets. The announced shipments included more than 300,000 tonnes initially, followed by further shipments in November and subsequent months. The US also temporarily eased restrictions on Russian diesel imports.
Outlook for 19–23 October: Oil prices are likely to remain highly sensitive to developments in the Middle East, shipping security, and changes to Russian oil sanctions. Further attacks or disruptions around the Strait of Hormuz could push prices higher. Conversely, additional supply, improved shipping conditions, or credible progress toward de-escalation could ease prices.
Gold: Inflation concerns limit recovery, but prices remain above $4,100
Gold struggled during the week as stronger-than-expected US inflation data increased expectations of further Federal Reserve tightening. Higher interest-rate expectations and a stronger US dollar reduced the appeal of the non-yielding precious metal.
Following Wednesday’s CPI report, spot gold fell approximately 1.7% to around $4,086 per ounce, its lowest level since October 7. However, the metal subsequently recovered, trading around $4,155 on Friday. Despite this rebound, gold remained on track for a weekly decline of approximately 1%.
Outlook for 19–23 October: Gold’s direction will depend heavily on movements in the US dollar, Treasury yields, and expectations for Fed policy. Persistent inflation and rising yields could put renewed pressure on prices, while a more patient Fed, declining yields, or escalating geopolitical tensions could support a recovery.
The ability of gold to hold above $4,100 will remain an important near-term indicator of market sentiment.
Major Economic Calendar Events for the Upcoming Week
| Date | Metric | Country | Previous | Time [Dubai] |
|---|---|---|---|---|
| Monday, 19 October | Median CPI y/y | Canada | 2.0% | 4:30 PM |
| Wednesday, 21 October | Consumer Price Index y/y | UK | 3.1% | 10:00 AM |
| Thursday, 22 October | Consumer Price Index q/q | New Zealand | 1.5% | 1:45 AM |
| Thursday, 22 October | Unemployment Claims | USA | 4:30 PM | |
| Friday, 23 October | Flash Manufacturing PMI | Euro | 52.9 | 12:00:00 |
| Friday, 23 October | Flash Services PMI | Euro | 53 | 12:00:00 |
| Friday, 23 October | Flash Manufacturing PMI | UK | 52.1 | 12:30:00 |
| Friday, 23 October | Flash Services PMI | UK | 51.9 | 12:30:00 |
| Friday, 23 October | Flash Manufacturing PMI | USA | 55.9 | 5:45 PM |
| Friday, 23 October | Flash Services PMI | USA | 58.8 | 5:45 PM |
Technical Analysis and Forecast:
Brent Technical Analysis – Long-term uptrend, short-term consolidation
Brent crude is trading at $107.61. Although oil has recently consolidated near its highs, the broader price structure remains bullish. The latest candles indicate some profit taking and a loss of short term momentum, but there is not yet clear technical confirmation of a major trend reversal.
The moving averages continue to support the broader uptrend. Price has slipped below the 5-day moving average but remains above the 10-day and 20-day moving averages. The positive alignment of the averages suggests that the broader upward trend is still intact, although the recent pullback indicates that buyers are facing resistance near the latest highs.
Immediate support lies around $107.40, followed by $105.70 and $102.30 On the upside, resistance is located around $108.50–$109.00, followed by the recent high at $110.42. A recovery above $109.00 would strengthen the bullish outlook and bring another test of $110.42 into focus. Conversely, a break below $105.70 would suggest a deeper correction toward $102.30.
Overall, the outlook remains neutral to cautiously bullish while price holds above $105.70. However, crude oil remains particularly sensitive to geopolitical developments, supply disruptions, and changes in global demand expectations, which could accelerate price movements in either direction.
Brent Daily Chart
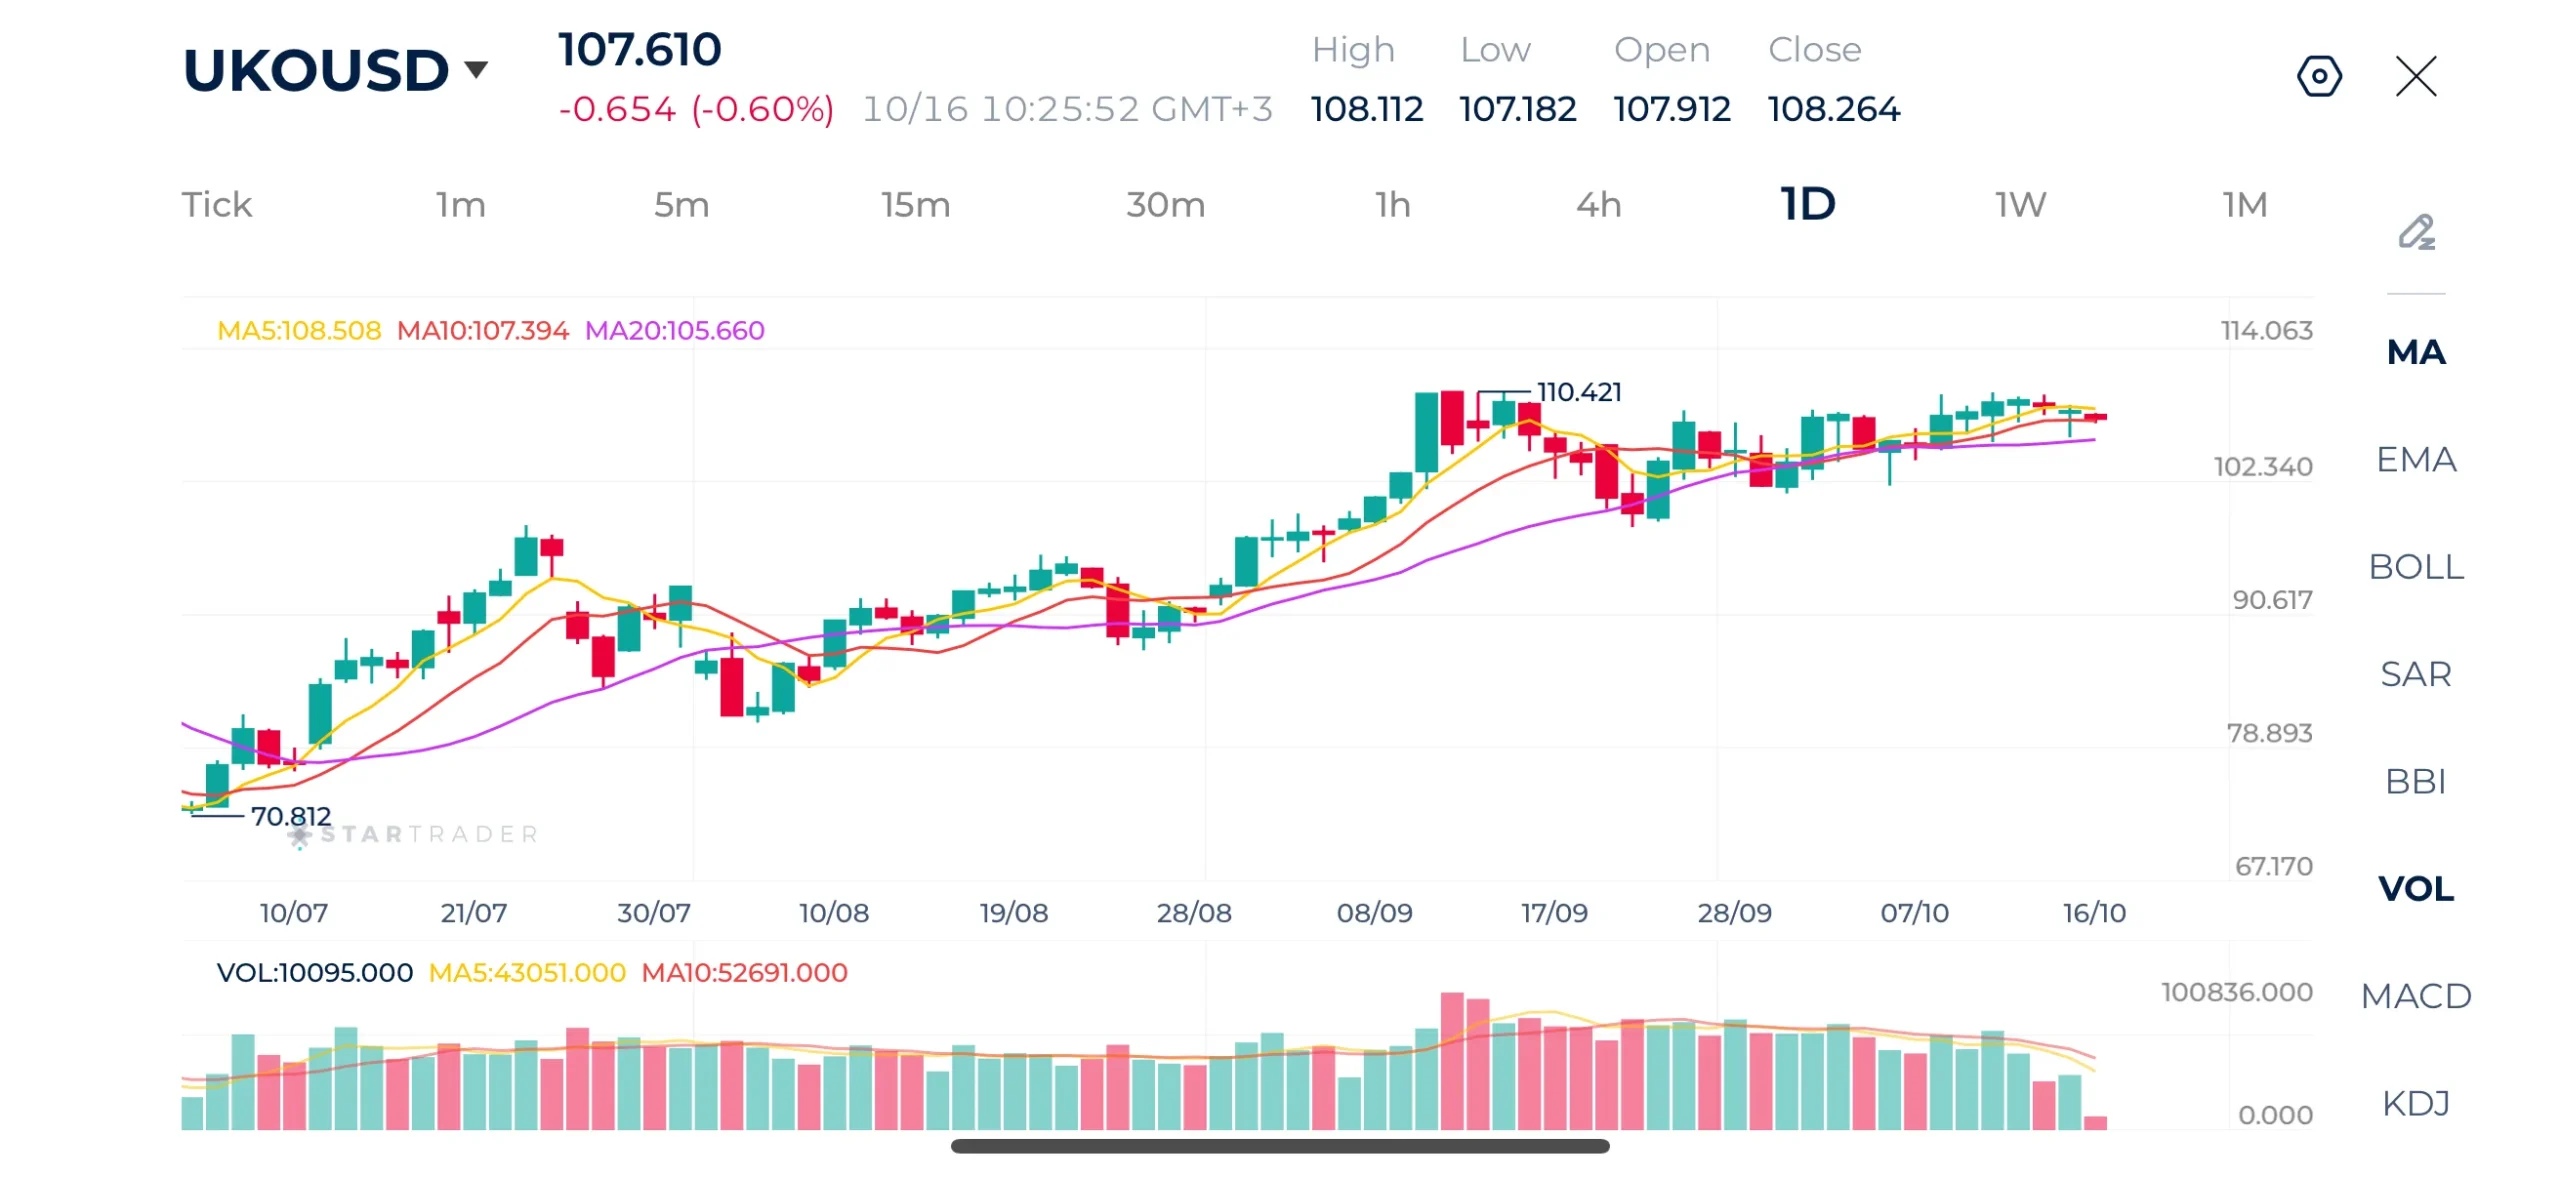
Source: STARTRADER app | Oil prices continue to rise due to tensions in the Middle East
| Resistance | $109.00 – $109.13 | $110.42 – $110.50 | $112.14 – $112.21 |
|---|---|---|---|
| Support | $107.40 – $107.50 | $105.70 – $105.75 | $102.30 – $102.38 |
S&P 500 Technical Analysis — Consolidation with a mildly bullish bias
The S&P 500 is trading at 7,762. The index recovered strongly from its late July low of 7,299 before reaching a recent high of 7,850. Since then, price has pulled back and entered a consolidation phase, with the latest candles indicating a modest recovery after recent weakness.
The moving averages reflect this mixed picture. Immediate support is located around 7,750, followed by the 7,700–7,710 area and then 7,575. On the upside, resistance lies around 7,788–7,800, followed by the recent high at 7,850. A sustained move above 7,800 would improve the technical outlook and potentially trigger another test of 7,850. In contrast, a decisive break below 7,750 could expose the index to a deeper correction toward 7,700 or 7,575. Overall, the outlook is neutral to cautiously bullish while the index holds above its 20-day moving average, but confirmation of renewed upside momentum is still needed.
S&P 500 Daily Chart
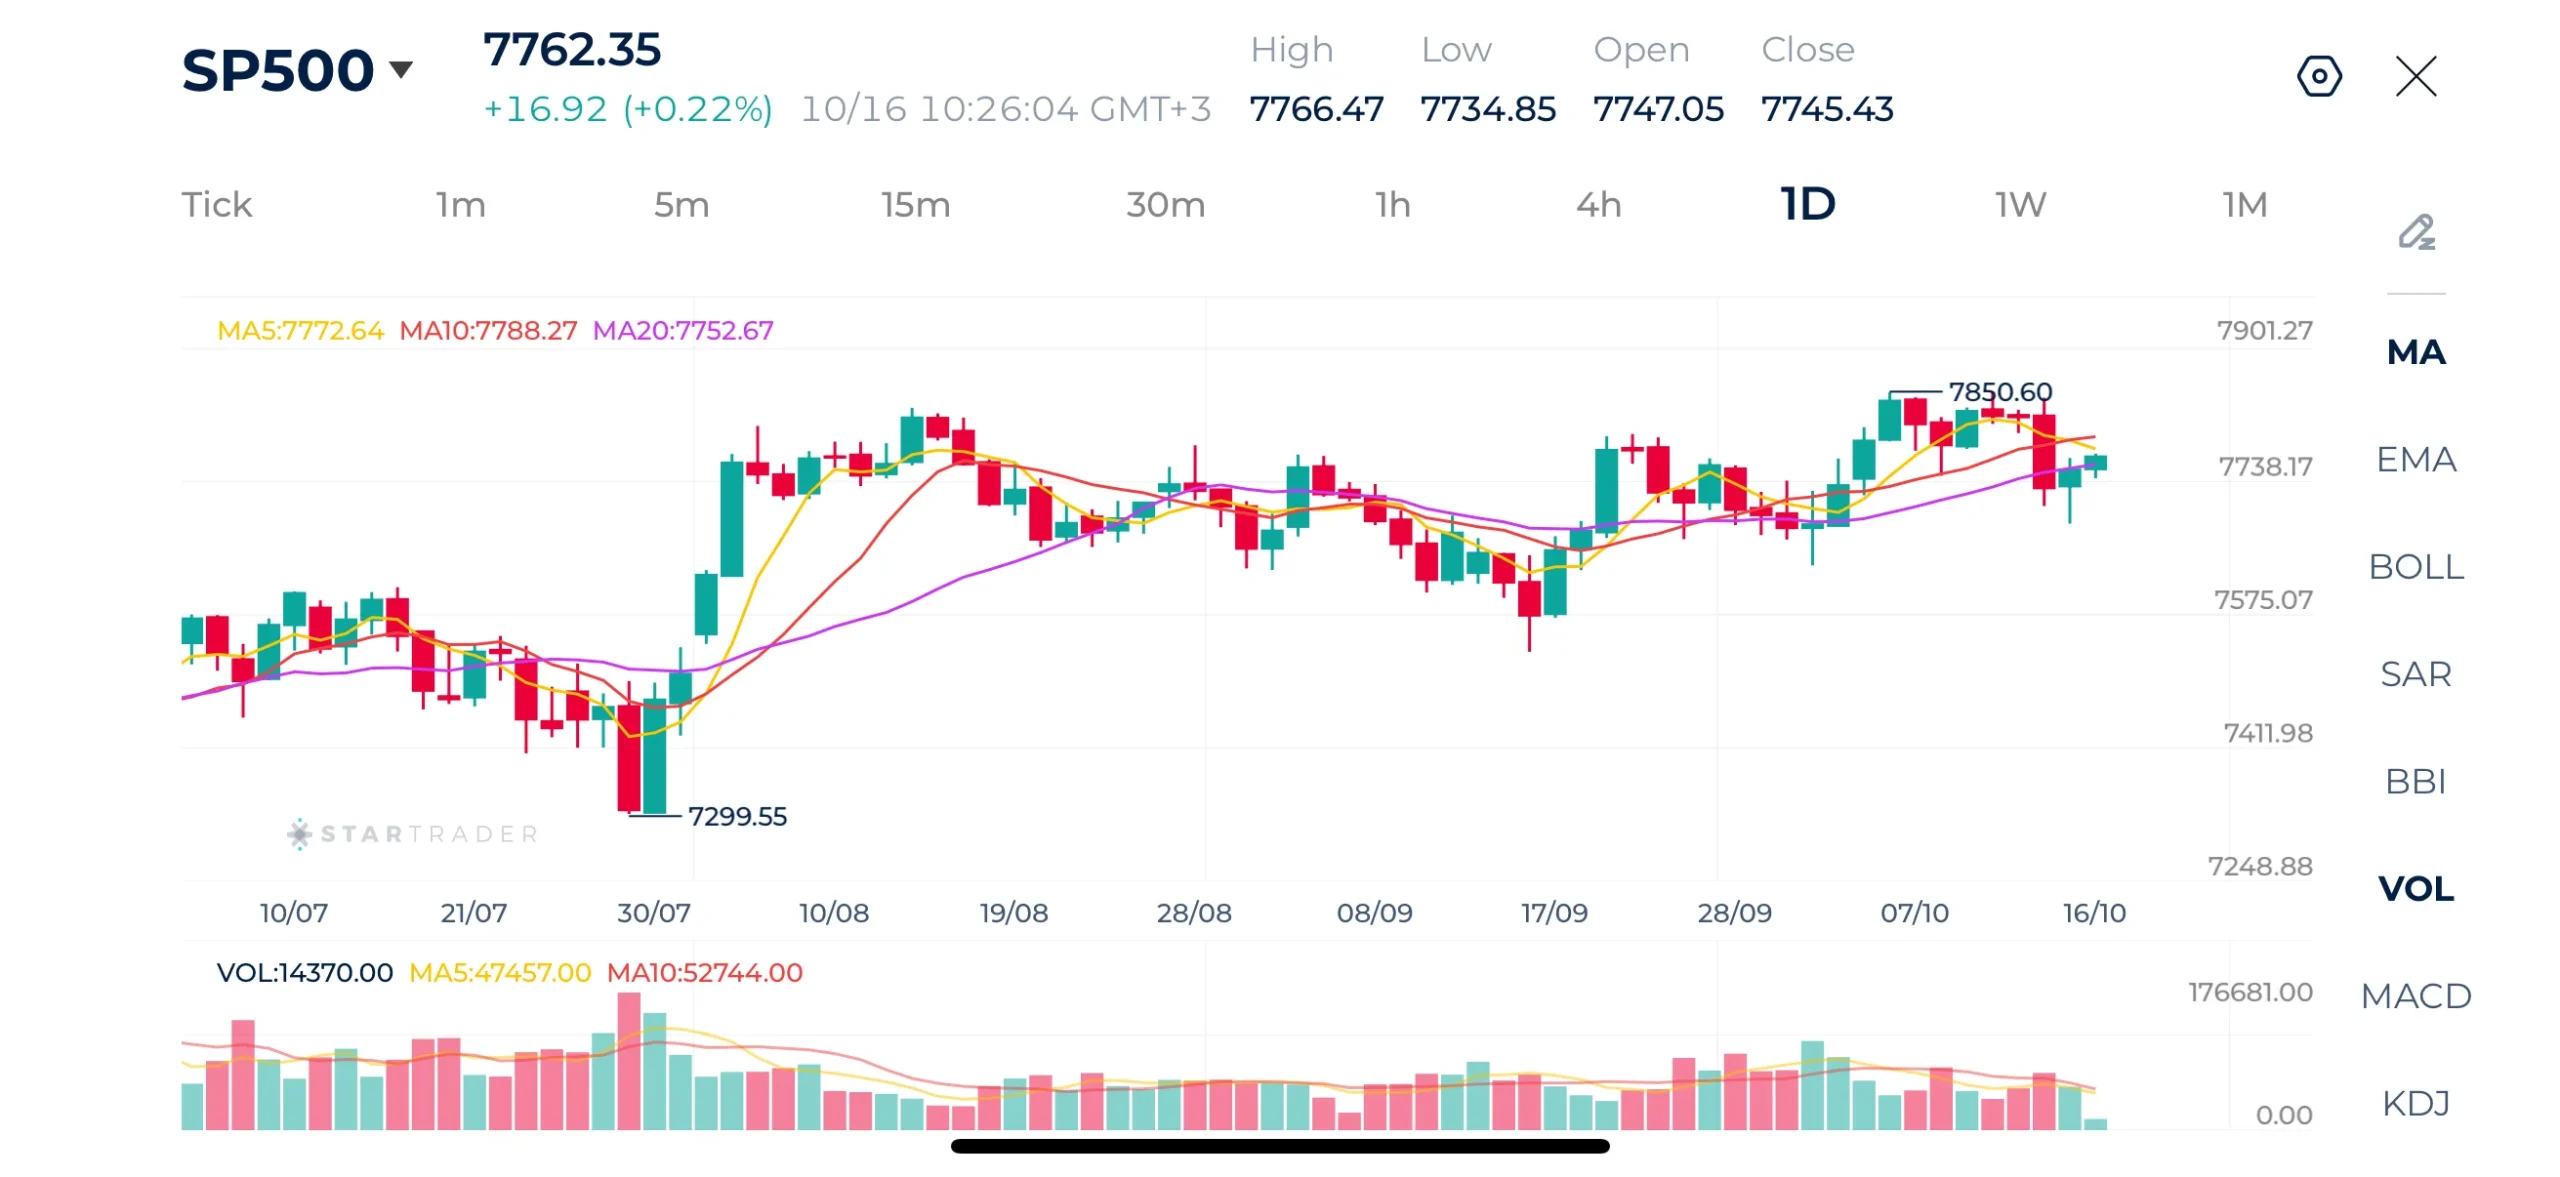
Source: STARTRADER app | S&P 500 faces pressure from rising yields, but strong earnings could change the narrative
| Resistance | 7,800 – 7,805 | 7,850 – 7,858 | 7,900 – 7,905 |
|---|---|---|---|
| Support | 7,700 – 7,710 | 7,575 – 7,580 | 7,480 – 7,492 |
Gold Technical Analysis — Sideways consolidation after a major correction
Gold is trading at $4,187, losing considerable ground through September. The precious metal has stabilized around the $4,100–$4,200 region following its sharp decline toward the end of September. Nevertheless, the recovery remains limited, and the market has yet to establish a convincing new upward trend.
The moving averages suggest that gold is attempting to recover in the short term. Price is trading above the two shorter 5-day and 10-day moving averages but remains marginally below the 20-day moving average, which is acting as an important barrier.
Support is located around $4,150–$4,160, followed by $4,110 and the broader $3,950–$4,000 region. Resistance stands around $4,193–$4,200, followed by $4,328 and $4,546. A sustained break above $4,200 could extend the rebound toward $4,328. However, a move below $4,150 would weaken the recovery and expose the $4,110 area.
Overall, the short-term outlook remains neutral to slightly bearish while gold trades below $4,200, and the broader corrective structure remains intact until the metal reclaims higher resistance levels and establishes a sequence of higher highs and higher lows.
Gold Daily Chart
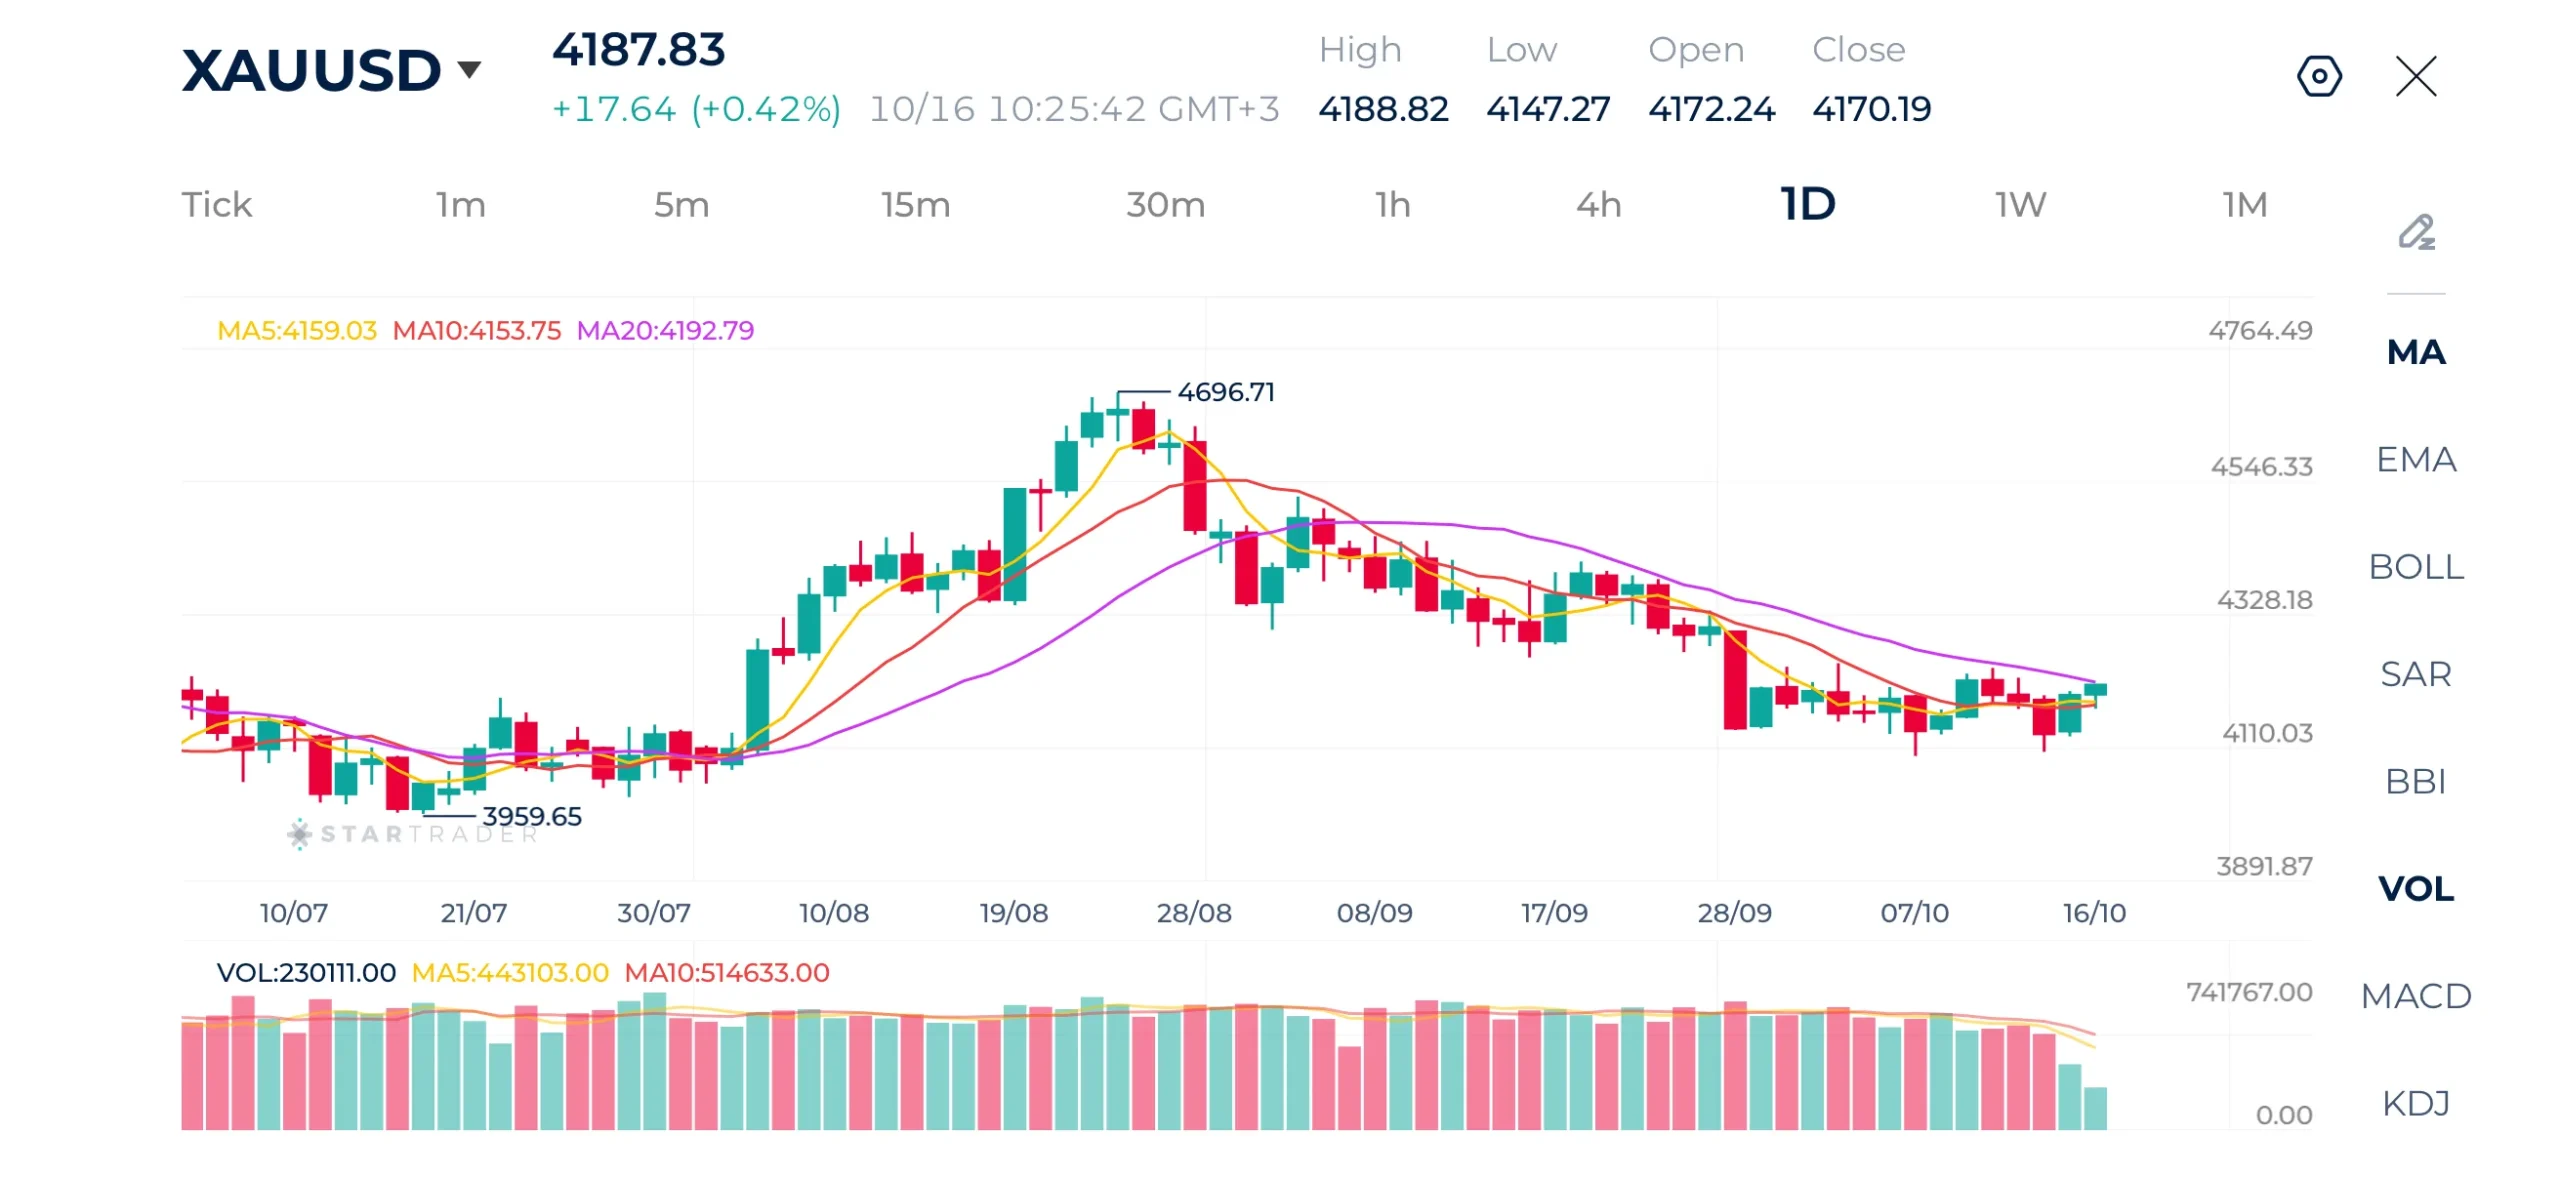
Source: STARTRADER app | Gold faces pressure from rising yields, but holds above $4,100
| Resistance | $4,193 – $4,200 | $4,328 – $4,340 | $4,546 – $4,550 |
|---|---|---|---|
| Support | $4,100 – $4,110 | $3,950 – $3,960 | $3,900 – $3,905 |
EURUSD Technical Analysis — Bearish trend, short-term rebound
EURUSD is trading at 1.1246. The pair remains in a clear medium-term downtrend after falling from its August high of 1.1710 to a recent low of 1.1112.
The moving averages indicate improving short-term momentum. Price has moved above all three averages MA(5), MA(10), and MA(20). This suggests that the recovery is developing within a broader bearish structure rather than confirming a full trend reversal.
On the downside, immediate support lies around 1.1200, followed by the recent low at 1.1112. On the upside, resistance is located around 1.1282, followed by 1.1412. A sustained break above 1.1282 would strengthen the recovery and potentially open the way toward 1.1412. Conversely, a move below 1.1200 would weaken the rebound, while a break below 1.1112 would signal renewed selling pressure. Overall, the short-term outlook is cautiously bullish as long as the pair holds above 1.1200, although the broa
EURUSD Daily Chart
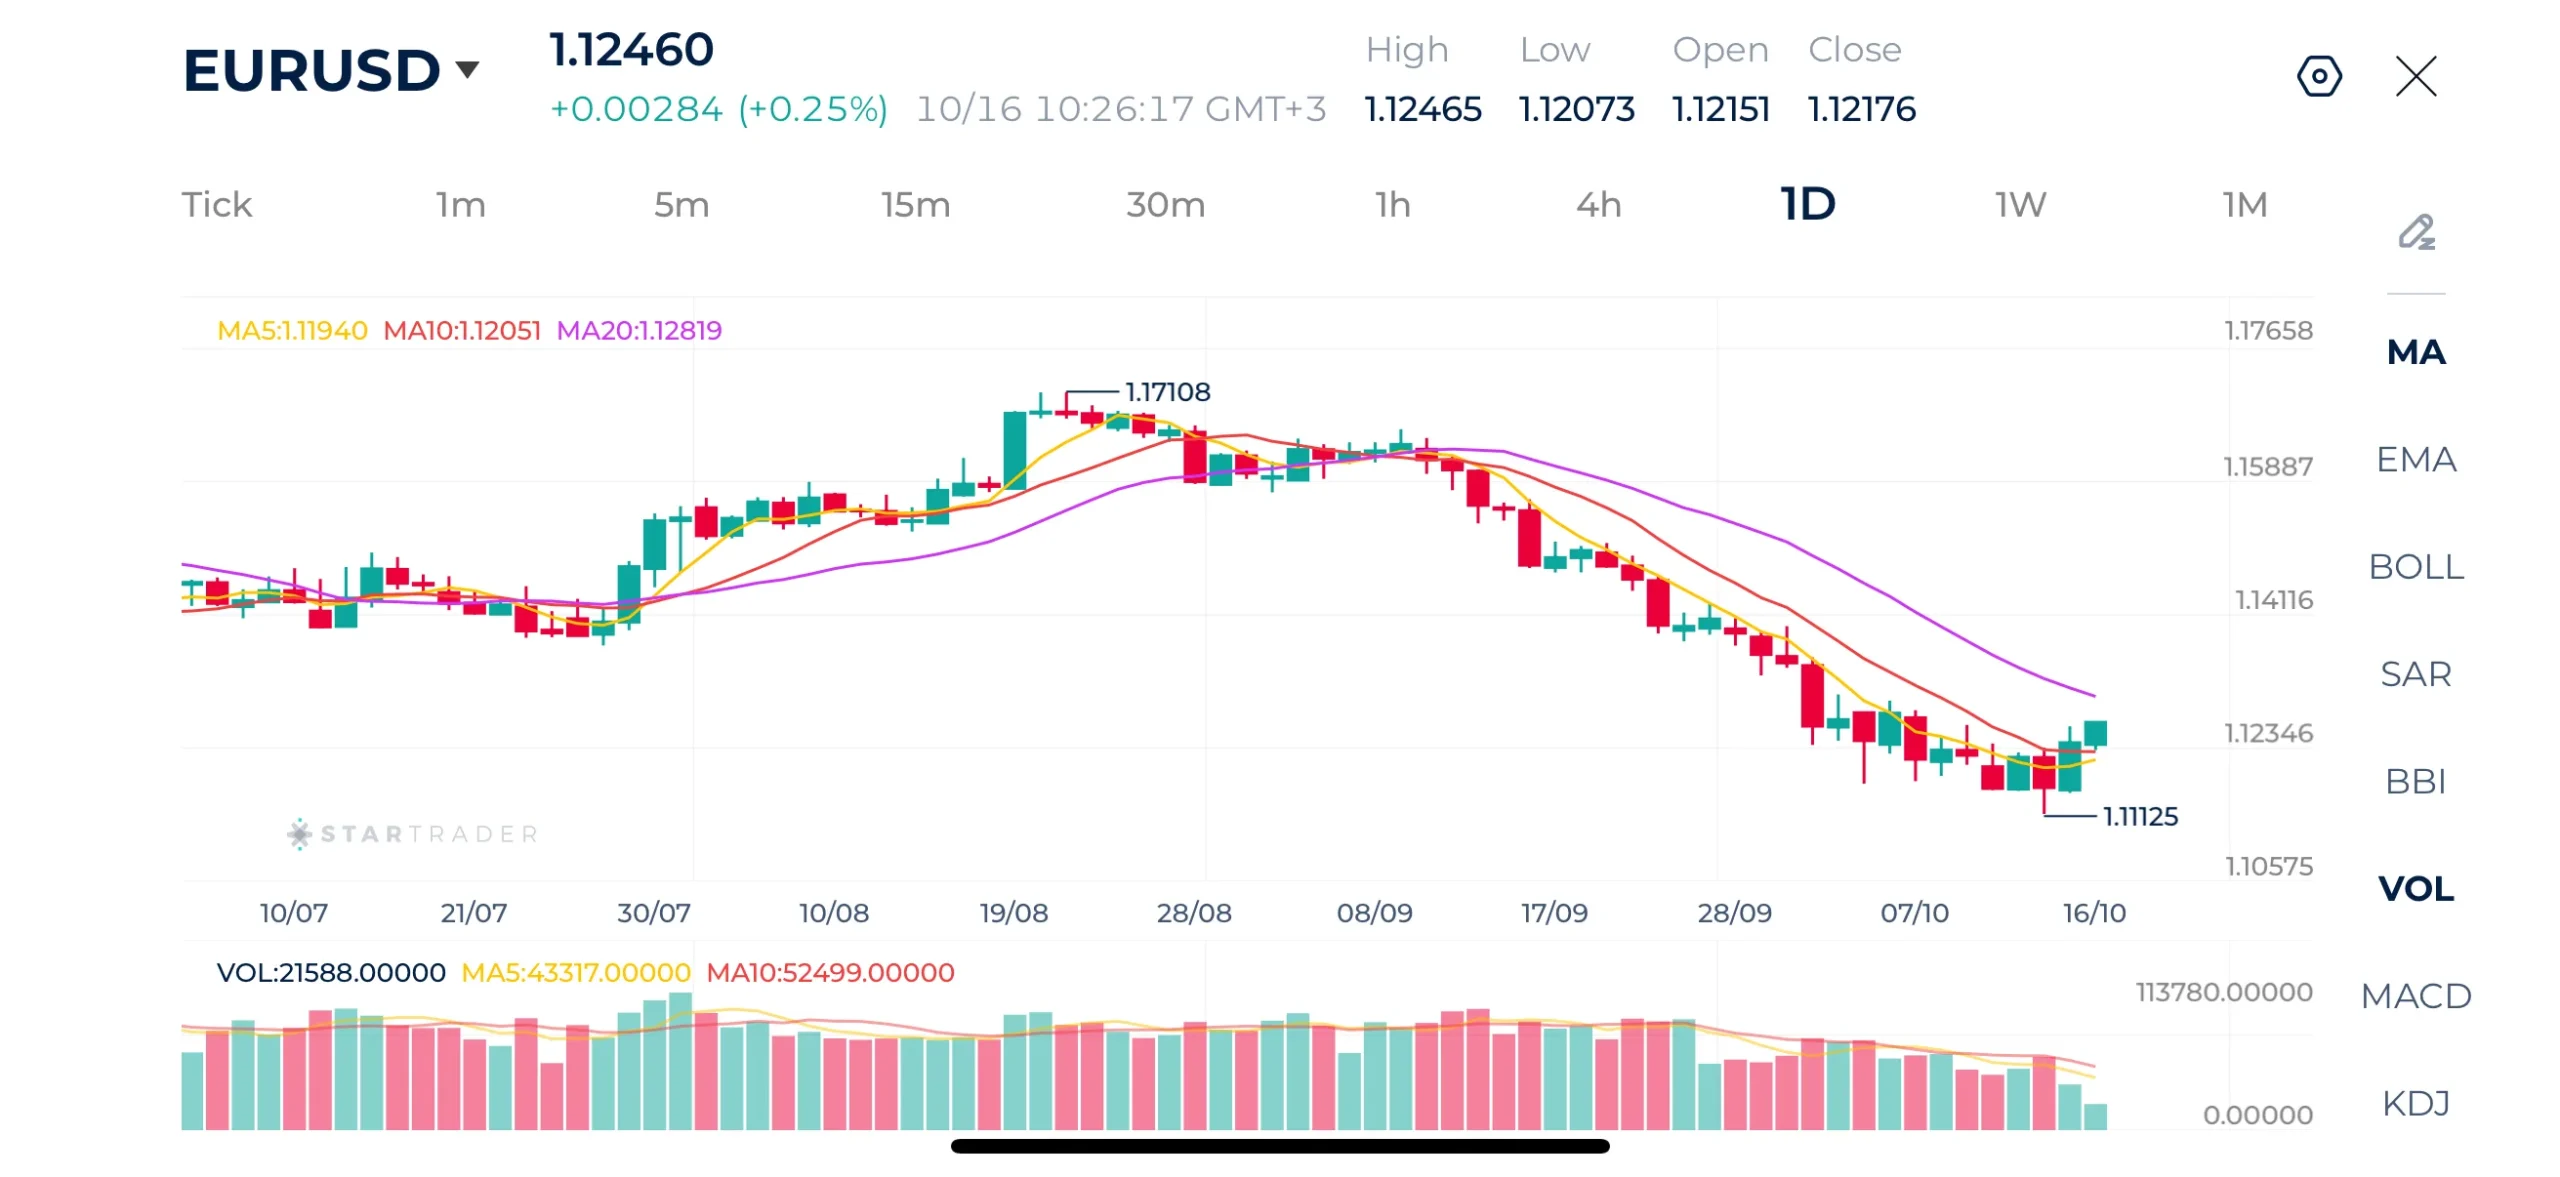
Source: STARTRADER app | EURUSD recovers after falling to 17-month low
| Resistance | 1.1282 – 1.1290 | 1.1377 – 1.1385 | 1.1420 – 1.1432 |
|---|---|---|---|
| Support | 1.1192 – 1.1200 | 1.1112 – 1.1118 | 1.1075 – 1.1180 |
Risk Disclaimer: This material is provided for informational purposes only and does not constitute a recommendation or investment advice. Trading financial instruments on margin involves substantial risk and may not be appropriate for all investors.
Tags


Open Live Account
 Email Address
 Phone Number
Important Notice
STARTRADER does not accept any applications from Australian residents.
To comply with regulatory requirements, clicking the button will redirect you to the STARTRADER website operated by STARTRADER PRIME GLOBAL PTY LTD (ABN 65 156 005 668), an authorized Australian Financial Services Licence holder (AFSL no. 421210) regulated by the Australian Securities and Investments Commission.
Important Notice for Residents of the United Arab Emirates
In alignment with local regulatory requirements, individuals residing in the United Arab Emirates are requested to proceed via our dedicated regional platform at startrader.ae, which is operated by STARTRADER Global Financial Consultation & Financial Analysis L.L.C.. This entity is licensed by the UAE Capital Market Authority (CMA) under License No. 20200000241, and is authorised to introduce financial services and promote financial products in the UAE.
Please click the "Continue" button below to be redirected.


