








 Web Trader MT5













Key Takeaways
- Gold surged more than 4% during the week to $4,530–$4,555, for a third straight weekly gain.
- The Dollar Index fell to a three-month low near 98.50–98.80, down roughly 1% for the week.
- The 30-year Treasury yield hit 5.33% intraday, its highest level since 2007.
- Treasury’s surprise move to double long-end debt buybacks triggered gold’s jump and hammered the dollar.
- Equities pulled back from record highs in a broad, volatility-driven correction.
- Oil prices rise as US-Iran tensions kept inflation fears alive due to higher energy prices.
Gold Breaks Above $4,500
Gold delivered its strongest weekly performance in months, closing in on a third consecutive weekly gain. The prcious metal began the week trading in the mid-$4,300s and traded Friday near $4,530–$4,555 per ounce. Prices jumped after the U.S. Treasury announced it would at least double its long-term debt buyback program. Gold held the bulk of its gains even as Treasury yields partially reversed course on Thursday.
Lower yields reduce the opportunity cost of holding a zero-coupon asset like gold. Layered on top of that was the structural bid gold has enjoyed all year. The central banks bought a record 288 tonnes in the second quarter alone and a dollar that was already on its back foot heading into the announcement.
The Dollar Index Slides to Three-Month Low
The U.S. Dollar Index mirrored gold’s move in reverse, falling for a fourth straight week to its lowest level since May, briefly touching the mid-98.00s on Thursday before stabilizing near 98.70–98.80 into Friday’s close, a weekly decline of roughly 1%. The dollar’s slide accelerated the moment the Treasury buyback news hit the tape on Wednesday. Softening Fed rate-hike odds compounded the pressure, expectations for a September hike fell from roughly 40% to the low-30s as traders digested cooler retail sales and inflation prints from earlier in the month.
Stocks Experience a Bond-Driven Correction
Equities spent the week grinding lower. The S&P 500, Dow, and Nasdaq fell in four of five sessions this week. Monday and Tuesday saw broad-based selling as oil spiked on Iran-related supply fears and the 30-year yield tore through two-decade highs. The Nasdaq lost over 1% intraday on Tuesday alone as semiconductor names were hit particularly hard. Wednesday’s Treasury buyback announcement offered brief relief, but Thursday erased it.
Outlook for the Week of August 24–28, 2026
Gold: The path of least resistance remains higher. With gold holding above $4,500 into the weekend and central bank buying providing a structural floor, a push toward the $4,600–$4,700 resistance zone looks achievable if yields stay contained. The key risk is a Treasury-yield snapback. If PCE data or Fed commentary revives hike expectations, expect a sharp but likely shallow pullback toward $4,400–$4,450.
US Dollar Index: Bias stays to the downside. Momentum, softer Fed-hike odds, and the buyback-driven liquidity narrative all argue for a retest of the 98.00–98.50 area, with the three-month low near 98.50 as the first line in the sand. A break below opens the door toward the 97.50 region. The dollar’s best chance of a bounce would come from a hawkish surprise in Fed commentary or a re-escalation in the US-Iran conflict.
Equities: The pullback from recent records has room to extend if 30-year yields reassert themselves above 5.3%, particularly in rate-sensitive tech and semiconductors. But a stabilization in yields, helped by the Treasury’s buyback support could trigger a relief rally back toward prior highs. The next real catalyst is Nvidia earnings and the run-up to the Fed’s Jackson Hole symposium, both of which will likely set the tone into month-end. Until then, expect the S&P 500 to trade a choppy range roughly bounded by 7,550 on the downside and 7,800 on the upside.
Major Economic Calendar Events for the Upcoming Week
| Date | Metric | Country | Previous | Time [Dubai] |
|---|---|---|---|---|
| Tuesday, 25 August | CB Consumer Confidence | USA | 90.8 | 6:00 PM |
| Tuesday, 25 August | New Home Sales | USA | 628K | 6:00 PM |
| Wednesday, 26 August | Consumer Price Index y/y | Australia | 3.80% | 5:30 AM |
| Wednesday, 26 August | Core PCE Price Index y/y | USA | 0.033 | 4:30 PM |
| Wednesday, 26 August | Gross Domestic Product q/q | USA | 1.5% | 4:30 PM |
| Wednesday, 26 August | Durable Goods Orders | USA | 0.5% | 4:30 PM |
| Thursday, 27 August | Unemployment Claims | USA | 4:30 PM | |
| Thursday, 27 August | Jackson Hole Symposium Day 1 | USA | ||
| Friday, 28 August | Gross Domestic Product m/m | Canada | 0.3% | 4:30 PM |
| Friday, 28 August | Prelim Benchmark Payrolls Revision | USA | -911K | 6:00 PM |
| Friday, 28 August | Jackson Hole Symposium Day 2 | USA |
Technical Analysis and Forecast:
Gold Technical Analysis
Gold has entered a strong bullish recovery phase, trading above $4,500 after gaining more than 4% during the week. All three daily moving averages MA(5), MA(10), and MA(20) are rising, with price comfortably above them.
The immediate resistance is now around $4,600, followed by the previous major high around $4,890. If gold can establish itself above $4,600, the broader technical structure would support further upside toward the $4,700–$4,800 area before a potential retest of $4,890.
On the downside, $4,500–$4,505 has become the first important support following the breakout. Below that, $4,425 and then $4,275 represent progressively stronger support zones based on the moving averages. The rising volume accompanying the recent advance adds credibility to the breakout. Overall, the technical bias is strongly bullish, although the sharp rally means short-term pullbacks should not be ruled out. As long as gold remains above $4,500, the breakout structure remains intact.
Gold Daily Chart
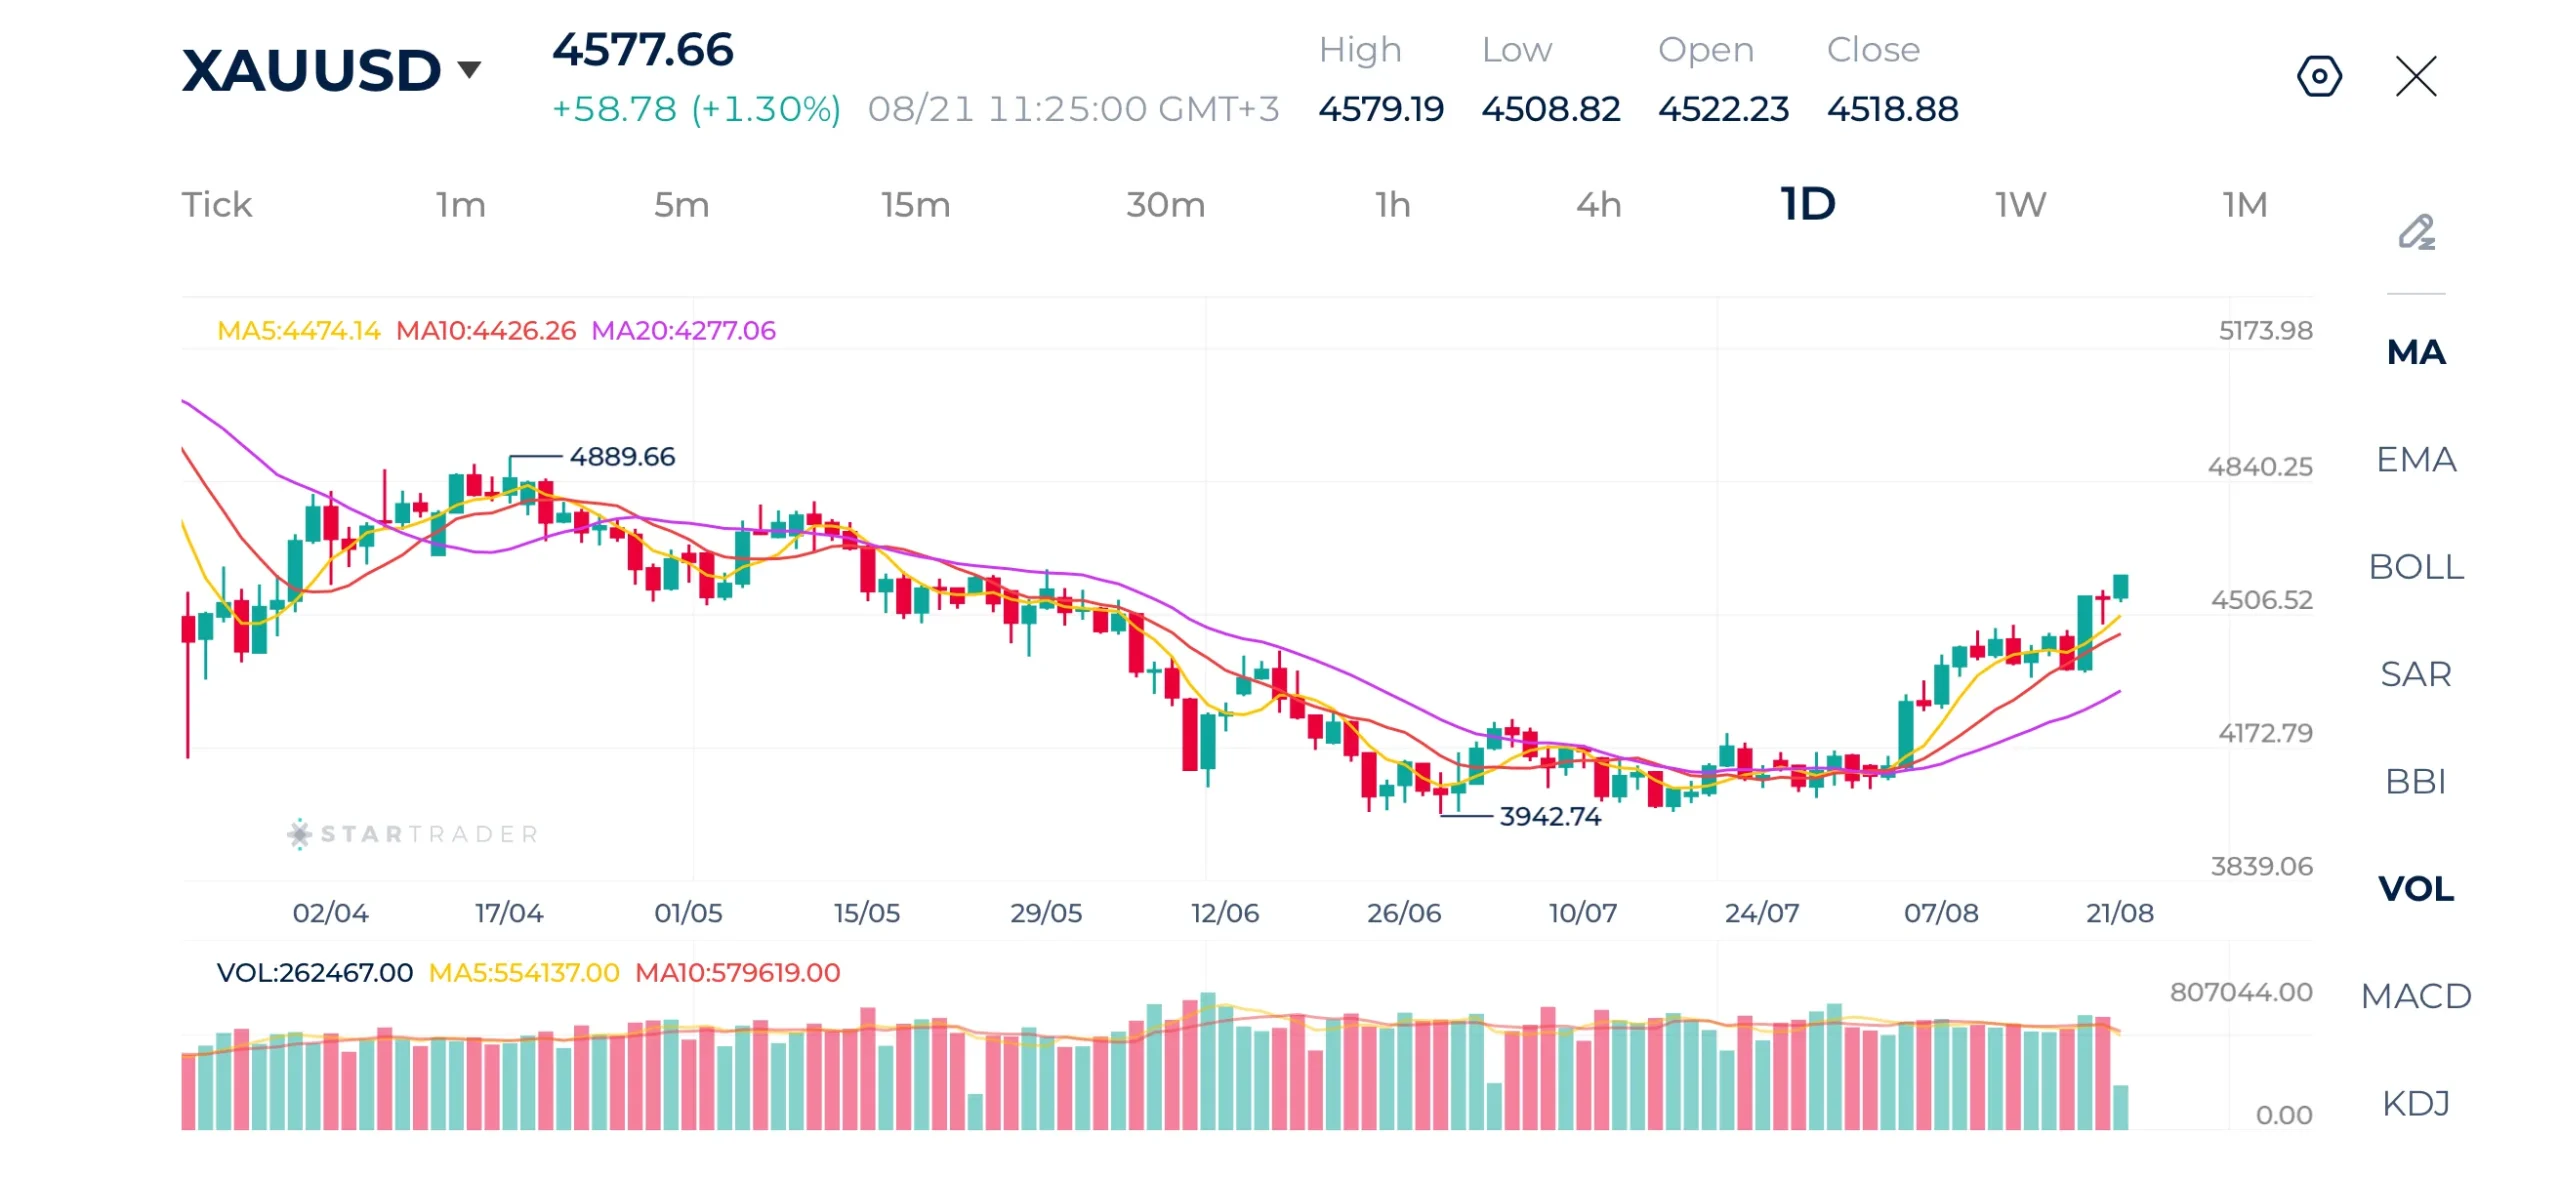
Source: STARTRADER app | Gold jumps above $4,500 on weaker dollar
| Resistance | $4,644 – $4,650 | $4,774 – $4,780 | $4,800 – $4,810 |
|---|---|---|---|
| Support | $4,545 – $4,550 | $4,376 – $4,385 | $4,300 – $4,312 |
Brent Technical Analysis
Brent crude has developed a strong bullish recovery, trading around $93.50. Price has now moved above the $95 area on the recent advance, although it has pulled back slightly from the latest intraday high. The moving averages remain bullishly aligned.
The immediate technical picture is therefore positive, with price remaining above all three moving averages. The key resistance is around $95.10, and a sustained break above this level would strengthen the bullish structure and potentially expose $100 as the next major psychological target. Beyond $100, the market would begin to target higher levels, although momentum would need to remain strong to sustain such a move.
The first important support is around $92.50, followed by $90.80 and then the stronger $88.30 area. A break below $88.30 would significantly weaken the current recovery and suggest that the recent rally may have entered a corrective phase.
Brent Daily Chart
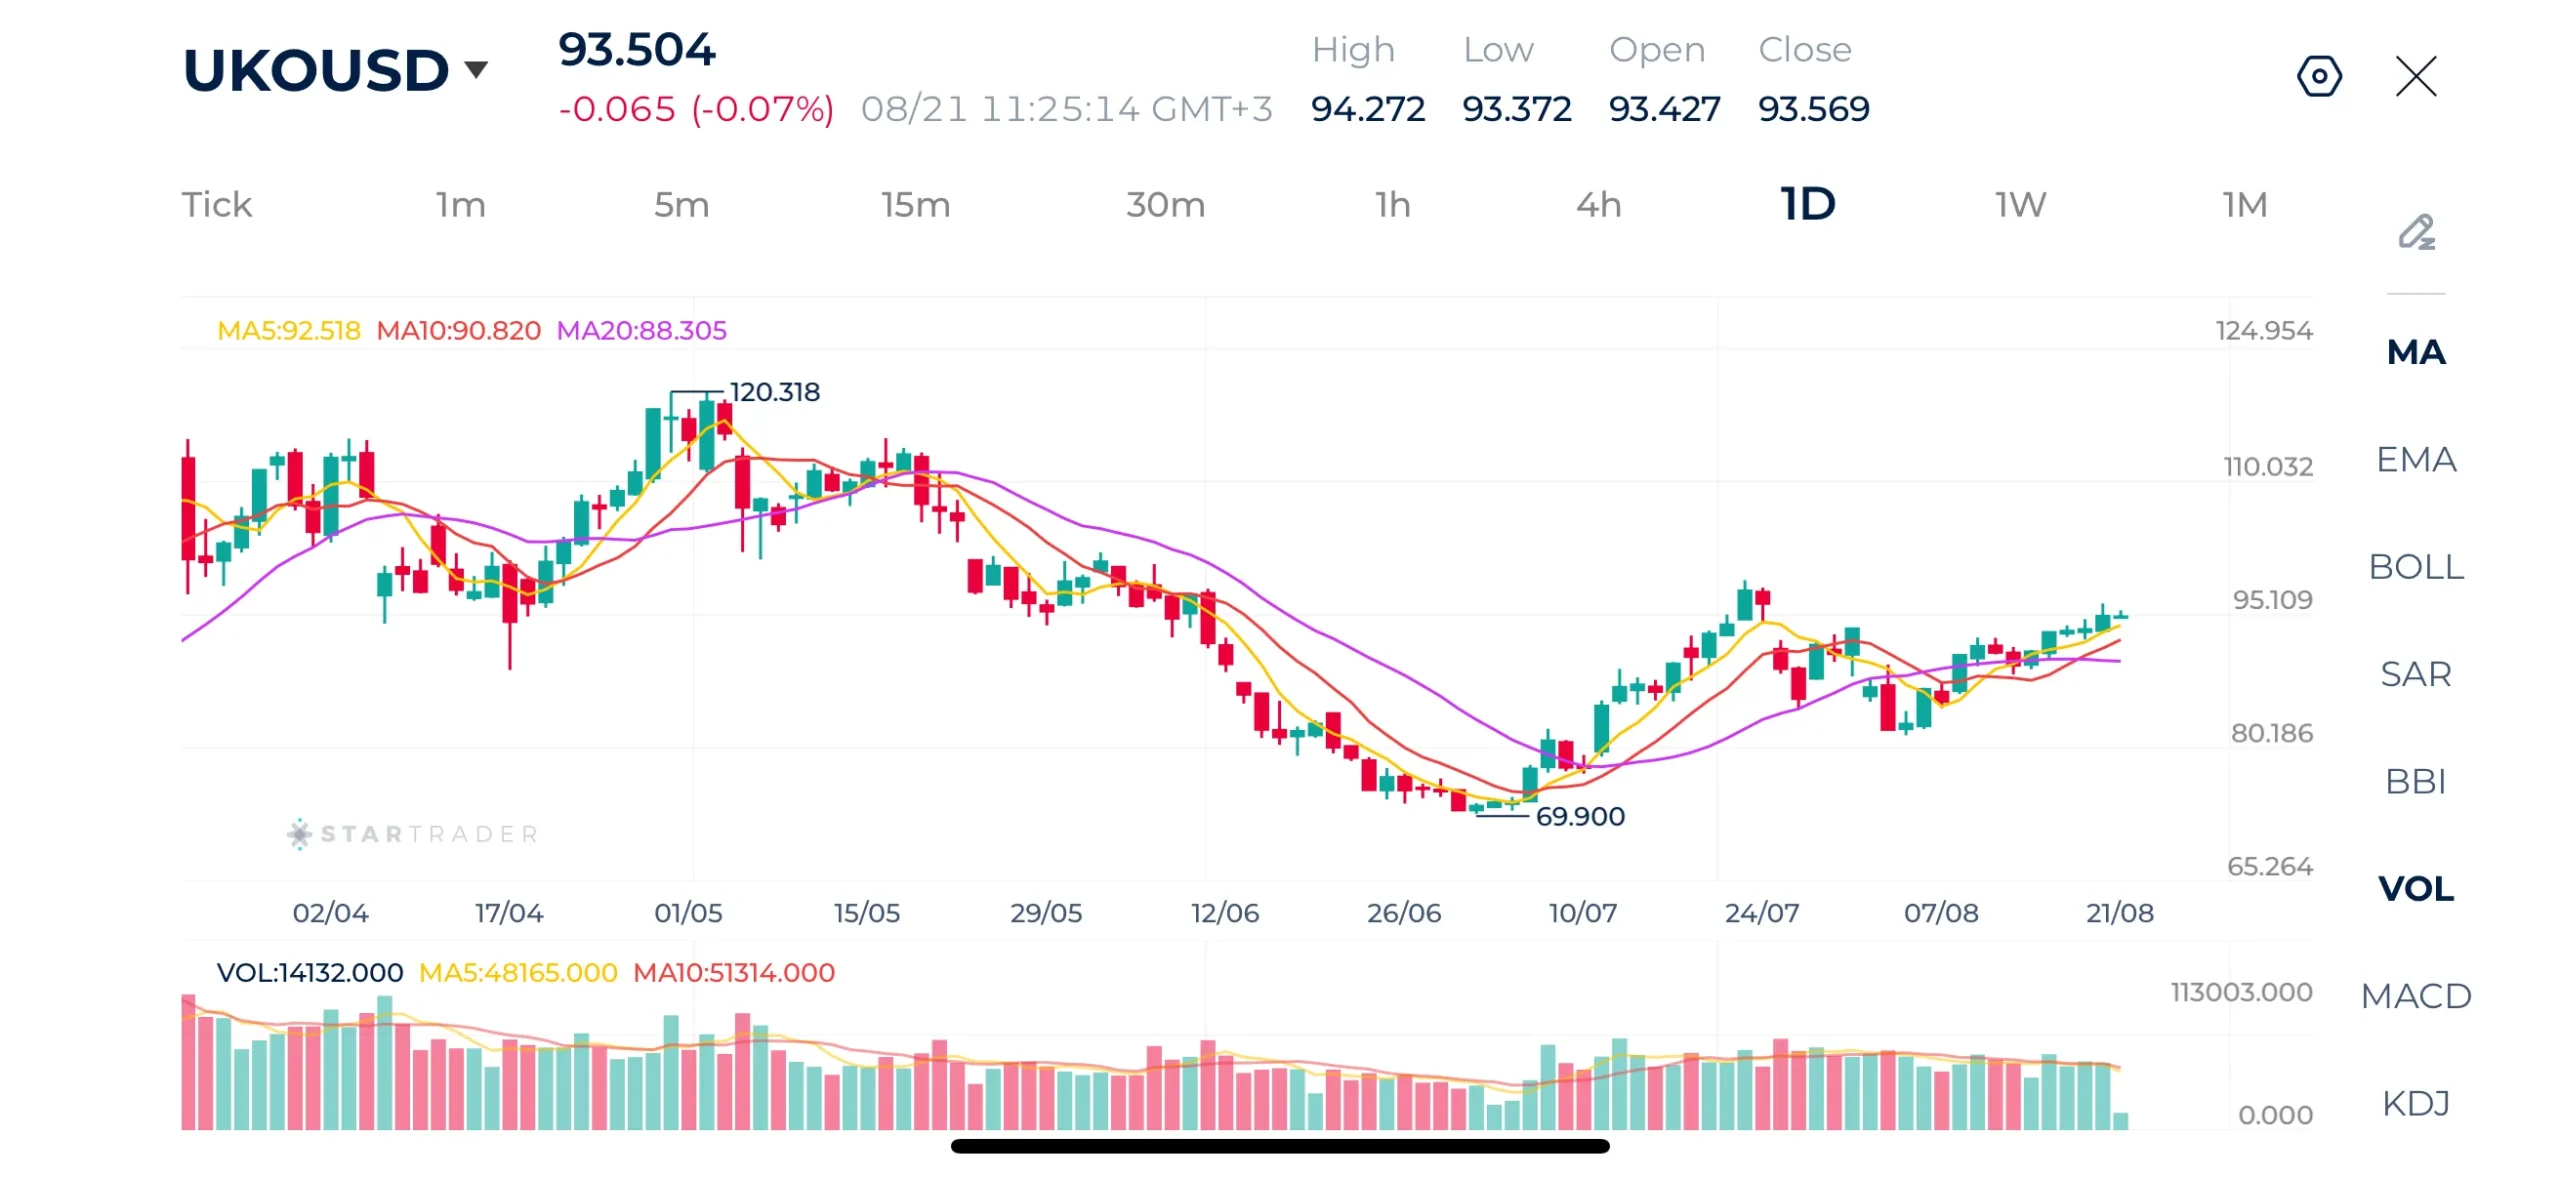
Source: STARTRADER app | Oil prices rise as US-Iran temporary peace deal expired
| Resistance | $97.70 – $97.75 | $100.42 – $100.55 | $102.34 – $102.50 |
|---|---|---|---|
| Support | $91.85 – $91.90 | $90.10 – $90.16 | $88.50 – $88.64 |
Bitcoin Technical Analysis
Bitcoin is showing a strong bullish breakout, trading around $77,178 after surging more than 20% on the week. Price has now moved decisively above the $69,730 area and all three moving averages. The bullish alignment of the averages confirms a significant improvement in medium-term momentum.
The immediate resistance is around $77,200–$77,300, close to the current high, while the next major psychological resistance is $80,000. Above $80,000, the previous major high around $81,657 becomes the key target. On the downside, $69,700 is now the first major support, followed by $66,400–$65,400.
However, the magnitude of the latest move means Bitcoin is becoming technically stretched in the short term. A pullback toward $69,700 would not necessarily invalidate the bullish structure and could instead represent a retest of the breakout zone. As long as he cryptocurrency remains above $69,700, the technical outlook remains strongly bullish, with a potential move toward $80,000 and then $81,650. A sustained move back below $69,700 would weaken the breakout and increase the probability of a deeper correction.
Bitcoin Daily Chart
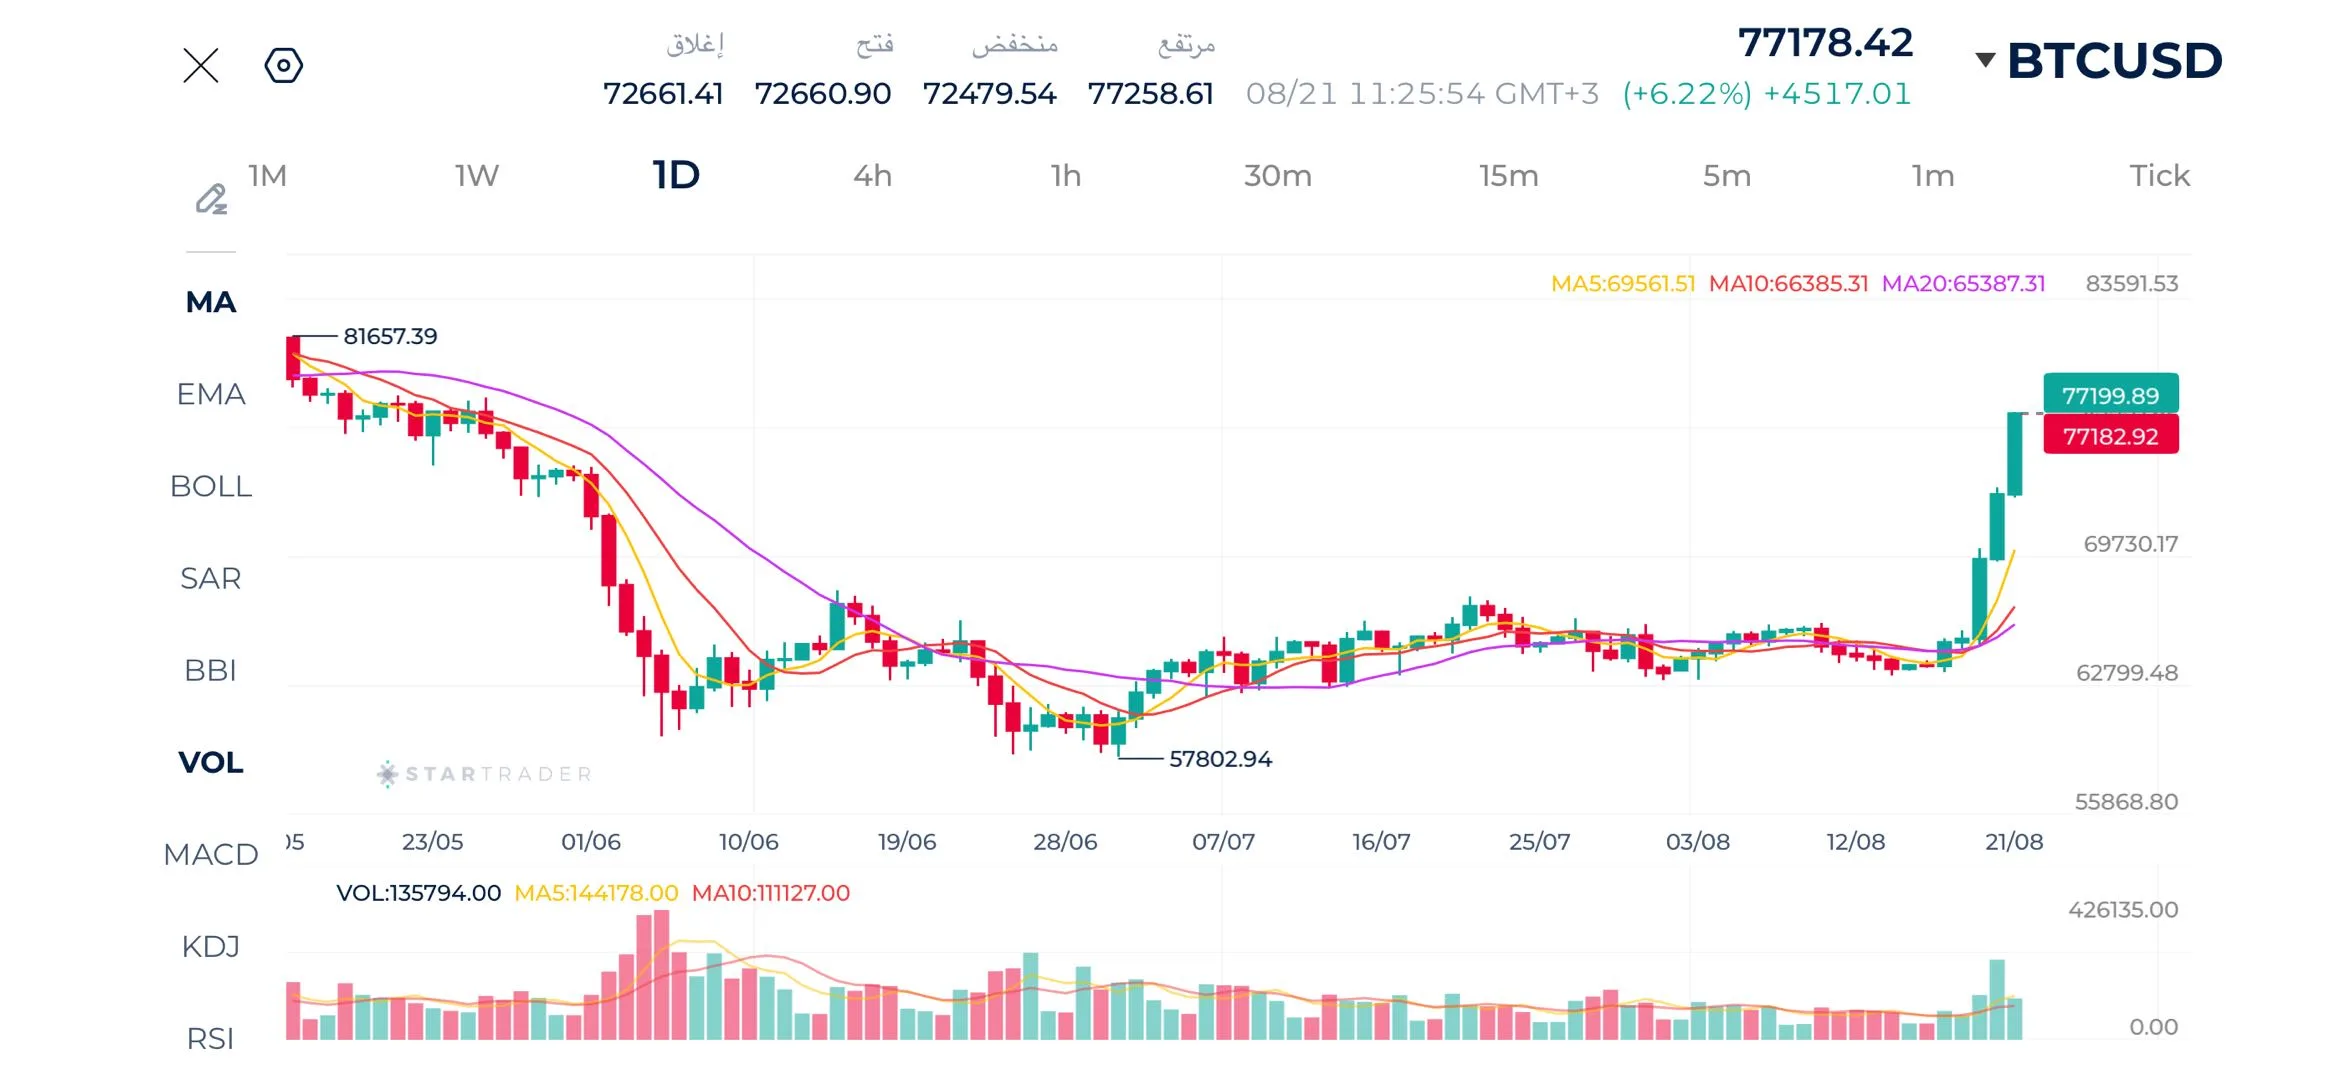
Source: STARTRADER app | Bitcoin surges past $75,000 as Trump urged Congress to payss the CLARITY Act
| Resistance | $80,559 – $80,600 | $86,730 – $86,800 | $88,085 – $88,150 |
|---|---|---|---|
| Support | $74,854 – $74,900 | $67,380 – $67,420 | $65,996 – $66,000 |
S&P 500 Technical Analysis
The S&P 500 remains in a strong medium-term uptrend, although the index is currently undergoing a modest pullback from its recent record high of 7,825. Price is trading around 7,672, while the moving averages remain positively positioned. The fact that price remains above the 20-day moving avearge is important because it suggests that the broader bullish structure has not yet been damaged despite the recent weakness.
The recent price action indicates some profit-taking after the index reached its record high. The MA5 and MA10 have started to turn lower, showing that short-term momentum has weakened, while the MA20 is still rising. The immediate resistance is the 7,825 record high, and a decisive break above this level would signal renewed bullish momentum and potentially open the way toward the 7,900–8,000 region.
On the downside, 7,650 is the first important support, corresponding closely with the MA20. A sustained break below this level would increase the likelihood of a deeper correction toward 7,518, which represents the next major technical support. Overall, the bias remains bullish above 7,650, but the index needs to regain 7,825 to resume a stronger upside trajectory.
S&P 500 Daily Chart
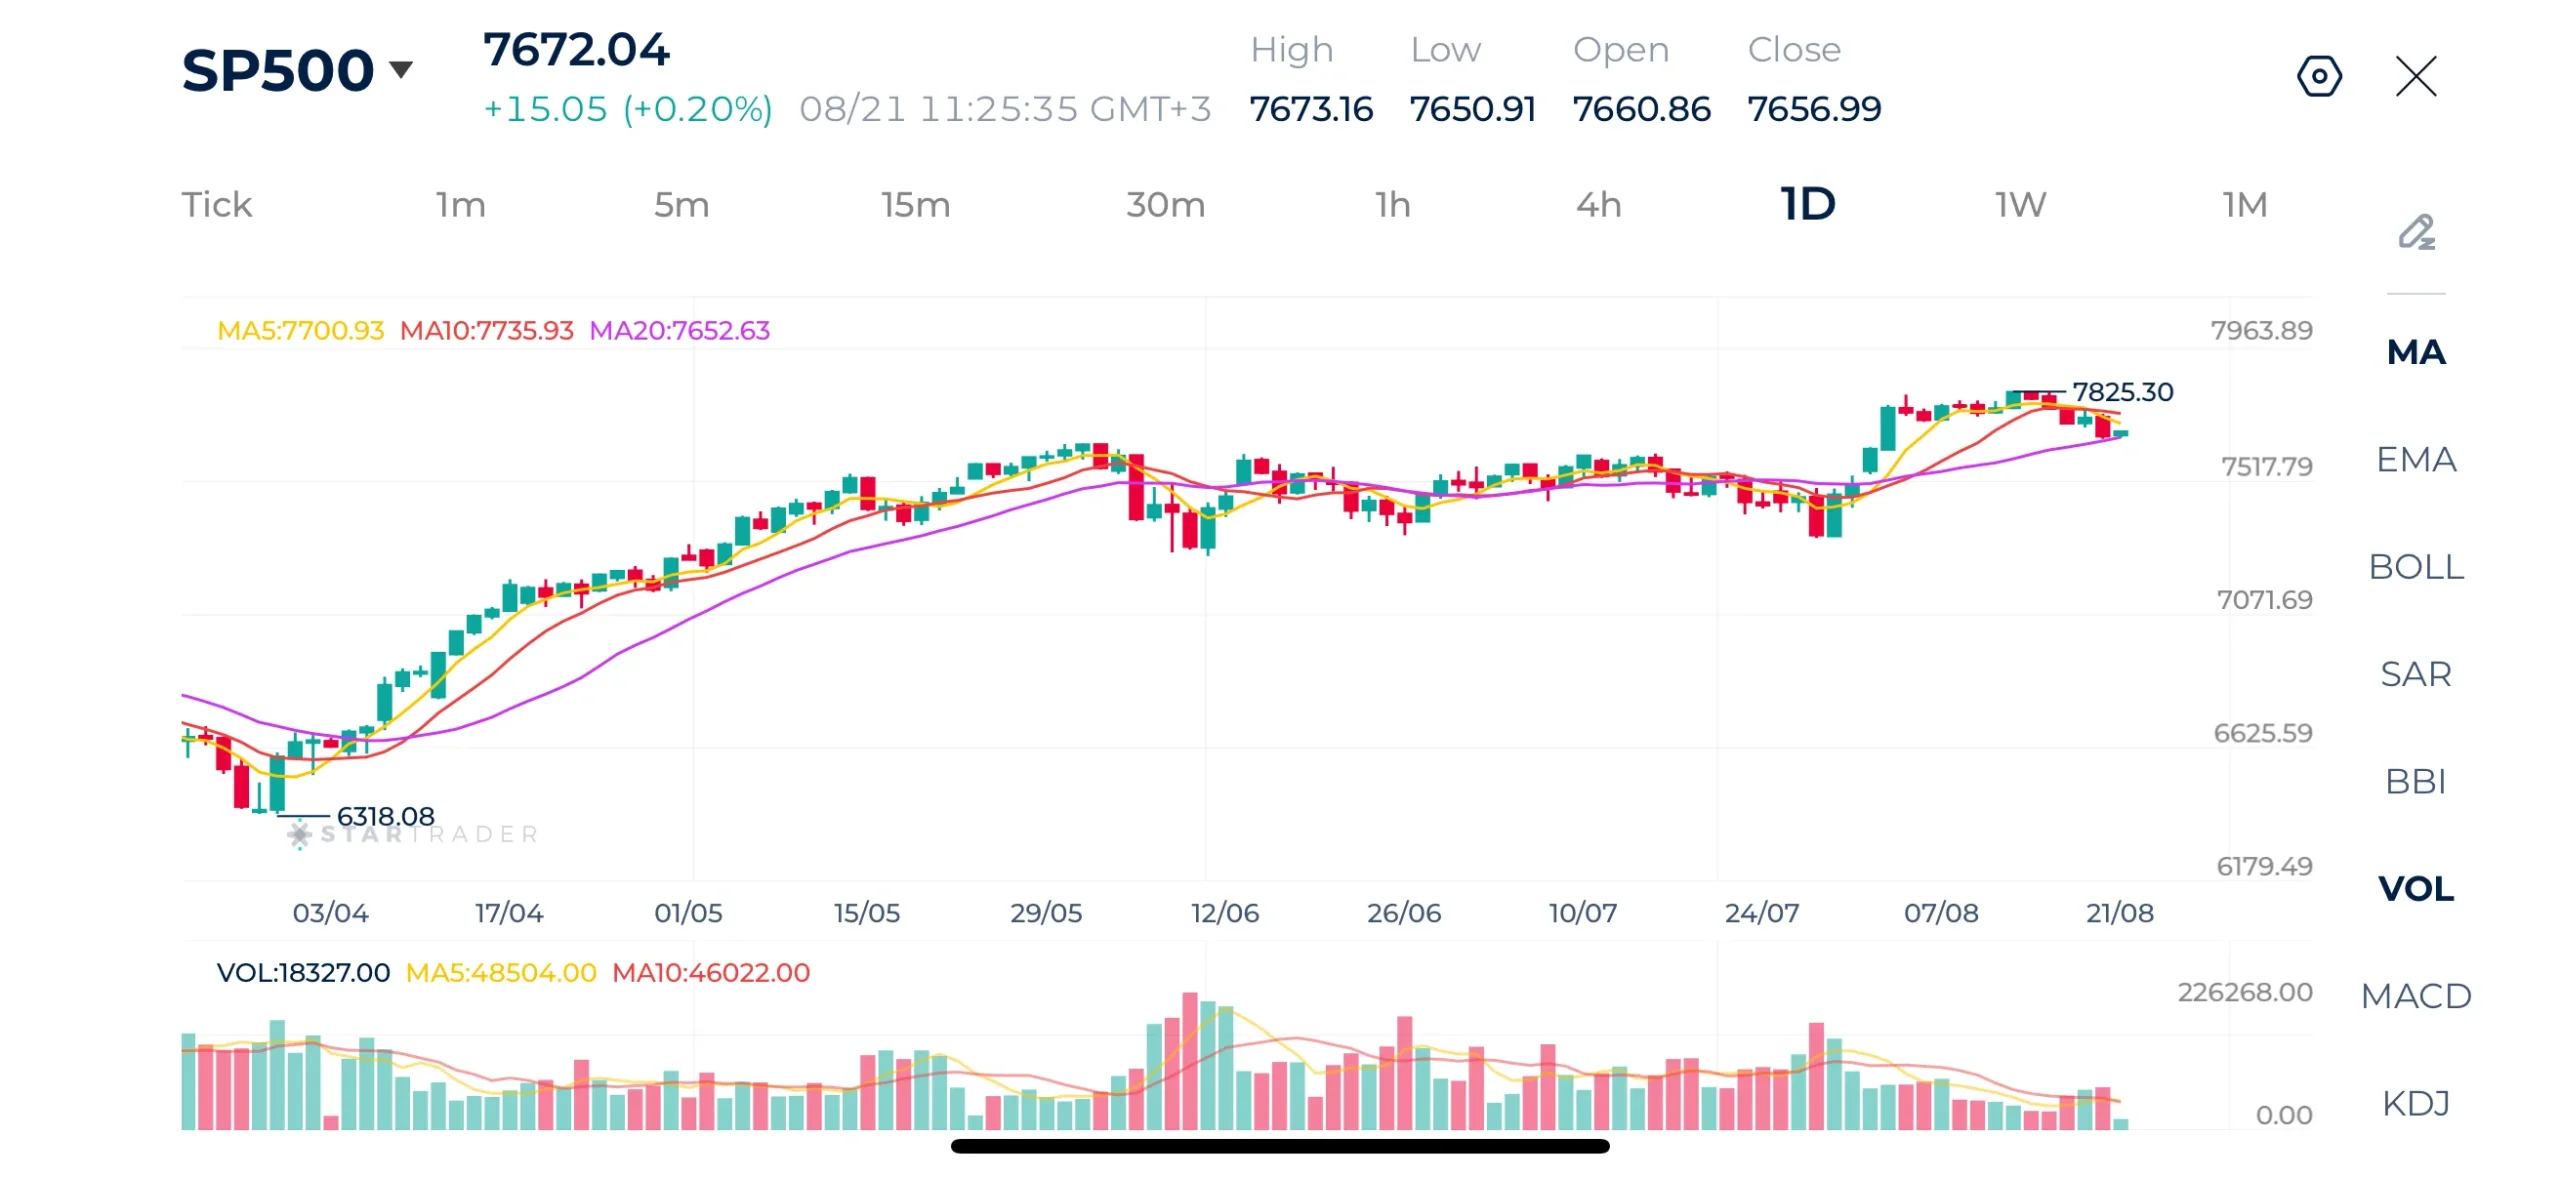
Source: STARTRADER app | US indices retreat from their record highs on rising yields
| Resistance | 7,710 – 7,720 | 7,794 – 7,800 | 7,815 – 7,825 |
|---|---|---|---|
| Support | 7,614 – 7,620 | 7,553 – 7,570 | 7,423 – 7,445 |
Risk Disclaimer: This material is provided for informational purposes only and does not constitute a recommendation or investment advice. Trading financial instruments on margin involves substantial risk and may not be appropriate for all investors.
Tags


Open Live Account
 Email Address
 Phone Number
Important Notice
STARTRADER does not accept any applications from Australian residents.
To comply with regulatory requirements, clicking the button will redirect you to the STARTRADER website operated by STARTRADER PRIME GLOBAL PTY LTD (ABN 65 156 005 668), an authorized Australian Financial Services Licence holder (AFSL no. 421210) regulated by the Australian Securities and Investments Commission.
Important Notice for Residents of the United Arab Emirates
In alignment with local regulatory requirements, individuals residing in the United Arab Emirates are requested to proceed via our dedicated regional platform at startrader.ae, which is operated by STARTRADER Global Financial Consultation & Financial Analysis L.L.C.. This entity is licensed by the UAE Capital Market Authority (CMA) under License No. 20200000241, and is authorised to introduce financial services and promote financial products in the UAE.
Please click the "Continue" button below to be redirected.


