


Key Takeaways
- Escalating protests in Iran and a firm U.S. Political response raised geopolitical risk premiums, pushing oil prices higher and supporting safe-haven assets.
- Investigations surrounding Fed Chair Jerome Powell increased short-term market volatility, particularly in bonds and forex, despite no immediate policy implications.
- Gold and silver extended their historic rallies, with both metals attracting strong inflows amid geopolitical tensions and expectations of further monetary easing.
- U.S. earnings season kicked off, with early reports from major banks delivering mixed results and reinforcing cautious equity sentiment.
- Tariff-related developments resurfaced, as renewed discussions around trade restrictions added uncertainty to global growth expectations.
- Federal Reserve policy expectations remained dovish, with markets continuing to price additional rate cuts later in 2026.
- Risk sentiment weakened toward the end of the week, benefiting commodities and pressuring cryptocurrencies.
Precious Metals Continue to Shatter Record Highs
Gold posted another strong weekly gain, rising approximately 2.3%, closing near $4,620 an ounce. The rally was driven by heightened geopolitical risks, and a softer U.S. dollar,. Safe-haven demand remained strong as investors sought protection from political and monetary uncertainty.
Silver outperformed gold, gaining 12% on the week, reaching a high of $93.69. In addition to safe-haven flows, silver continued to benefit from robust industrial demand expectations, particularly from the renewable energy and electronics sectors.
Oil prices surged, with Brent crude up about 4.5% during the week to reach a high near $66.38 per barrel, before settling at arround $63.30. Concerns over supply disruptions linked to Middle East tensions, combined with firm demand expectations, drove prices higher and added to inflationary pressures.
US dollar strength pressures foreign currencies
The U.S. Dollar Index (DXY) rose approximately 0.15%, closing near 99.31, as dovish Fed expectations and political uncertainty weighed on the greenback.
EUR/USD fell around 0.22%, trading near 1.1609, due to a stronger dollar. GBP/USD dropped below 1.3400 level. USD/JPY rose to 159.43 before dropping lower to 158.12
Overall, FX markets reflected broad-based dollar strength.
US Stocks
U.S. equity markets ended the week lower mixed, pressured by rising geopolitical risks, mixed earnings, and political uncertainty. S&P 500 remained flat around 6,964. Dow Jones rose only 0.08%, supported partially by defensive sectors.
Nasdaq-100 underperformed, dropping roughly 0.37%, weighed down by profit-taking in technology and AI-related stocks. Investors rotated away from high-valuation growth names toward defensive sectors such as healthcare and utilities, reflecting a more cautious market stance.
Key Economic Data of the week
- US CPI inflation showed no change in December compared with November data as it held at 2.7% on a yearly basis.
- Delayed data showed new home sales in October were higher than expected at 737K new homes, versus expectations of 716K.
- The US monthly producer price index in October cooled to 0.1%, and November data showed a slight increase to 0.2%
- US retail sales jumped 0.6% in November, slightly higher than market expectations of 0.5%
- Monthly gross domestic product in the UK showed a growth of 0.3% for the month of November 2025
- US Weekly unemployment claims fell to 198K from 207K in the previous week.
Major Economic Calendar Events for the Upcoming Week
| Date | Metric | Country | Previous |
| Monday, 19 January | Consumer Price Index y/y | Canada | 2.80% |
| Tuesday, 20 January | Claimant Count Change | UK | 20.1K |
| Wednesday, 21 January | Consumer Price Index y/y | UK | 3.20% |
| Wednesday, 21 January | Pending Home Sales m/m | USA | 3.30% |
| Thursday, 22 January | Unemployment Rate | Australia | 4.30% |
| Thursday, 22 January | Personal Consumption Expenditure | USA | |
| Thursday, 22 January | Final Gross Domestic Product | USA | 4.30% |
| Friday, 23 January | Consumer Price Index q/q | New Zealand | 1% |
| Friday, 23 January | Interest Rate Decision | Japan | 0.75% |
| Friday, 23 January | Retail Sales m/m | UK | -0.10% |
| Friday, 23 January | Flash Manufacturing PMI | USA | 51.8 |
| Friday, 23 January | Flash Services PMI | USA | 52.5 |
Technical Analysis and Forecast:
Gold Technical Analysis
Gold remains firmly in a strong structural uptrend, with prices well above all key moving averages. The recent pullback from the $4,640 high appears corrective, with price still respecting the rising 10 and 30 moving averages, an indication that buyers remain in control.
MACD is positive and stabilizing after a momentum reset, suggesting consolidation rather than trend exhaustion. As long as gold holds above the $4,480–$4,520 support zone, the broader bullish trend remains intact, with upside potential toward new highs above 4,650. A break below the 30-day moving average would signal a deeper corrective phase, but current structure favors trend continuation over reversal.
Gold Daily Chart
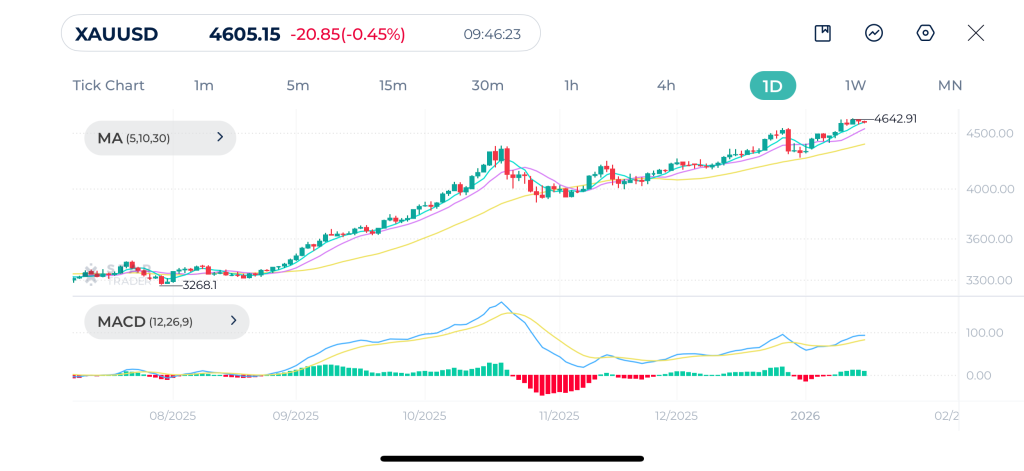
| Resistance | $4,645 – $4,650 | $4,700 – $4,705 | $4,730 – $,4734 |
| Support | $4,535 – $4,540 | $4,507 – $4,510 | $4,365 – $4,370 |
EURUSD Technical Analysis
EURUSD remains in a medium-term consolidation phase after failing to hold above the 1.1800–1.1900 resistance zone. Price is currently trading below the short-term moving averages MA(5) and MA(10) and testing the 30-day moving average, which is acting as dynamic support near the 1.1550–1.1580 area. This reflects weakening bullish momentum.
MACD has crossed below the signal line and moved into negative territory, confirming a short-term bearish momentum shift. As long as price holds above 1.1500, this looks more like a corrective pullback within a broader range. A daily close below 1.1500 would open the downside risk toward 1.1380–1.1400, but recovery above 1.1700 would revive bullish continuation toward 1.1850.
EURUSD Daily Chart
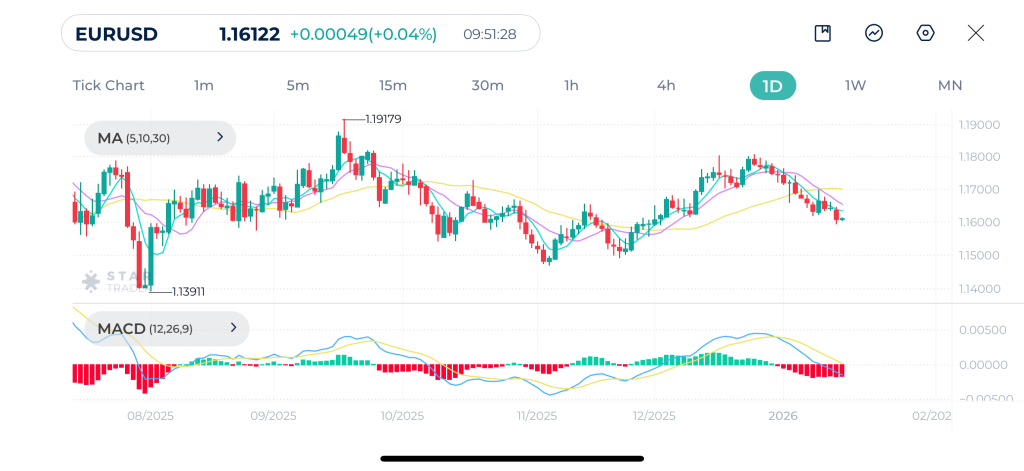
| Resistance | 1.1697 – 1.1700 | 1.1742 – 1.1748 | 1.1780 -1 1.1785 |
| Support | 1.1591 – 1.1600 | 1.1550 – 1.1556 | 1.1500 – 1.1505 |
Bitcoin Technical Analysis
Since the end of November, Bitcoin has been in a slow recovery phase. It is currently testing the $95,000–$100,000 psychological resistance zone. The most recent candles show a healthy “breath” after a recent move up from the $84,500 level.
Price is currently trading above all three moving averages. This is a bullish signal in the short term.
MACD line has crossed above the signal line below the zero axis and is now trending upward.
MACD line is approaching the zero center-line. A break above this line would confirm a transition from a relief rally into a sustained bullish trend.
As long as bitcoin maintains the $95,000 level, price action remains constructive with potential resistance at $100,000 level.
Bitcoin Daily Chart
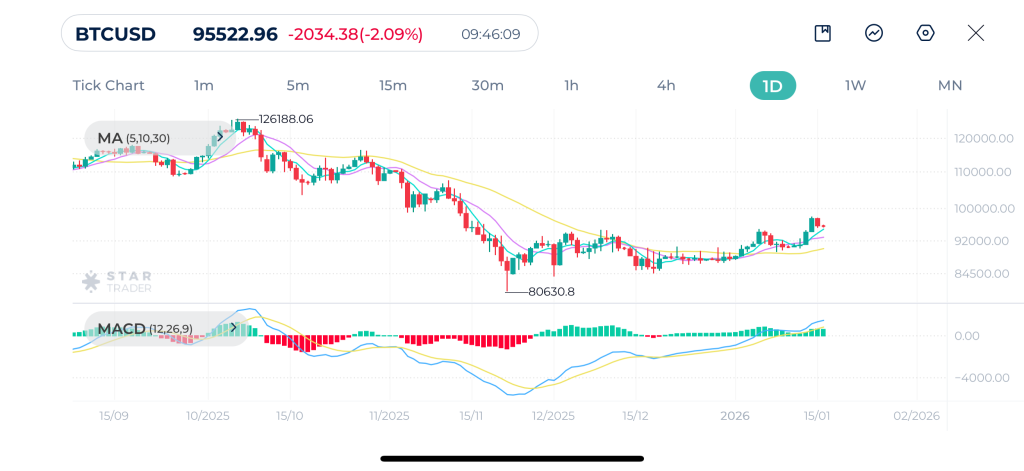
| Resistance | $98,990 – $99,120 | $100,000 – $100,150 | $101,236 – $101,300 |
| Support | $93,697 – $93,745 | $91,514 – $91,600 | $89,264 – $89,320 |
Nasdaq Technical Analysis
Nasdaq-100 remains in a strong long-term uptrend, with price consistently holding above the 30-day moving average, which continues to slope upward. Recent price action shows consolidation just below the 26,300 resistance area, suggesting healthy digestion of prior gains.
MACD has rebounded from negative territory and is curling higher, indicating renewed bullish momentum. As long as price holds above the 25,300–25,500 support zone, price action remains constructive. A confirmed breakout above 26,300 would expose upside toward 26,800–27,000, while a daily close below the 30-day moving average would be the first warning of deeper correction risk.
Nasdaq Daily Chart
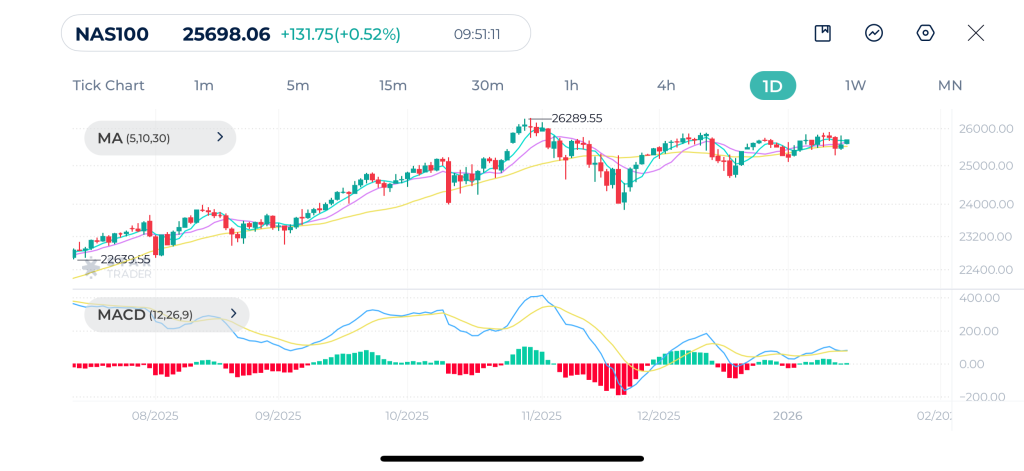
| Resistance | 25,877 – 25,900 | 26,289 – 26,302 | 27,000 – 27,023 |
| Support | 25,270 – 25,281 | 24,657 – 24,683 | 23,991 – 24,000 |
Tags
Open Live Account
Please enter a valid country
No results found
No results found
Please enter a valid email
Please enter a valid verification code
1. 8-16 characters + numbers (0-9) 2. blend of letters (A-Z, a-z) 3. special characters (e.g, !a#S%^&)
Please enter the correct format
Please tick the checkbox to proceed
Please tick the checkbox to proceed
Important Notice
STARTRADER does not accept any applications from Australian residents.
To comply with regulatory requirements, clicking the button will redirect you to the STARTRADER website operated by STARTRADER PRIME GLOBAL PTY LTD (ABN 65 156 005 668), an authorized Australian Financial Services Licence holder (AFSL no. 421210) regulated by the Australian Securities and Investments Commission.
CONTINUEImportant Notice for Residents of the United Arab Emirates
In alignment with local regulatory requirements, individuals residing in the United Arab Emirates are requested to proceed via our dedicated regional platform at startrader.ae, which is operated by STARTRADER Global Financial Consultation & Financial Analysis L.L.C.. This entity is licensed by the UAE Capital Market Authority (CMA) under License No. 20200000241, and is authorised to introduce financial services and promote financial products in the UAE.
Please click the "Continue" button below to be redirected.
CONTINUEError! Please try again.

