


 Web Trader MT5













Weekly Market Highlights: 9–13 November 2026
- US stocks rebound: The Dow, S&P 500 and Nasdaq recovered strongly after last week’s sell-off, but volatility remained elevated.
- Nvidia crisis escalates: Nvidia came under heavy pressure as Jensen Huang left the company, raising concerns about leadership and the future direction of the AI giant.
- CoreWeave boosts AI optimism: Strong earnings and a significant increase in revenue guidance highlighted continued strength in AI infrastructure demand despite concerns over valuations.
- Hotter US inflation turns the Fed more hawkish: October CPI came in above expectations, while Christopher Waller raised the possibility of a 50bp hike if inflation remains persistent.
- Dollar and yields surge: The DXY reached its highest level of 2026, while the 10-year Treasury yield approached 5%, increasing pressure on technology stocks and gold.
- Gold hits a 2026 low: Gold fell below $3,900 as higher rate expectations, rising yields and a stronger dollar reduced demand for the non-yielding metal.
- Oil remains hostage to US-Iran tensions: Crude prices remained volatile as markets reacted to Trump’s statements and shifting expectations over a potential US-Iran deal, with the Strait of Hormuz remaining the key geopolitical risk.
US Equities Fluctuate, Nvidia’s CEO Jensen Huang Resigns
The S&P 500, Dow Jones and Nasdaq rebounded sharply early in the week, with the Nasdaq gaining more than 2% on Monday. The recovery was supported by strong earnings, particularly from CoreWeave, which reported revenue of around $3.66 billion, up 168% year-on-year, and raised its 2026 revenue guidance. Its shares surged almost 25%, reinforcing the argument that underlying demand for AI infrastructure remains exceptionally strong.
However, Nvidia became the week’s biggest source of uncertainty. Shares came under heavy pressure following reports surrounding CEO Jensen Huang, before the crisis escalated when Hunag resigned. The developments raised concerns about leadership continuity and the future direction of the world’s most important AI-chip company. At the same time, AMD and Broadcom benefited as investors considered whether competitors could gain market share.
The broader issue remains the same, AI demand is still extremely strong, but investors are increasingly questioning valuations, enormous capital expenditure and the returns on AI infrastructure investment.
US CPI Inflation Came Higher Than Expected
October CPI was hotter than expected, rising 0.4% month-on-month versus 0.3% expected, while core CPI increased 0.3% versus 0.2% expected. The data reinforced concerns that inflation remains sticky.
Fed Governor Christopher Waller added to the hawkish tone, saying a 50bp rate hike could be considered if core inflation remains around 0.3%. Markets consequently increased expectations for another rate hike in December.
Treasury yields moved higher following his remarks, with the 10-year yield approaching 5%, while the DXY climbed to its highest level of 2026, around 103. Higher yields and a stronger dollar are particularly negative for high-valuation technology stocks and non-yielding assets such as gold.
Gold Hits 2026 Low on Rising Yields
Gold suffered a major reversal this week. After briefly recovering above $4,100, prices fell below $3,900, reaching their lowest level of 2026.
The main drivers were the combination of hotter CPI, higher Fed rate expectations, rising Treasury yields and a stronger US dollar. Higher interest rates increase the opportunity cost of holding gold, while a stronger dollar makes the metal more expensive for international buyers.
Going into the next Fed meeting, gold will remain highly sensitive to inflation and interest-rate expectations. A hawkish Fed and persistent inflation could push gold lower, while softer inflation and falling yields could trigger a rebound.
Oil Remains Volatile Due to US-Iran Tensions
Oil remained highly volatile as markets reacted to changing expectations around the US-Iran conflict. Brent and WTI initially fell as hopes for negotiations increased, but prices recovered after President Trump said the US does not necessarily need a deal with Iran.
The key risk remains the Strait of Hormuz. Any significant military escalation or disruption to oil flows could send crude sharply higher and create another inflationary shock. Conversely, renewed diplomatic progress could push prices lower.
Outlook for 16–20 November
Next week, the focus will shift toward Nvidia’s earnings and the company’s future following the Jensen Huang resignation. Strong results and guidance could stabilise the AI sector, while disappointment could trigger another technology sell-off.
For markets overall, the key variables remain Fed expectations, Treasury yields, the US dollar and the US-Iran situation. Gold remains bearish below $4,000, although the sharp decline increases the possibility of a technical rebound. Oil will remain highly headline-driven, while the dollar and yields should remain supported as long as markets continue pricing a December Fed hike.
Technical Analysis and Forecast:
Nasdaq Technical Analysis
Nasdaq-100 remains in a broader corrective phase on the daily chart. The index is currently around 28,250, holding above the short-term moving averages MA5 and MA10, while still trading below the MA20 at around 28,628. The recent rebound is now facing resistance of around 28,850–29,000, where the MA20 and previous price congestion converge.
A sustained move back above 28,600–28,850 would strengthen the bullish recovery and potentially open the way toward 29,000–29,300. Conversely, a break below 28,000 would weaken the recovery and expose 27,650–27,300. For now, the short-term bias is neutral to mildly bullish, but the index needs to reclaim the 28,850–29,000 area to confirm stronger upside momentum.
Nasdaq-100 Daily Chart
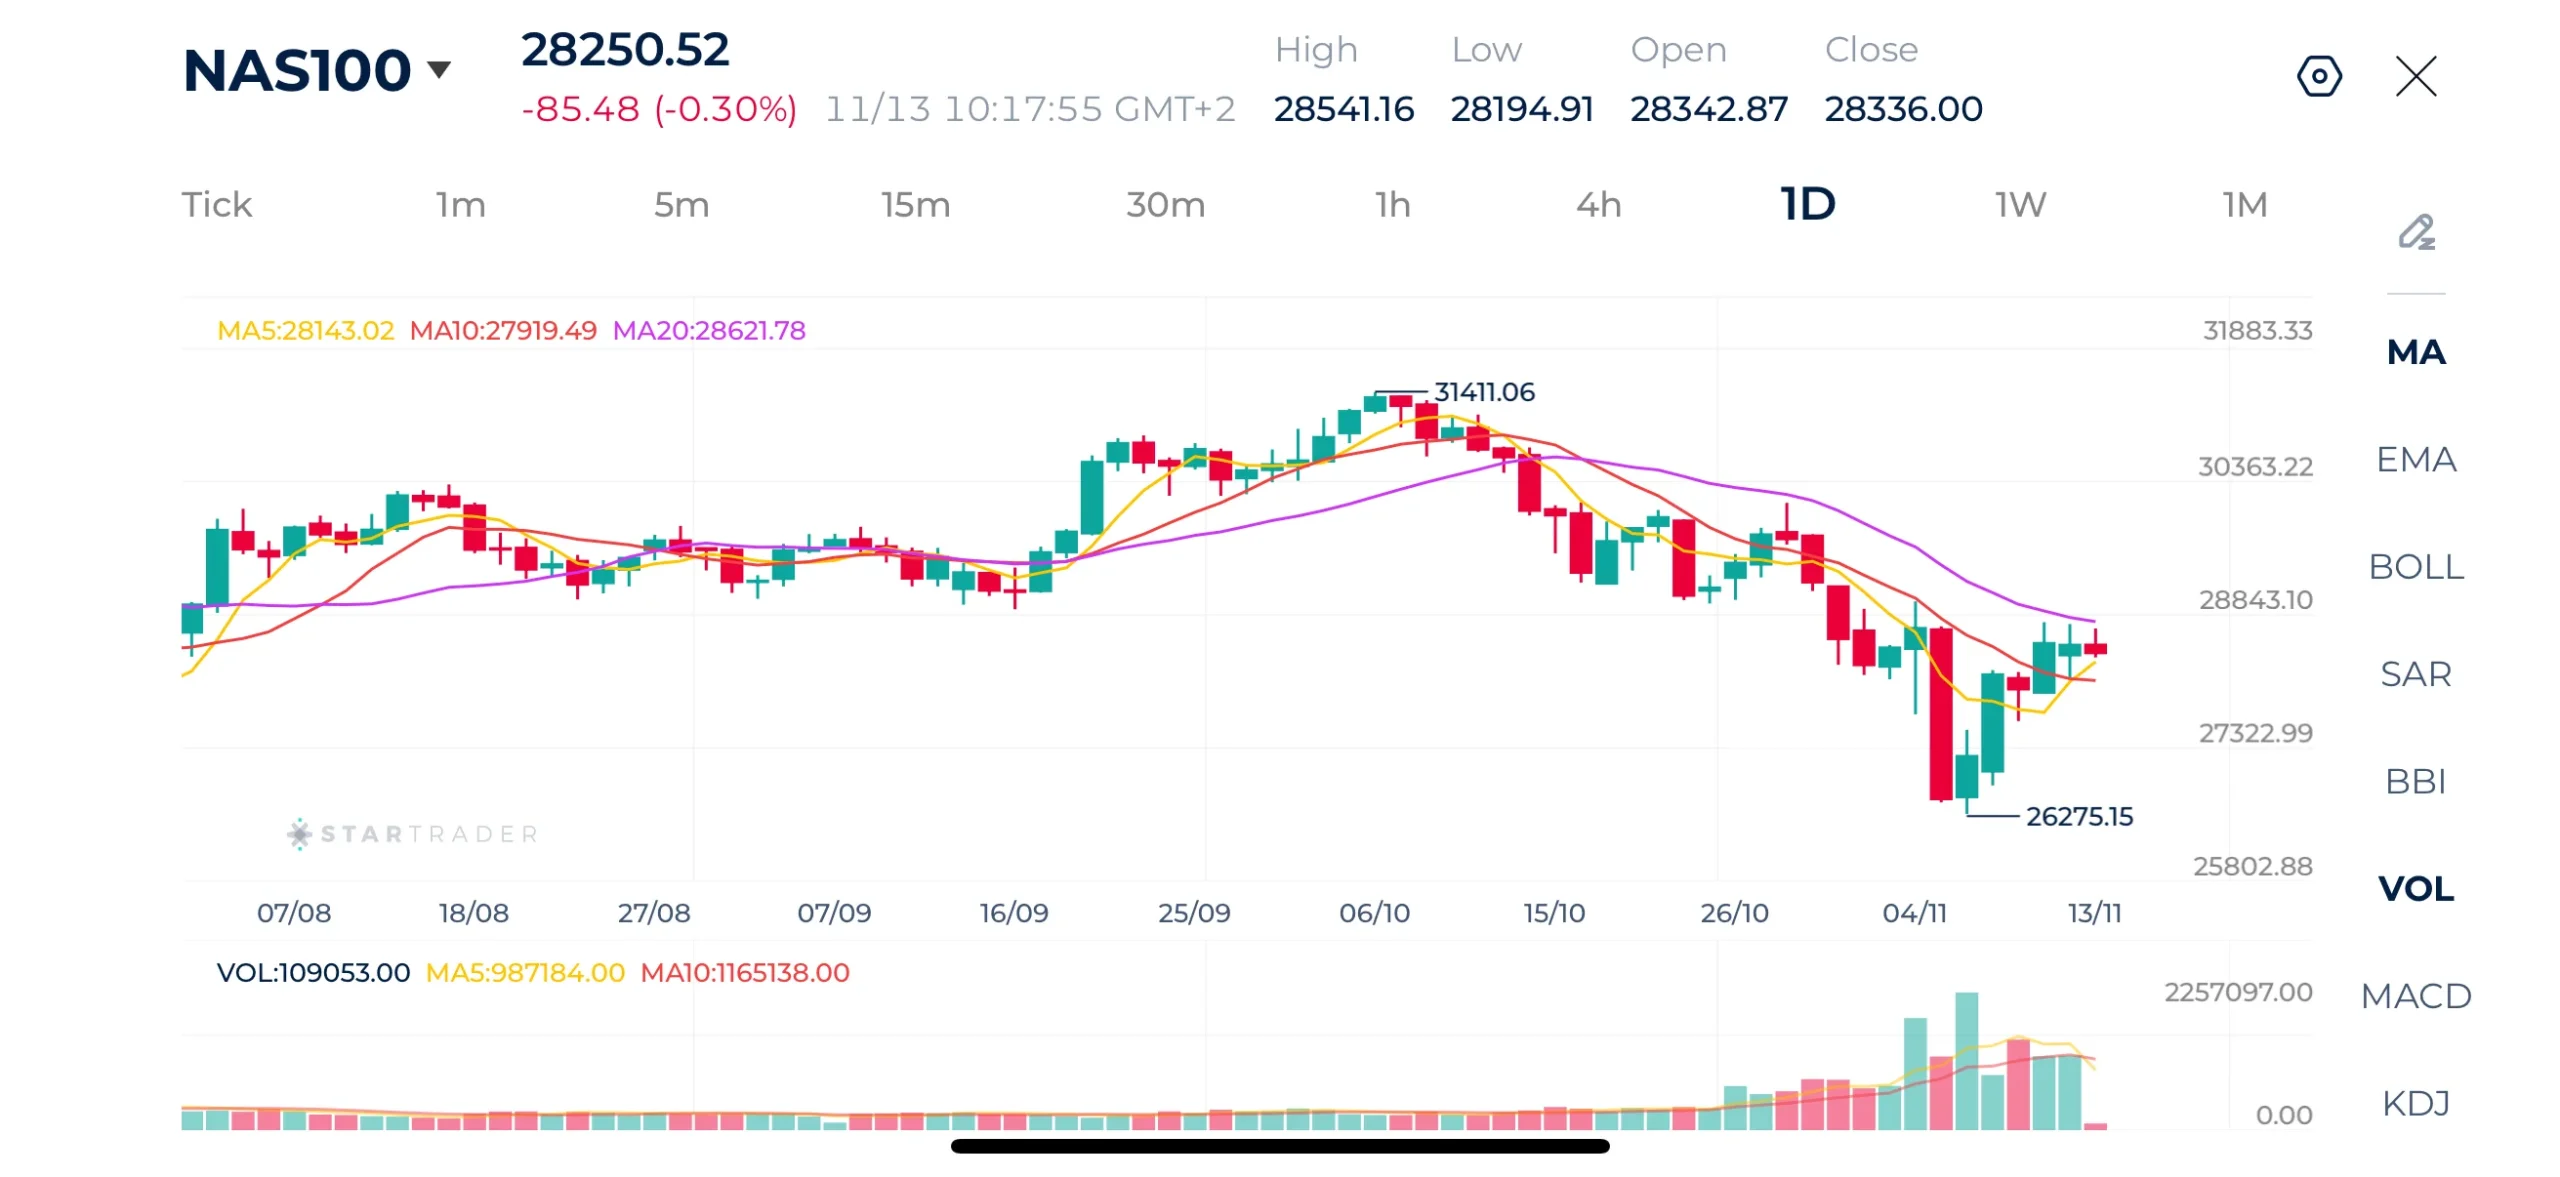
Source: STARTRADER app | Nasdaq attempts ro rebound from the recent correction despire Nvidia’s sharp decline
| Resistance | 29,000 – 29,035 | 30,000 – 30,363 | 31,400 – 31,421 |
|---|---|---|---|
| Support | 27,320 – 27,335 | 26,275 – 26,300 | 25,800 – 25,840 |
Brent Technical Analysis
Brent crude remains structurally bearish on the daily timeframe despite the recent rebound. After reaching around $118.80, the market experienced a very sharp decline and is now trading near $98.17. The 5-day and 10-day moving averages have turned lower, while the MA20 remains significantly above price at around $107.13, confirming that the broader trend is still bearish. The recent bounce from the lower levels has stalled below the $100–$102 region, and the latest price action suggests difficulty sustaining upward momentum.
The hourly chart reinforces this view. After recovering toward $96.8, Brent has reversed lower and is now trading around $93.85, below all three moving averages. Immediate support is around $93.40–$93.50, followed by the recent $91.75 low. A break below $93.40 would increase the probability of another test of $91.75. On the upside, $94.50–$95.00 is the first resistance zone, followed by $96.80. The short-term bias is, therefore, bearish, unless price can reclaim $95–$96.80 with conviction.
Brent Daily Chart
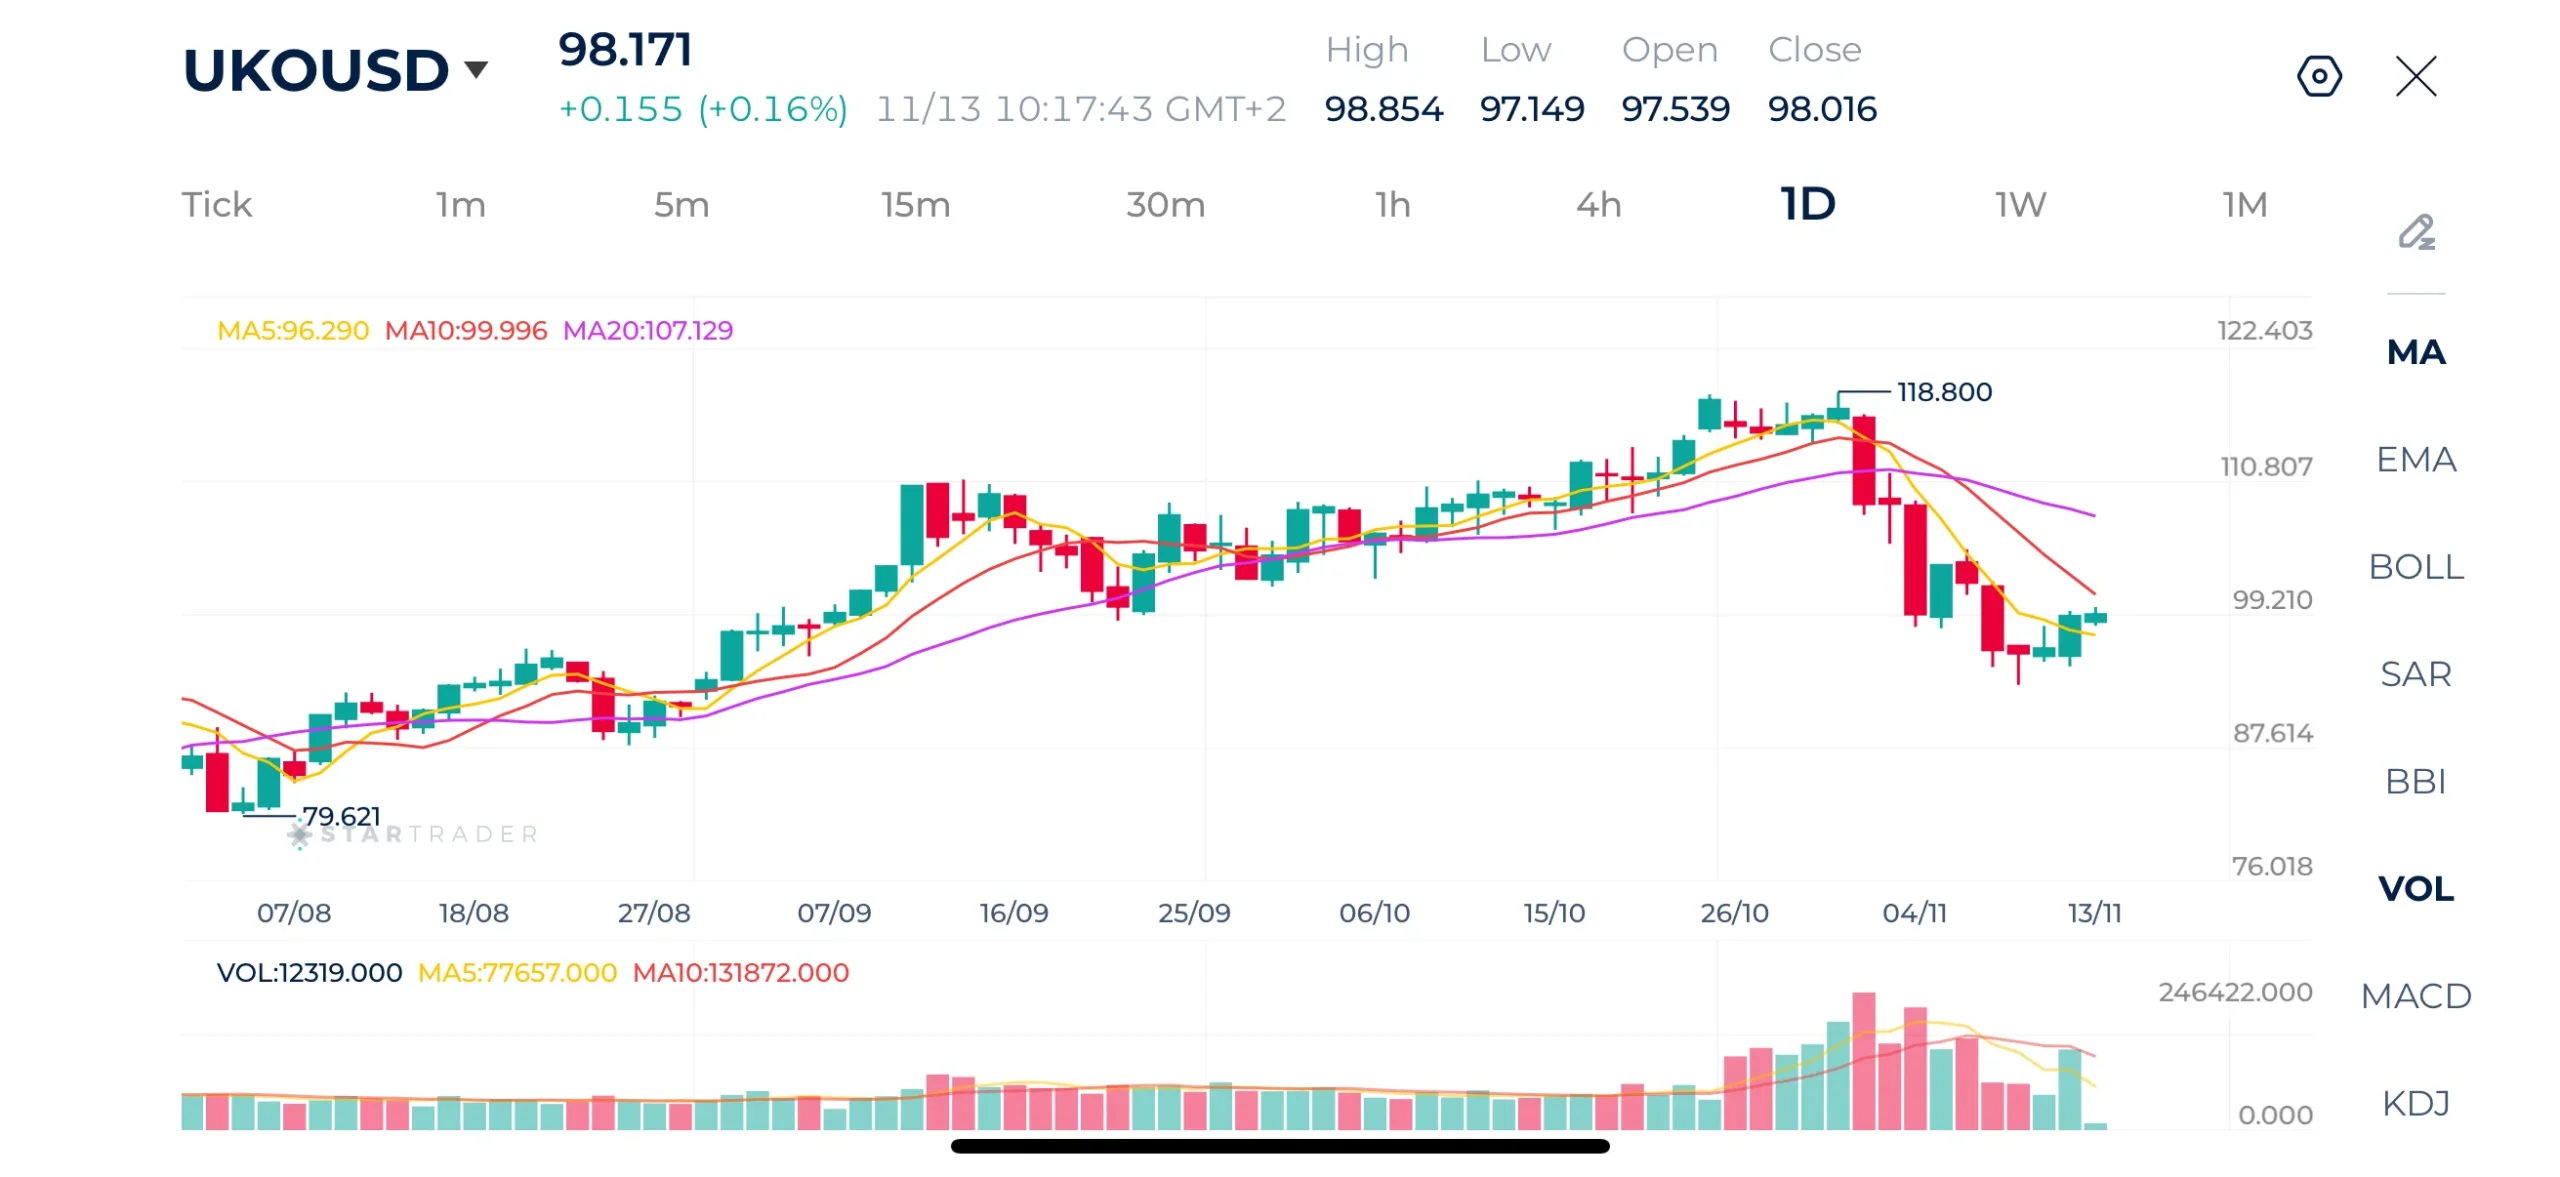
Source: STARTRADER app | Oil prices bounce slightly, but the rise remains limited
| Resistance | $99.87 – $100.00 | $104.82 – $105.00 | $108.52 – $108.70 |
|---|---|---|---|
| Support | $91.75 – $91.90 | $88.65 – $88.70 | $85.92 – $86.00 |
EURUSD Technical Analysis
EURUSD remains clearly bearish on the daily chart. The pair has fallen from around 1.1710 to approximately 1.1064, with the 5-day, 10-day, and 20-day moving averages all positioned above the current price. The recent breakdown below the 1.1180 area is particularly important because that zone had acted as a consolidation area during October and early November. The recent increase in volume during the sell-off also suggests that the downside move had meaningful participation.
The pair is now approaching the 1.1045–1.1000 area, which represents the key near-term support zone. A sustained break below 1.1000 would strengthen the bearish structure and potentially target 1.0950 and below. On the upside, 1.1100–1.1180 is the first major resistance area. A recovery above 1.1180 would be the first sign that downside momentum is losing strength. Until then, the technical bias remains bearish.
EURUSD Daily Chart
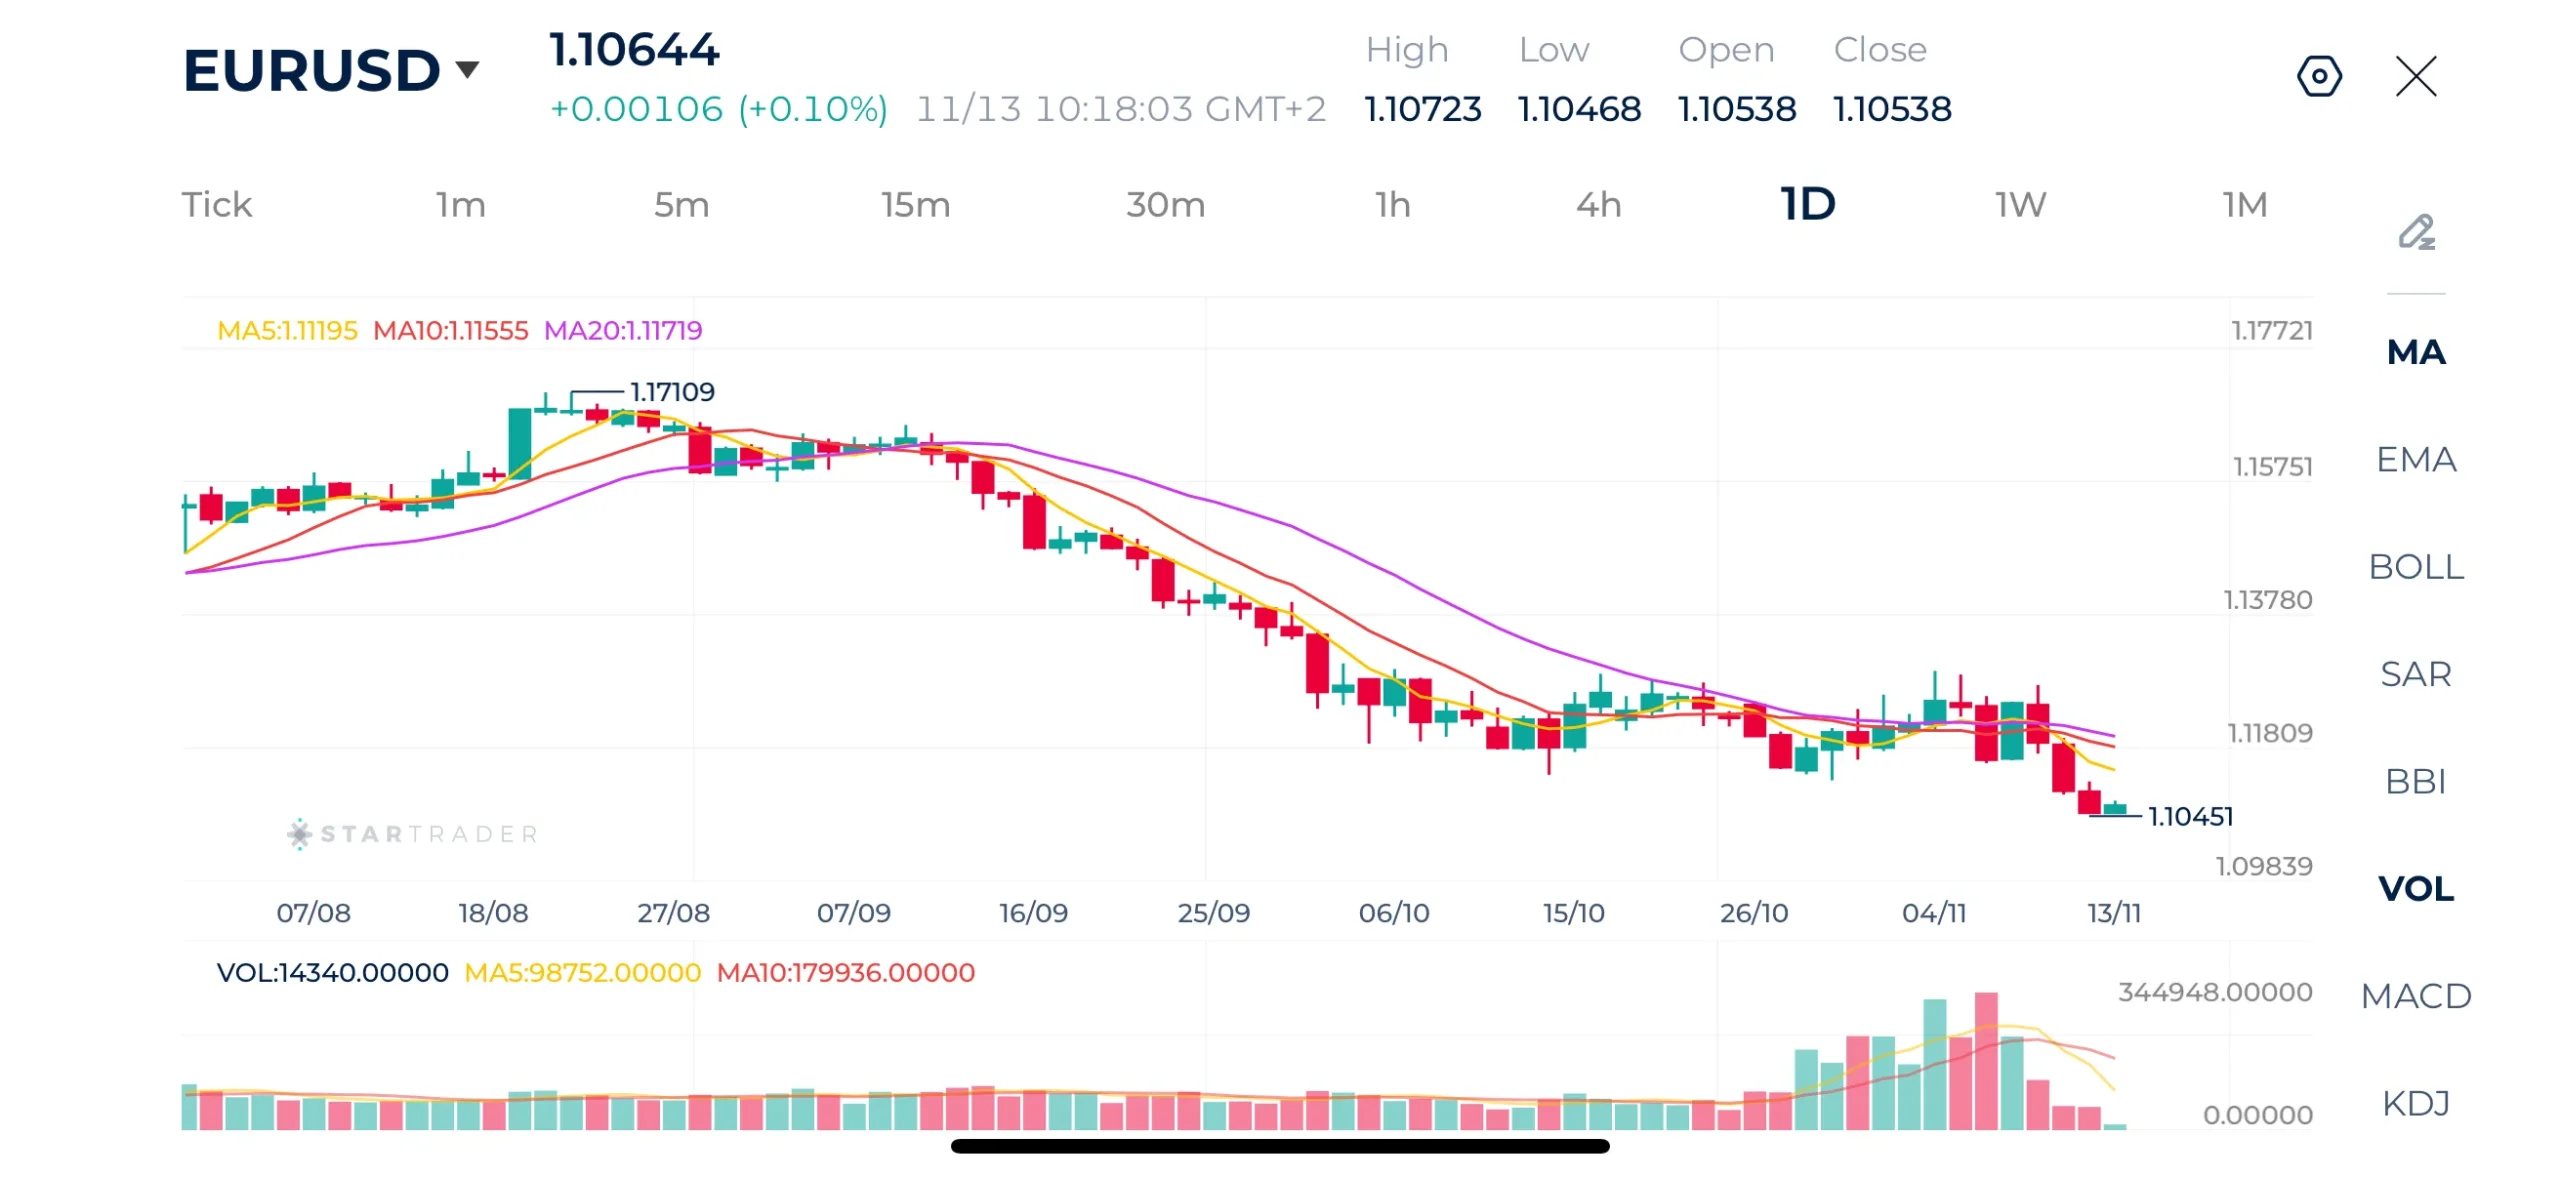
Source: STARTRADER app | EURUSD declines as the US dollar index reaches its highest level in 2026
| Resistance | 1.1121 – 1.1120 | 1.1231 – 1.1240 | 1.1295 – 1.1300 |
|---|---|---|---|
| Support | 1.0966 – 1.0980 | 1.0911 – 1.0918 | 1.0861 – 1.0870 |
Gold Technical Analysis
Gold shows weakness as the price is around $3,896, well below the 5-day, 10-day, and 20-day moving averages. The precious metal has fallen considerably in the past few months from the $4,696 peak and has established a sequence of lower highs and lower lows. The latest decline toward $3,852 confirms that sellers remain in control, although today’s small rebound indicates some buying interest near the lower end of the range.
The immediate support is $3,850–$3,870, while a break below this area would expose approximately $3,775–$3,800. On the upside, $3,930–$3,970 is the first resistance zone, followed by the psychologically important 4,000 level and then the MA20 around $4,005–$4,030. The short-term bias remains bearish, with the current rebound looking more like stabilization after a sharp decline than a confirmed trend reversal.
Gold Daily Chart
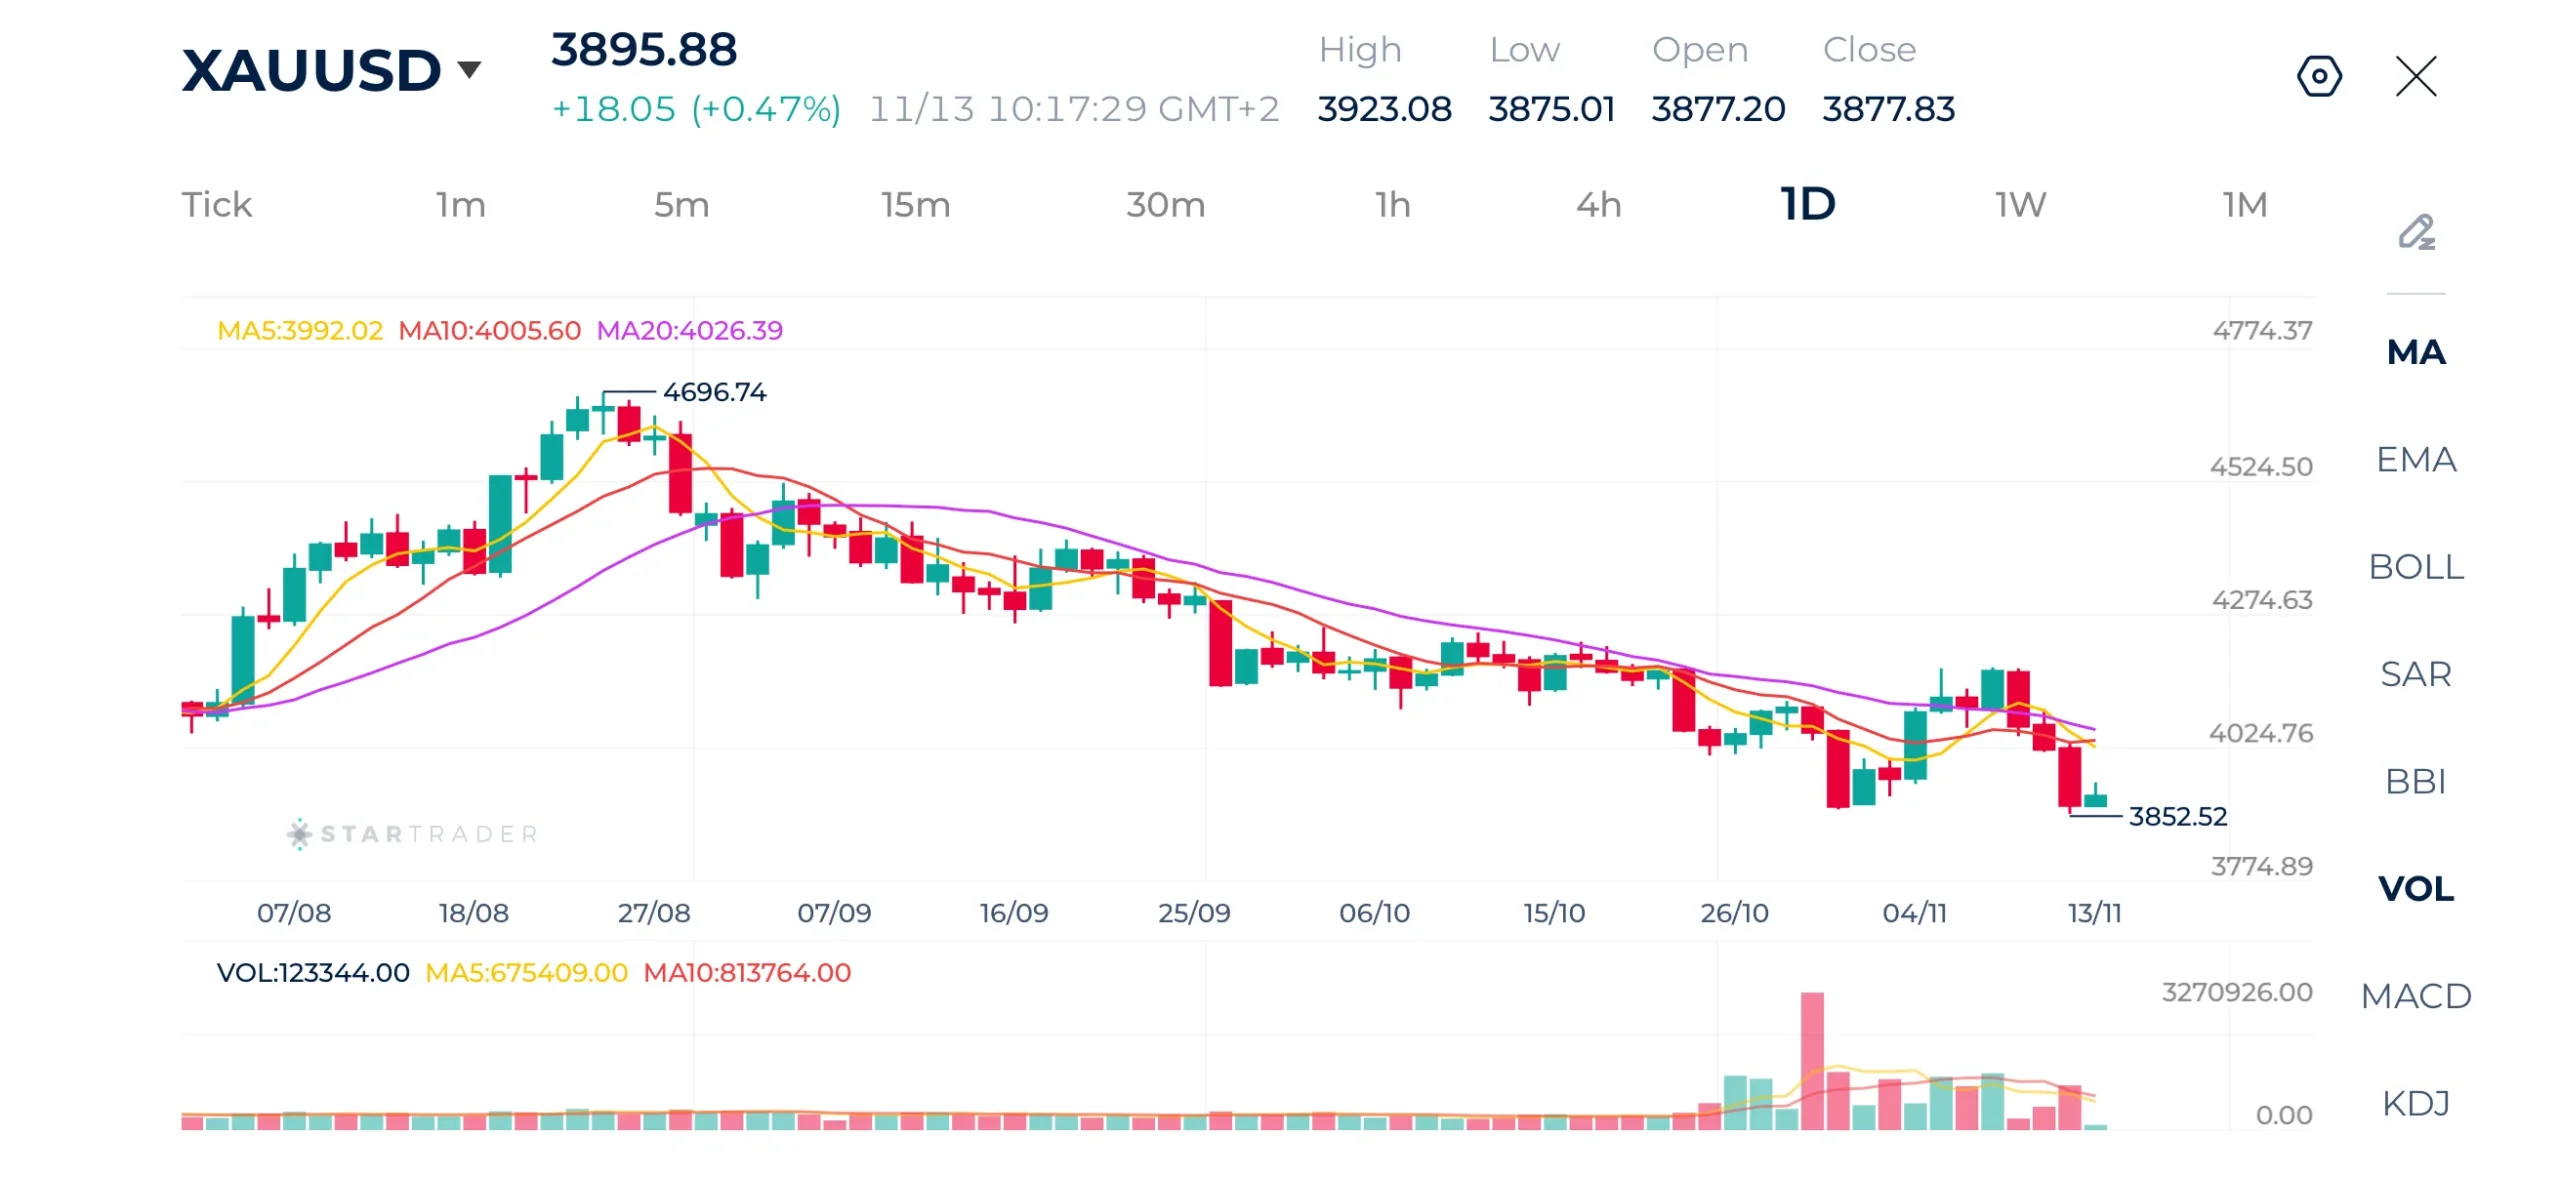
Source: STARTRADER app | Gold falls to its lowest level in 2026, pressured by a more hawkish Fed
| Resistance | $3,930 – $3,948 | $4,000 – $4,021 | $4,087 – $4,100 |
|---|---|---|---|
| Support | $3,775 – $3,780 | $3,686 – $3,690 | $3,600 – $3,621 |
Risk Disclaimer: This material is provided for informational purposes only and does not constitute a recommendation or investment advice. Trading financial instruments on margin involves substantial risk and may not be appropriate for all investors.
https://open.spotify.com/episode/0jmz1MQEQRQCf9rJ3nQgL4?si=Jox6Elx7T_mCsCU4MRLZGA
Tags


Open Live Account
 Email Address
 Phone Number
Important Notice
STARTRADER does not accept any applications from Australian residents.
To comply with regulatory requirements, clicking the button will redirect you to the STARTRADER website operated by STARTRADER PRIME GLOBAL PTY LTD (ABN 65 156 005 668), an authorized Australian Financial Services Licence holder (AFSL no. 421210) regulated by the Australian Securities and Investments Commission.
Important Notice for Residents of the United Arab Emirates
In alignment with local regulatory requirements, individuals residing in the United Arab Emirates are requested to proceed via our dedicated regional platform at startrader.ae, which is operated by STARTRADER Global Financial Consultation & Financial Analysis L.L.C.. This entity is licensed by the UAE Capital Market Authority (CMA) under License No. 20200000241, and is authorised to introduce financial services and promote financial products in the UAE.
Please click the "Continue" button below to be redirected.


