








 Web Trader MT5









Key Takeaways
- US Stocks rebound after early losses. Global markets were similarly volatile as Asian and European stocks fell initially, then stabilized as fears eased.
- Oil volatility remains extreme with crude oil breaking $114 amid Strait of Hormuz disruptions. Geopolitical risk premium is still very high.
- Precious metals trade sideways as gold stabilizes around $5,100 while silver traded in the mid-$80s.
- The U.S. Dollar Index (DXY) jumped toward the 100 mark on safe haven demand. The dollar strengthened against most peers
- Headline-driven volatility across assets as markets remain highly sensitive to geopolitical news.
U.S. and Global Stocks
U.S. equity markets were wildly choppy during the week on geopolitical headlines. Monday, 9 March saw major U.S. indices slump at the open on Iran war fears. By midday, however, President Trump’s comments that the war is likely to end soon sparked a relief rally. All three indices recovered, and by the close the Dow was up 0.5%, S&P 500 up 0.8%, and Nasdaq closed 1.4% higher, erasing most of the session’s losses.
Global markets followed suit. Asian shares initially fell on Monday. South Korea’s KOSPI plunged early in the week on heightened risk aversion, but later recovered as U.S. futures turned positive. European stocks declined mid-week along with oil, though relief around planned strategic reserve releases and a de-escalation narrative cushioned the fall.
Through Friday, the S&P 500 ended roughly flat on the week, but down from the previous week. Dow Jones finished modestly down, and the Nasdaq shed around 2%. The turbulence underscores that markets are still factoring in a wide range of possible conflict outcomes.
Oil Market
Oil prices were the week’s biggest movers during the week. On Monday, news of Iranian threats and a Strait of Hormuz shutdown sent crude futures skyrocketing. WTI crude and Brent crude both opened with massive gaps above $113/barrel, the highest since mid-2022. This was driven by the war’s second week and effectively halted shipping in the Persian Gulf.
However, this extreme spike proved short lived. Later Monday, markets were reassured by two developments. First, a G7/IEA meeting discussed coordinated release of oil from strategic stockpiles. Second, Trump’s comments about a potential end for the conflict soon lifted hopes of a swift resolution. Crude prices subsequently reversed course. By the Monday close WTI had plunged roughly 6–8%, falling back into the mid-$80s.
On Wednesday, 11 March, the IEA announced it would release a record 400 million barrels from member reserves. Oil prices dipped briefly on the news but then quickly recovered as Iran intensified attacks. By Thursday, Brent settled around $100.00 and WTI near $95.70.. Investors will likely keep a close eye on any news about shipping security or additional strategic releases next week.
Gold & Silver
Precious metals saw relatively muted net moves. Gold traded roughly between $5,050–$5,150 an ounce over the week. It dipped modestly from midweek highs as the U.S. dollar strengthened. By Thursday, gold was down almost 1.7% at $5,088. Silver likewise traded in a narrow range around the mid-$80s, easing 1% to $84.90 on Thursday.
The lack of a dramatic rally in gold and silver reflects that much of the safe haven demand was absorbed by the U.S. dollar. As DXY climbed toward 100, dollar-priced gold became more expensive for foreign buyers. In short, precious metals were range-bound, with gains earlier in the month offset by profit-taking and currency effect.
Forex & Dollar
The U.S. dollar was the clear beneficiary of market turmoil. The Dollar Index (DXY) climbed to roughly 99.80–99.90 by week’s end, a nearly 1.5% jump over a few days. This drove EUR/USD down to about 1.1500, and USD/JPY jumped toward 159–160. The euro’s decline was noted explicitly on Thursday amid dollar safe-haven flows.
Overall, the greenback’s surge was fueled by both safe-haven demand and the U.S. being a net energy exporter as energy prices spiked globally.
Outlook for the Upcoming Week
Heading into next week, markets will likely remain highly reactive to Middle East developments. If the conflict shows any sign of easing, like reopening of the Strait of Hormuz or a ceasefire, we could see a sharp pullback in oil prices and risk assets may rally. Conversely, any new attacks on tankers or escalation would likely push crude back toward triple digits and reinforce safe-haven flows into USD and Treasuries.
Key factors to watch:
- Strategic Reserve Releases: Implementation details of the IEA/G7 oil release will be crucial. A coordinated drawdown of 400 million barrels may cap gains, but markets will monitor actual quantities and timing.
- Strait of Hormuz: Any news on naval escorts or re-opening of the chokepoint will heavily influence energy and shipping sectors.
- Geopolitical Headlines: Trump’s statements or other diplomatic signals can trigger quick market swings.
- Economic Data: U.S. inflation indicators and Fed comments may matter if the oil shock persists, as they will influence rate-cut expectations.
On the whole, we expect continued volatility. Oil will likely trade in a wide range around current highs until the conflict’s duration becomes clearer. Stocks may consolidate sideways with a bias toward risk-off, given elevated oil and inflation concerns. Gold could find support around $5,050–$5,100 if geopolitical risk remains, but sustained dollar strength may cap rallies. Currencies will hinge on safe haven demand. A weaker euro and yen are likely to persist unless global growth fears ease.
Key Economic Data of the week
- China’s CPI and PPI inflation numbers surprise to the upside with consumer inflation at 1.3% on a yearly basis.
- US consumer price index remains stable at 2.4% on a yearly basis in February.
- US weekly unemployment claims remain largely stable at 213K.
- UK’s economy showed no growth in January.
Major Economic Calendar Events for the Upcoming Week
| Date | Metric | Country | Previous | Time [Dubai] |
| Monday, 16 March | Consumer Price Index y/y | Canada | 2.70% | 4:30 PM |
| Tuesday, 17 March | Interest Rate Decision | Australia | 3.85% | 7:30 AM |
| Wednesday, 18 March | Producer Price Index m/m | USA | 0.50% | 4:30 PM |
| Wednesday, 18 March | Interest Rate Decision | Canada | 2.25% | 5:45 PM |
| Wednesday, 18 March | Federal Funds Rate | USA | 3.75% | 10:00 PM |
| Thursday, 19 March | Interest Rate Decision | Japan | 0.75% | Tentative |
| Thursday, 19 March | Interest Rate Decision | Switzerland | 0.00% | 12:30 PM |
| Thursday, 19 March | Interest Rate Decision | UK | 3.75% | 4:00 PM |
| Thursday, 19 March | Interest Rate Decision | Euro | 2.15% | 5:15 PM |
| Friday, 20 March | Retail Sales m/m | Canada | -0.40% | 4:30 PM |
Technical Analysis and Forecast:
Brent Technical Analysis
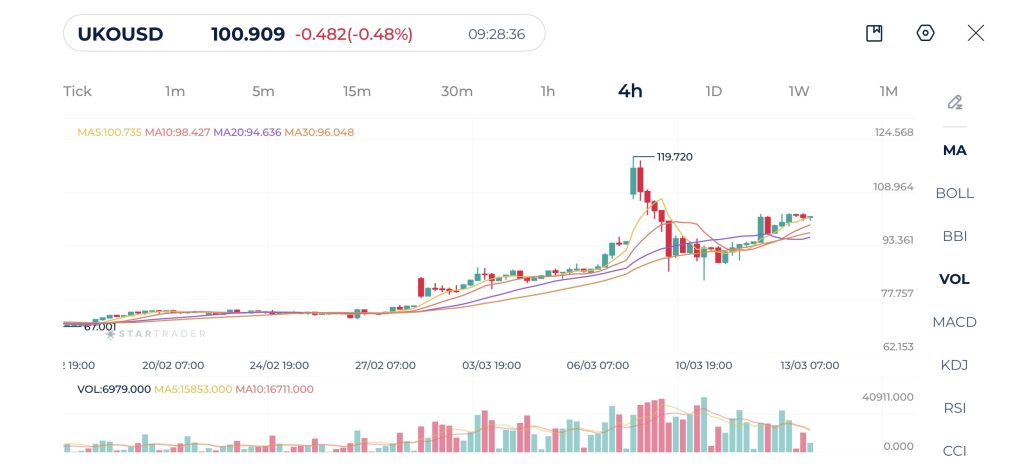
Brent crude oil is currently trading around $100, maintaining a bullish structure after a strong rally that pushed prices toward a high near $119. After that surge, price corrected sharply and has since been consolidating in the $98–$102 range, suggesting that the market is stabilizing after earlier volatility.
Moving averages indicate that the broader bullish trend remains intact. The short term averages MA5 and MA10 are positioned above the MA20 and MA30, while price continues to trade above the longer-term averages. This configuration confirms that the medium term trend remains bullish despite the recent pullback.
Volume activity increased significantly during the rally toward $119, reflecting strong bullish momentum. The subsequent correction was accompanied by high selling volume as traders took profits.
Technically, $102–$105 represents the nearest resistance zone, as it corresponds to the upper boundary of the current range. A break above this area could open the door for a move toward $110 and possibly $115. On the downside, $98 acts as immediate support, while the stronger structural support remains near $93–$95.
Brent 4H Chart
| Resistance | $102.10 – $102.45 | $103.30 – $103.47 | $108.21 – $108.50 |
| Support | $92.88 – $93.00 | $85.82 – $86.00 | $83.67 – $84.10 |
Dow Jones Technical Analysis
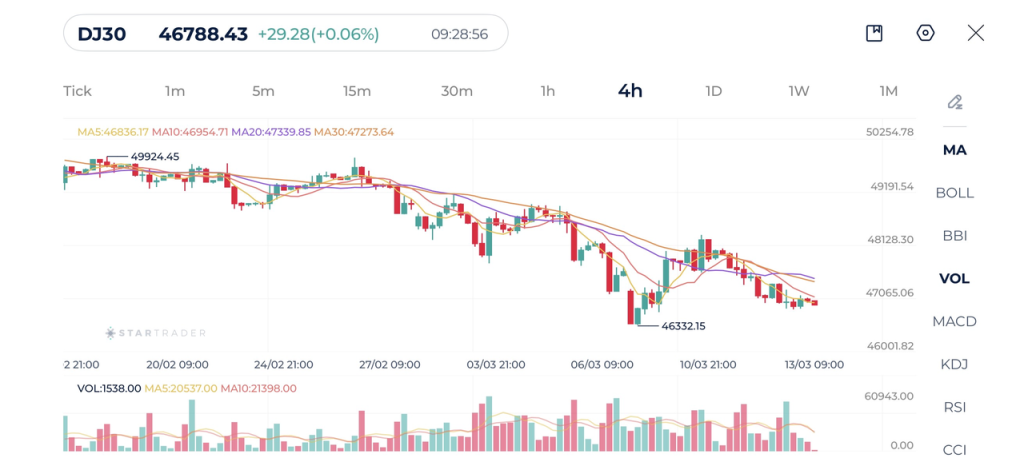
Dow Jones is currently trading around 46,800, continuing to show weakness after a prolonged decline from the 50,000 psychological level. The market recently formed a low near 46,332, where a short-term rebound occurred.
Moving averages confirm the bearish bias. The MA5 and MA10 remain below the MA20 and MA30, and all the averages are sloping downward, reflecting sustained selling pressure. Price is also trading below the longer-term averages, which indicates that the market has not yet established a meaningful recovery.
Volume activity increased during the recent selloff toward 46,300, confirming strong bearish momentum. Although the market has attempted a rebound, the declining volume during the recovery suggests that buying interest remains limited and that the rebound may simply represent a temporary correction within the broader downtrend.
From a technical standpoint, 47,500–48,000 represents the nearest resistance zone, where previous breakdowns occurred. A sustained move above this level would be required to signal a potential recovery. On the downside, 46,300 remains the key support level, and a break below it could expose the index to further declines toward 45,500.
Dow Jones 4H Chart
| Resistance | 47,231 – 47,280 | 47,534 – 47,590 | 48,224 – 48,267 |
| Support | 46,300 – 46,340 | 45,916 – 45,978 | 45,433 – 45,520 |
Gold Technical Analysis
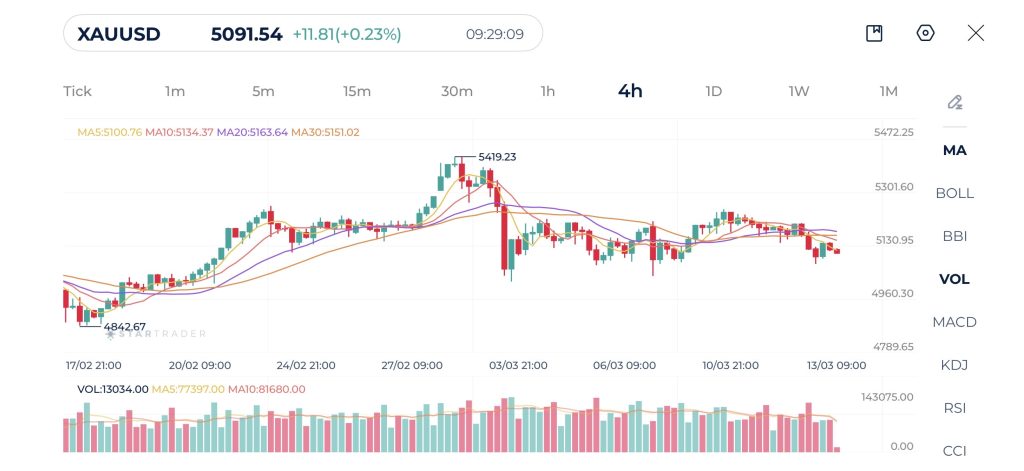
Gold is currently trading around $5,090, following a strong rally that peaked at $5,600 earlier in the year before experiencing a sharp correction. The price action indicates that the market is currently attempting to stabilize after the sharp decline.
From a moving average perspective, the short-term averages MA5 and MA10 have turned downward and are currently positioned below the MA20, while the MA30 remains above price, reflecting the shift toward bearish momentum following the recent correction. The compression of the moving averages suggests that the market may continue to consolidate before establishing a clearer directional move.
Volume analysis supports this interpretation. The decline from the $5,400 area was accompanied by strong volume, indicating aggressive selling pressure. Since then, trading activity has moderated, which suggests that selling pressure is easing and the market may be transitioning into a sideways phase.
Technically, the $5,150–$5,200 area represents the nearest resistance, as it corresponds to the previous consolidation zone before the decline. A break above this region could allow the market to move toward $5,300. On the downside, $5,050 acts as immediate support, while the stronger structural support remains near 5,000, which previously triggered the recent rebound.
Gold 4H Chart
| Resistance | $5,189 – $5,220 | $5,240 – $5,255 | $5,300 – $5,314 |
| Support | $5,054 – $5,070 | $5,000 – $5,014 | $4,961 – $4,970 |
Bitcoin Technical Analysis
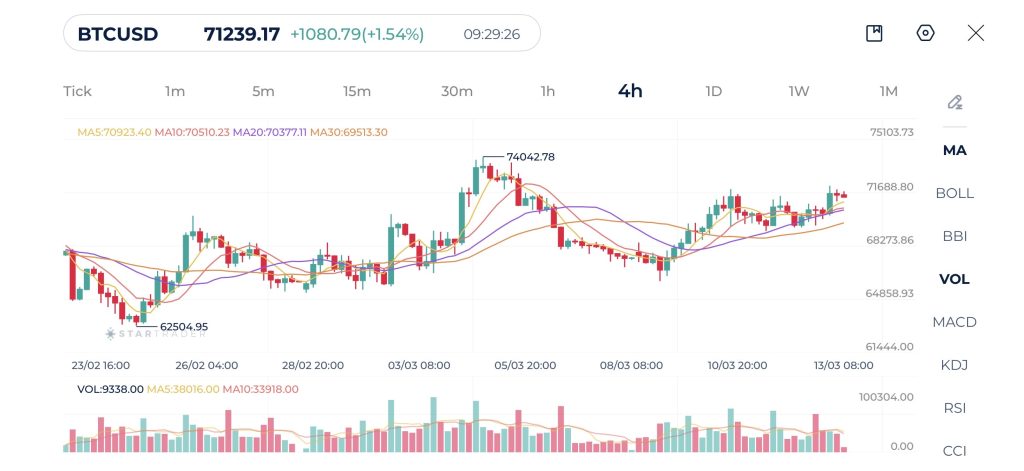
Bitcoin is currently trading near $71,200, continuing its recovery from the $60,000 levels. Price structure on the 4-hour chart now shows a sequence of higher lows and higher highs, which indicates that buyers are slowly regaining control of the market.
The moving averages reinforce this improving momentum. The MA5 has crossed above MA10 and MA20, while the price is now trading above all the short-term averages and approaching the MA30. This alignment reflects strengthening bullish sentiment in the short term. Additionally, the MA30 continues to slope upward slightly, suggesting that the broader trend still leans bullish despite the recent consolidation phase.
From a technical perspective, the $72,000–$74,000 region remains the key resistance zone, as it corresponds to the recent swing high and the area where sellers previously emerged. A breakout above this region could open the path toward $75,000 and potentially new highs. On the downside, $70,000 acts as immediate support, followed by the stronger support around $68,000.
Bitcoin 4H Chart
| Resistance | $72,000 – $72,051 | $73,460 – $73,500 | $75,860 – $76,000 |
| Support | $69,227 – $69,400 | $67,860 – $67,900 | $65,423 – $65,500 |
Risk Disclaimer: This material is provided for informational purposes only and does not constitute a recommendation or investment advice. Trading financial instruments on margin involves substantial risk and may not be appropriate for all investors.
Tags


Open Live Account
 Email Address
 Phone Number
Important Notice
STARTRADER does not accept any applications from Australian residents.
To comply with regulatory requirements, clicking the button will redirect you to the STARTRADER website operated by STARTRADER PRIME GLOBAL PTY LTD (ABN 65 156 005 668), an authorized Australian Financial Services Licence holder (AFSL no. 421210) regulated by the Australian Securities and Investments Commission.
Important Notice for Residents of the United Arab Emirates
In alignment with local regulatory requirements, individuals residing in the United Arab Emirates are requested to proceed via our dedicated regional platform at startrader.ae, which is operated by STARTRADER Global Financial Consultation & Financial Analysis L.L.C.. This entity is licensed by the UAE Capital Market Authority (CMA) under License No. 20200000241, and is authorised to introduce financial services and promote financial products in the UAE.
Please click the "Continue" button below to be redirected.


