


 Web Trader MT5












Key Takeaways
- Oil prices plunged as hopes for US-Iran negotiations increased, but renewed escalation fears triggered a rebound in crude.
- Democrats’ midterm sweep boosted markets initially but raised concerns over tighter AI and data-center regulation.
- US stocks rebounded sharply, with the Dow surging more than 1,500 points after the election results.
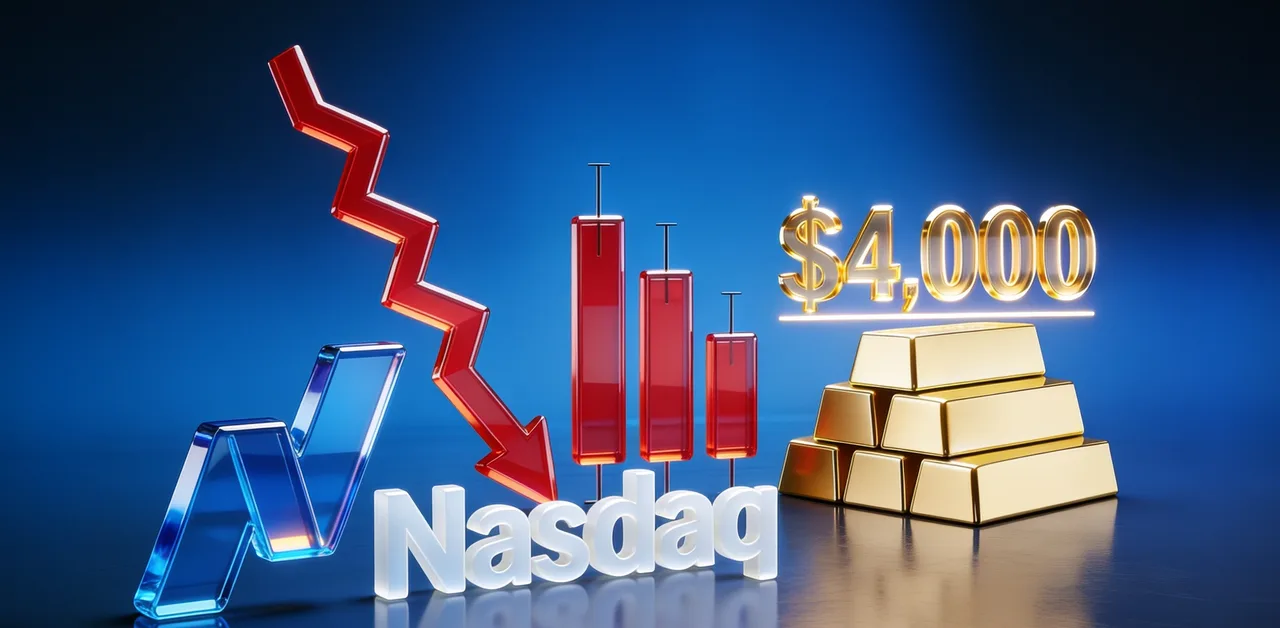
- Technology stocks remained under pressure, with the Nasdaq briefly entering correction territory amid AI valuation and capex concerns.
- Gold fell below $4,000 before recovering above $4,100, supported by a weaker dollar and lower Treasury yields.
- AI spending remains a key market risk, as investors increasingly demand evidence that massive infrastructure investments will generate sufficient returns.
Oil sees sharp decline followed by renewed volatility
Crude oil was one of the biggest movers this week. Expectations of a possible diplomatic breakthrough between the US and Iran initially pushed prices lower. Following the midterm elections, the market interpreted the results as increasing political pressure on the Trump administration to reduce the conflict,
However, renewed concerns about military escalation and uncertainty surrounding the Iran negotiations triggered a rebound in crude, highlighting how sensitive oil remains to geopolitical headlines. Prices remain elevated with Brent trading above $100 a barrel.
US Midterm Elections: Democrats take control
The major political event of the week was the Democratic sweep of both the House and Senate. Markets initially reacted positively, with US equities rallying strongly as investors anticipated greater constraints on Trump’s policy agenda and a lower probability of further escalation in the Middle East. The Dow Jones surged more than 1,500 points, or around 3%, in one session, while the S&P 500 gained around 1.6%.
The election result also created a more complicated outlook for the technology sector. Democratic control could mean greater scrutiny of AI infrastructure, data centers, electricity demand and technology regulation, although it does not necessarily derail the broader AI investment cycle.
The week also saw a sharp selloff across technology and AI stocks, as investors continued to question whether the massive capital spending on AI infrastructure can generate sufficient returns. The Nasdaq came under significant pressure and briefly fell into correction territory. The selling reflected a combination of elevated valuations, profit taking after a strong rally, concerns over the sustainability of AI-related spending, and uncertainty over whether Democratic control of Congress could lead to tighter regulation of the technology and data center sectors.
Gold Holds $4,000 Level Despite Recent Decline
Gold experienced one of its most volatile weeks in recent months. The precious metal started the week recovering from a sharp selloff that had taken it below $4,000, reaching a low around $3,870–$3,900. The initial decline was driven partly by higher rate expectations and forced selling associated with the technology stock selloff.
Gold then staged a powerful recovery following the election results. A weaker US dollar, falling Treasury yields, lower oil prices and expectations of reduced geopolitical escalation helped push gold back above $4,000 and subsequently above $4,100, with the metal reaching around $4,140 during the week.
Forecast for Next Week
The key theme for next week will be whether markets can maintain the post-election rally or whether geopolitical and AI related concerns return to the forefront. Oil will remain particularly important. A sustained move lower in crude would ease inflation expectations and support equities and gold, while renewed US-Iran escalation could push oil higher again, revive inflation concerns and pressure risk assets.
For US equities, the outlook remains cautiously positive following the powerful post election rally, but investors should expect elevated volatility.
For gold, the recovery above $4,000 is technically and psychologically important. A weaker dollar and lower Treasury yields could continue supporting the metal, particularly if oil remains subdued. However, after its rapid rebound toward $4,100–$4,140, some profit taking would not be surprising. The next major test will be whether gold can consolidate above $4,000 rather than simply experiencing another short-term rally.
Major Economic Calendar Events for the Upcoming Week
| Date | Metric | Country | Previous | Expected | Time [Dubai] |
|---|---|---|---|---|---|
| Tuesday, 10 November | Consumer Price Index y/y | USA | 3.7% | 5:30 PM | |
| Thursday, 12 November | Gross Domestic Product m/m | UK | 0.1% | 11:00 AM | |
| Thursday, 12 November | Unemployment Claims | USA | 5:30 PM | ||
| Thursday, 12 November | Existing Home Sales | USA | 3.99M | 3.88M | 7:00 PM |
| Friday, 13 November | Producer Price Index m/m | USA | 1.3% | 0.004 | 5:30 PM |
Technical Analysis and Forecast:
Nasdaq Technical Analysis
Nasdaq 100 remains technically bearish, trading around 26,881 after falling sharply from its October peak near 31,411. The recent sell-off was particularly aggressive, with the index reaching a low of 26,268, followed by a modest recovery. However, the index remains well below all three moving averages, with the 5-day MA, the 10-day MA and the 20-day MA, confirming that the broader trend remains under pressure. The immediate resistance zone is around 27,300–27,700, followed by the 10-day MA near 28,460. On the downside, 26,268 is the key near term support, and a break below it could expose the 25,800 area. Short term bias: bearish, although the extremely sharp decline leaves room for further corrective rebounds.
Nasdaq Daily Chart
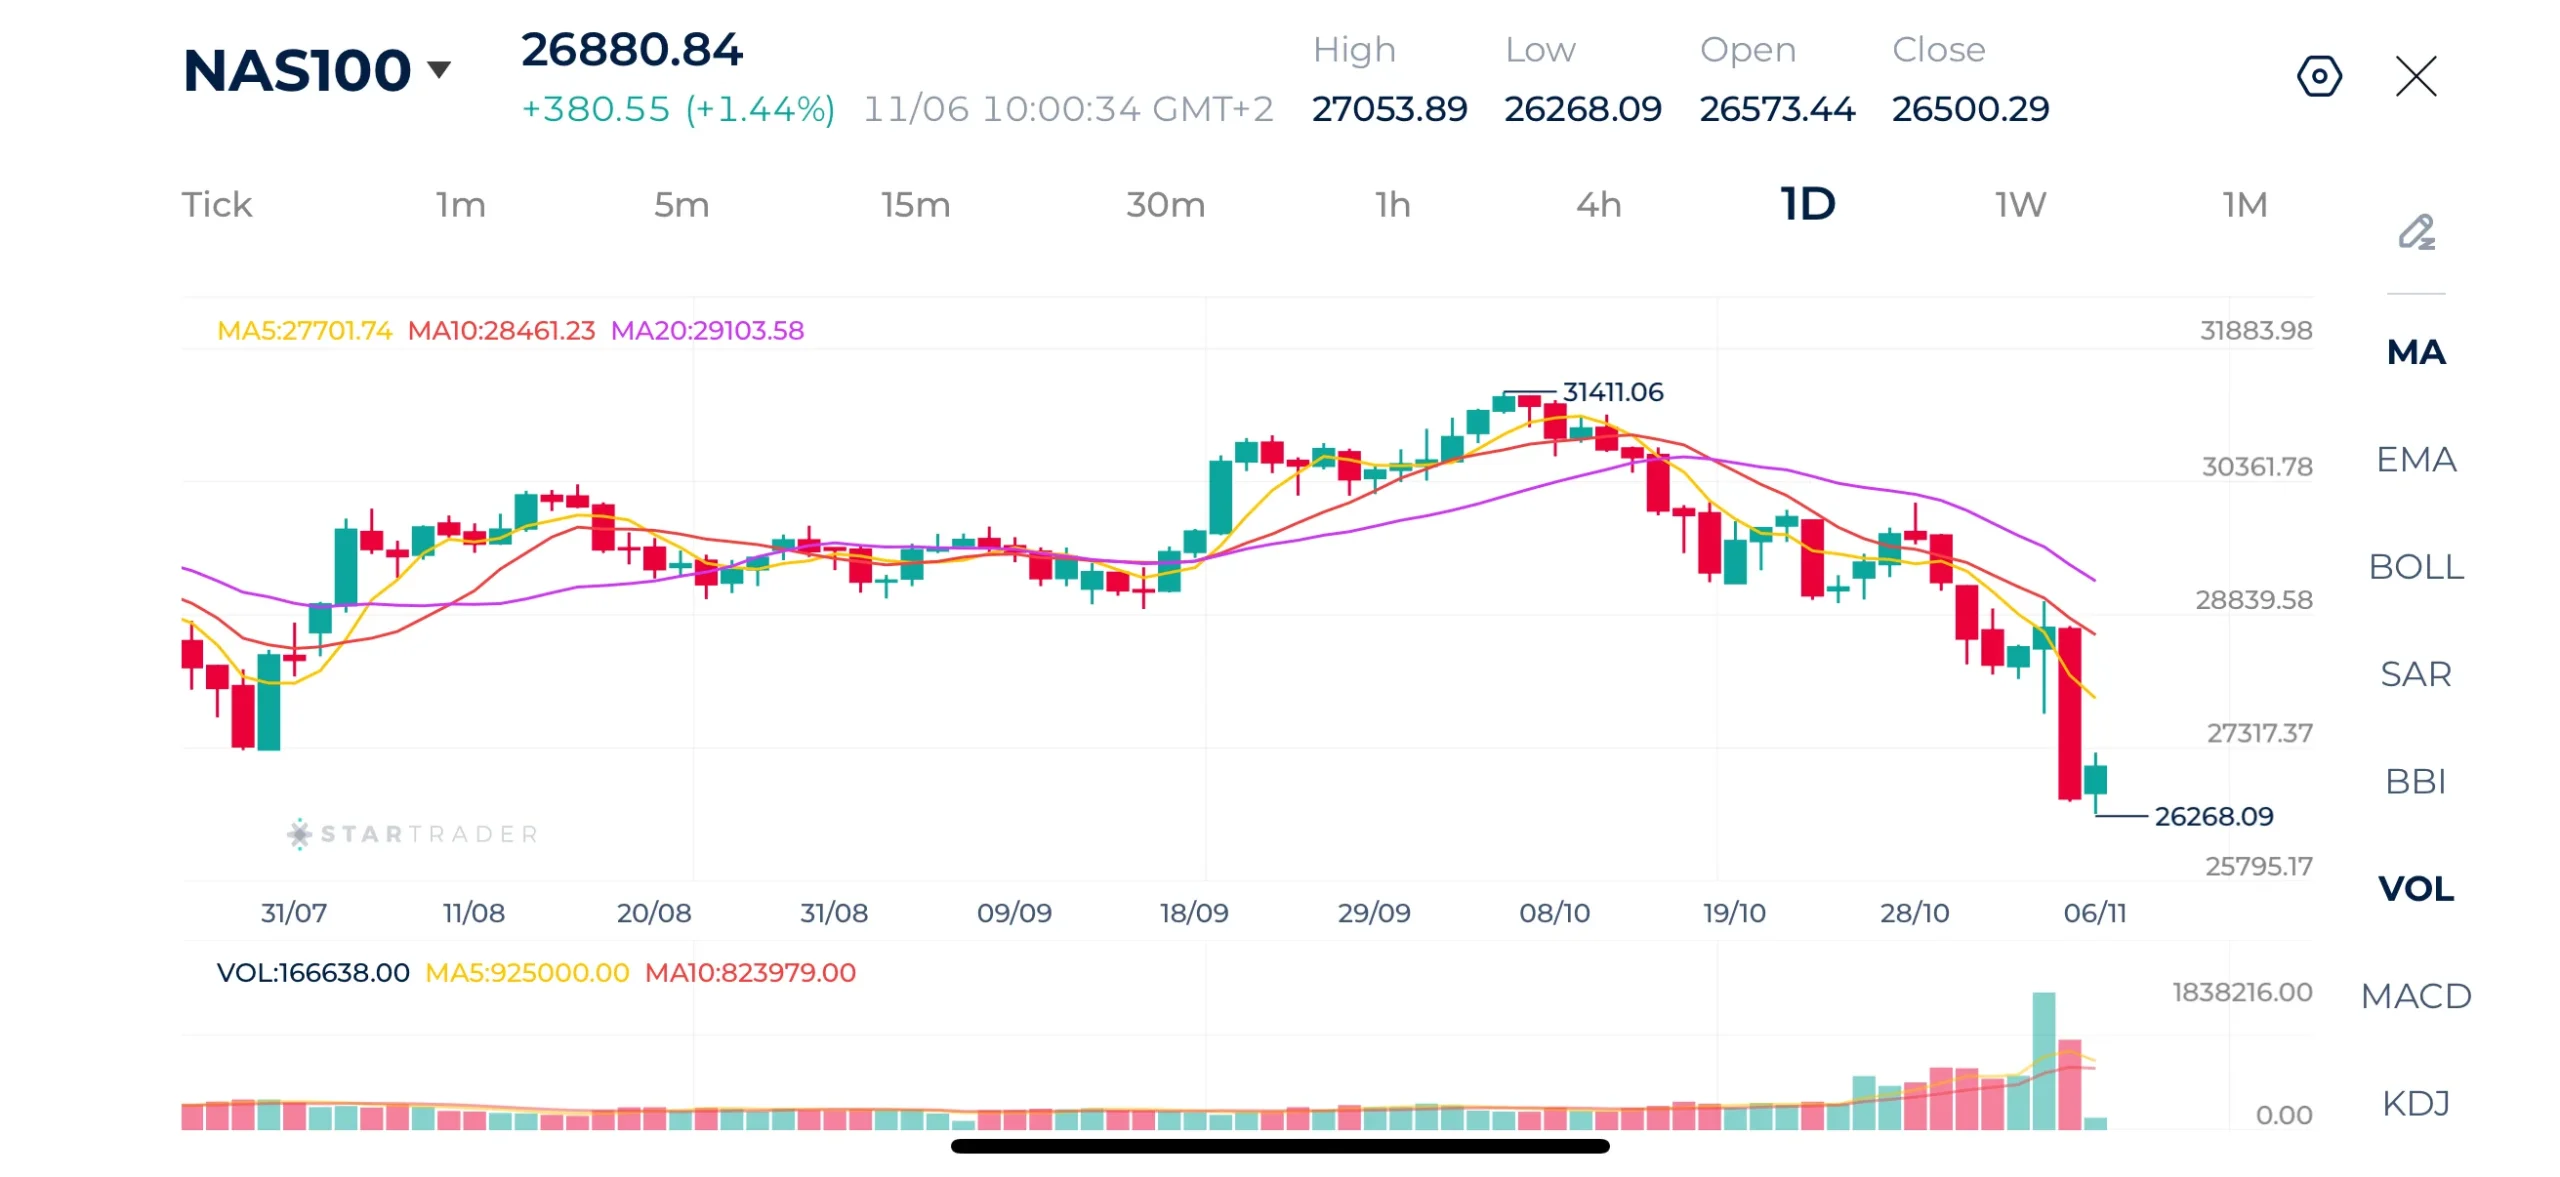
Source: STARTRADER app | Sharp declines on global stock indices, with the Nasdaq hit hard due to tech stock sell-off
| Resistance | 26,730 – 26,745 | 27,300 – 27,321 | 27,700 – 27,715 |
|---|---|---|---|
| Support | 26,150 – 25,164 | 25,800 – 25,810 | 25,720 – 25,733 |
EURUSD Technical Analysis
EURUSD remains under pressure on the daily chart, trading around 1.1177 after failing to sustain the recent recovery toward the 1.1230–1.1235 area. The broader structure remains bearish following the decline from the August high near 1.1710, although the pair has recently entered a consolidation phase after finding support around 1.1104. The 5-day, 10-day, and 20-day moving averages continue to reflect a weak trend. A sustained break above 1.1235 would strengthen the recovery and open the way toward 1.1407, while a break below 1.1104 would signal renewed downside momentum.
Short term bias: neutral to bearish, with the pair needing to reclaim 1.1235 to establish a more convincing recovery.
EURUSD Daily Chart
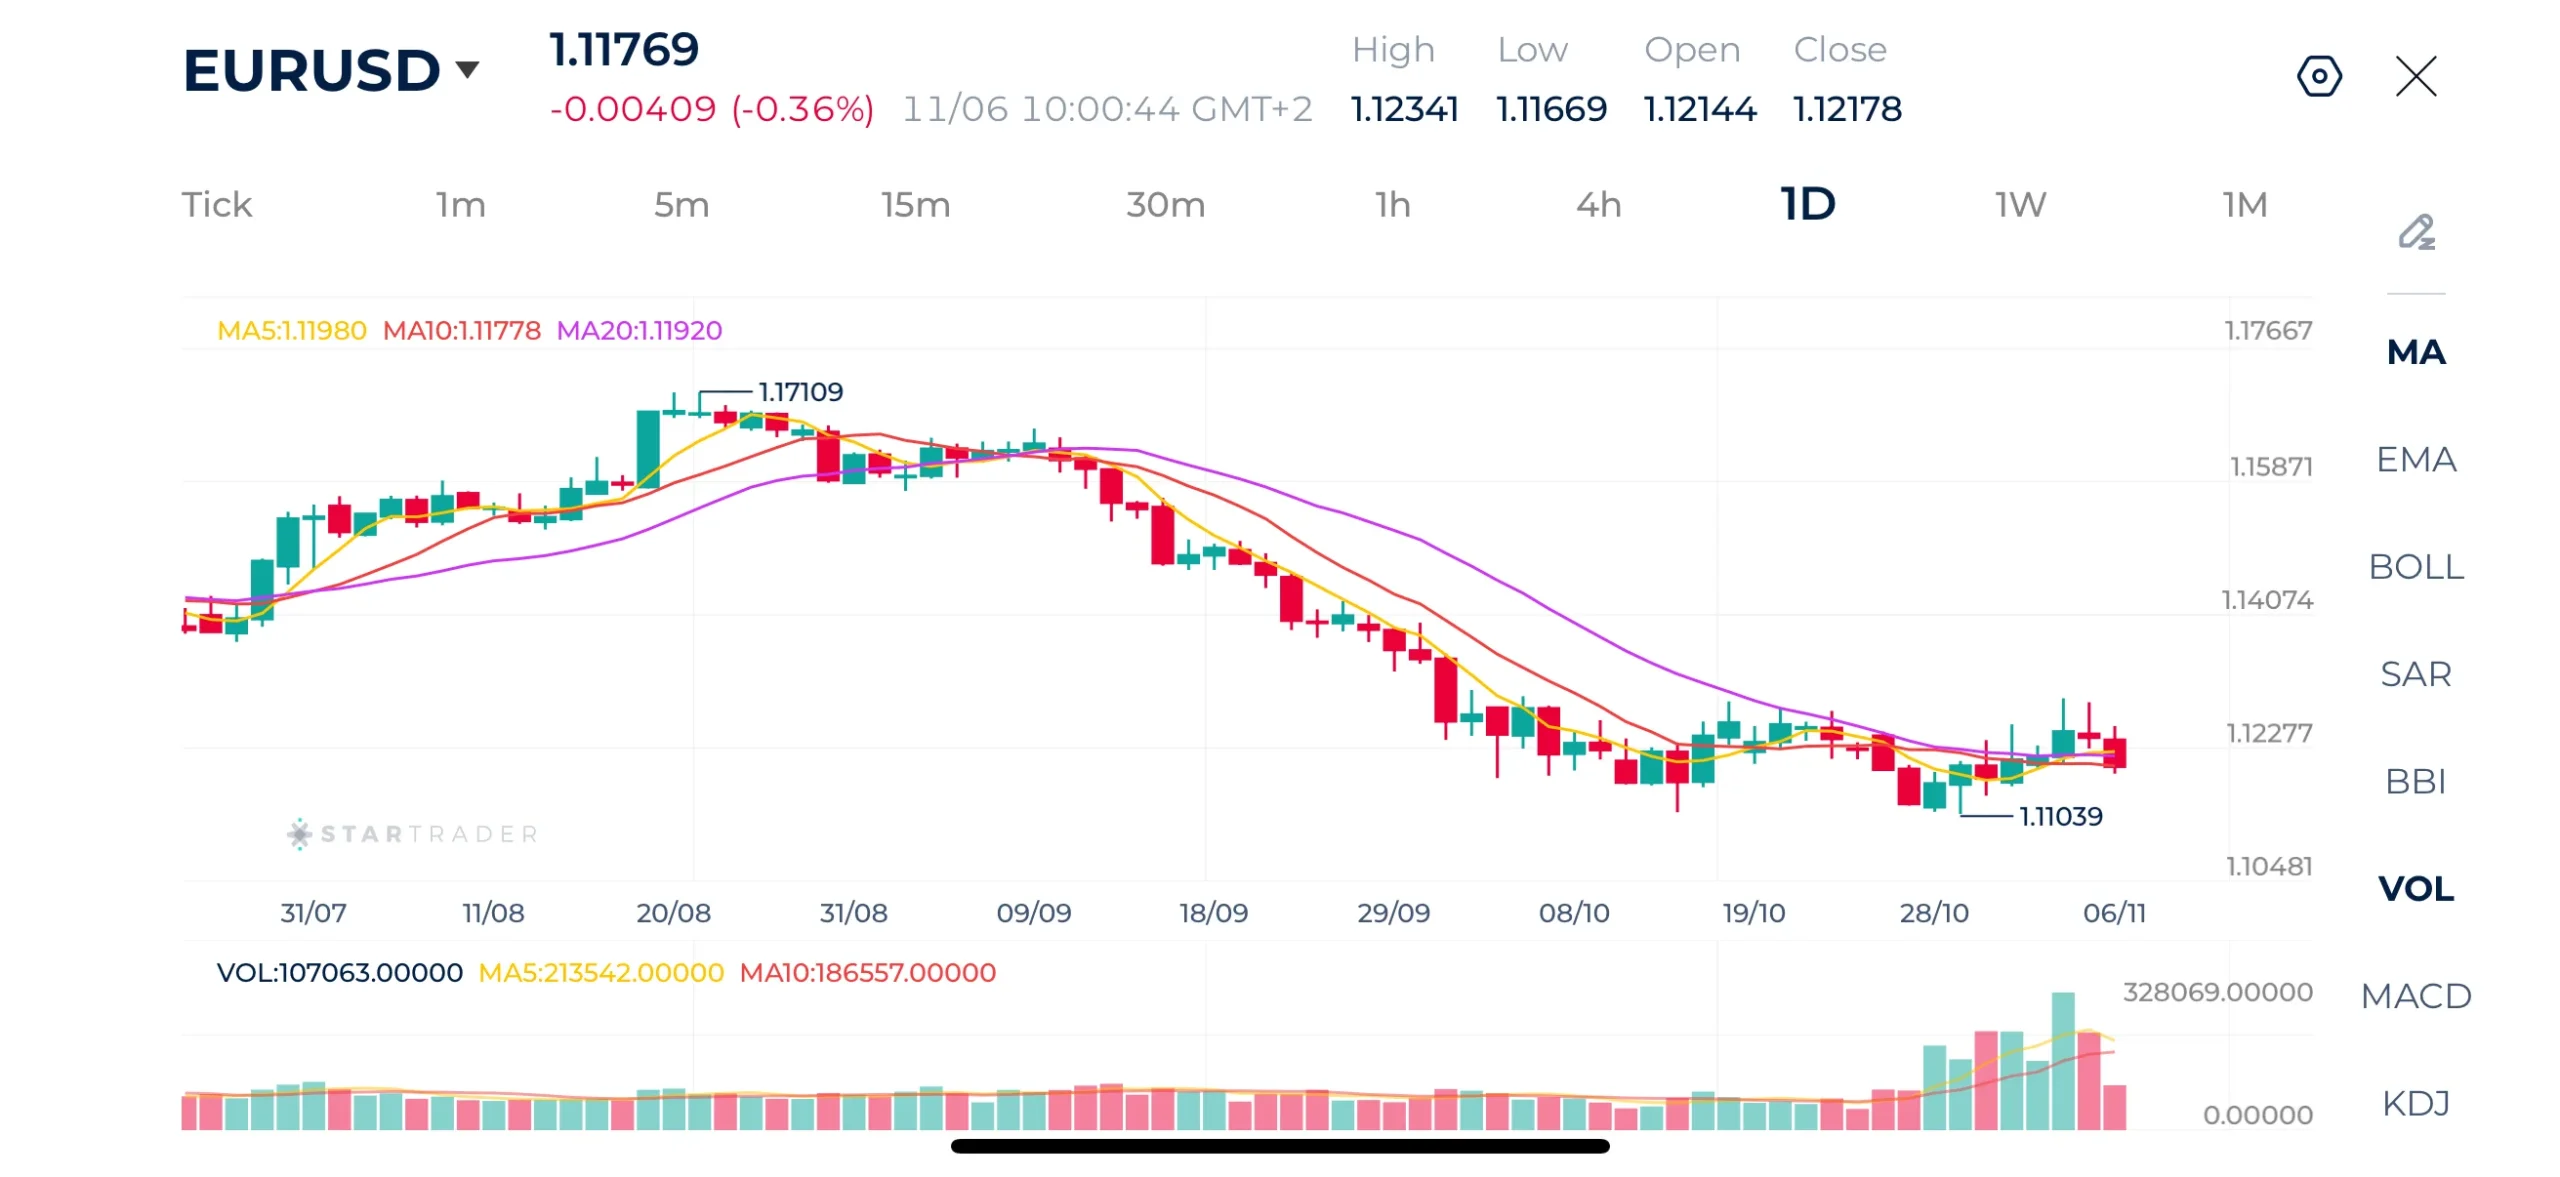
Source: STARTRADER app | EURUSD attempts to break higher after bouncing from the psychological support of 1.1100
| Resistance | 1.1235 – 1.1240 | 1.1407 – 1.1415 | 1.1500 – 1.1512 |
|---|---|---|---|
| Support | 1.1137- 1.1140 | 1.1107- 1.1120 | 1.1060 – 1.1074 |
Brent Technical Analysis
Brent continues to show a clear bearish structure, trading around $102.29 after a significant decline from the $118.80 peak. The latest sell-off accelerated as price broke below the previous consolidation area and reached approximately $96.95 before staging a limited rebound. The 5-day, 10-day, and 20-day moving averages remain firmly bearish and positioned above the current price. The first important resistance is therefore around $104–105, while a recovery above this area could target the psychological $110 region. On the downside, $99.20 is the immediate support, followed by the recent low around $96.95.
Short term bias: bearish, with the current rebound looking corrective unless oil can reclaim the $104–105 zone.
Brent Daily Chart
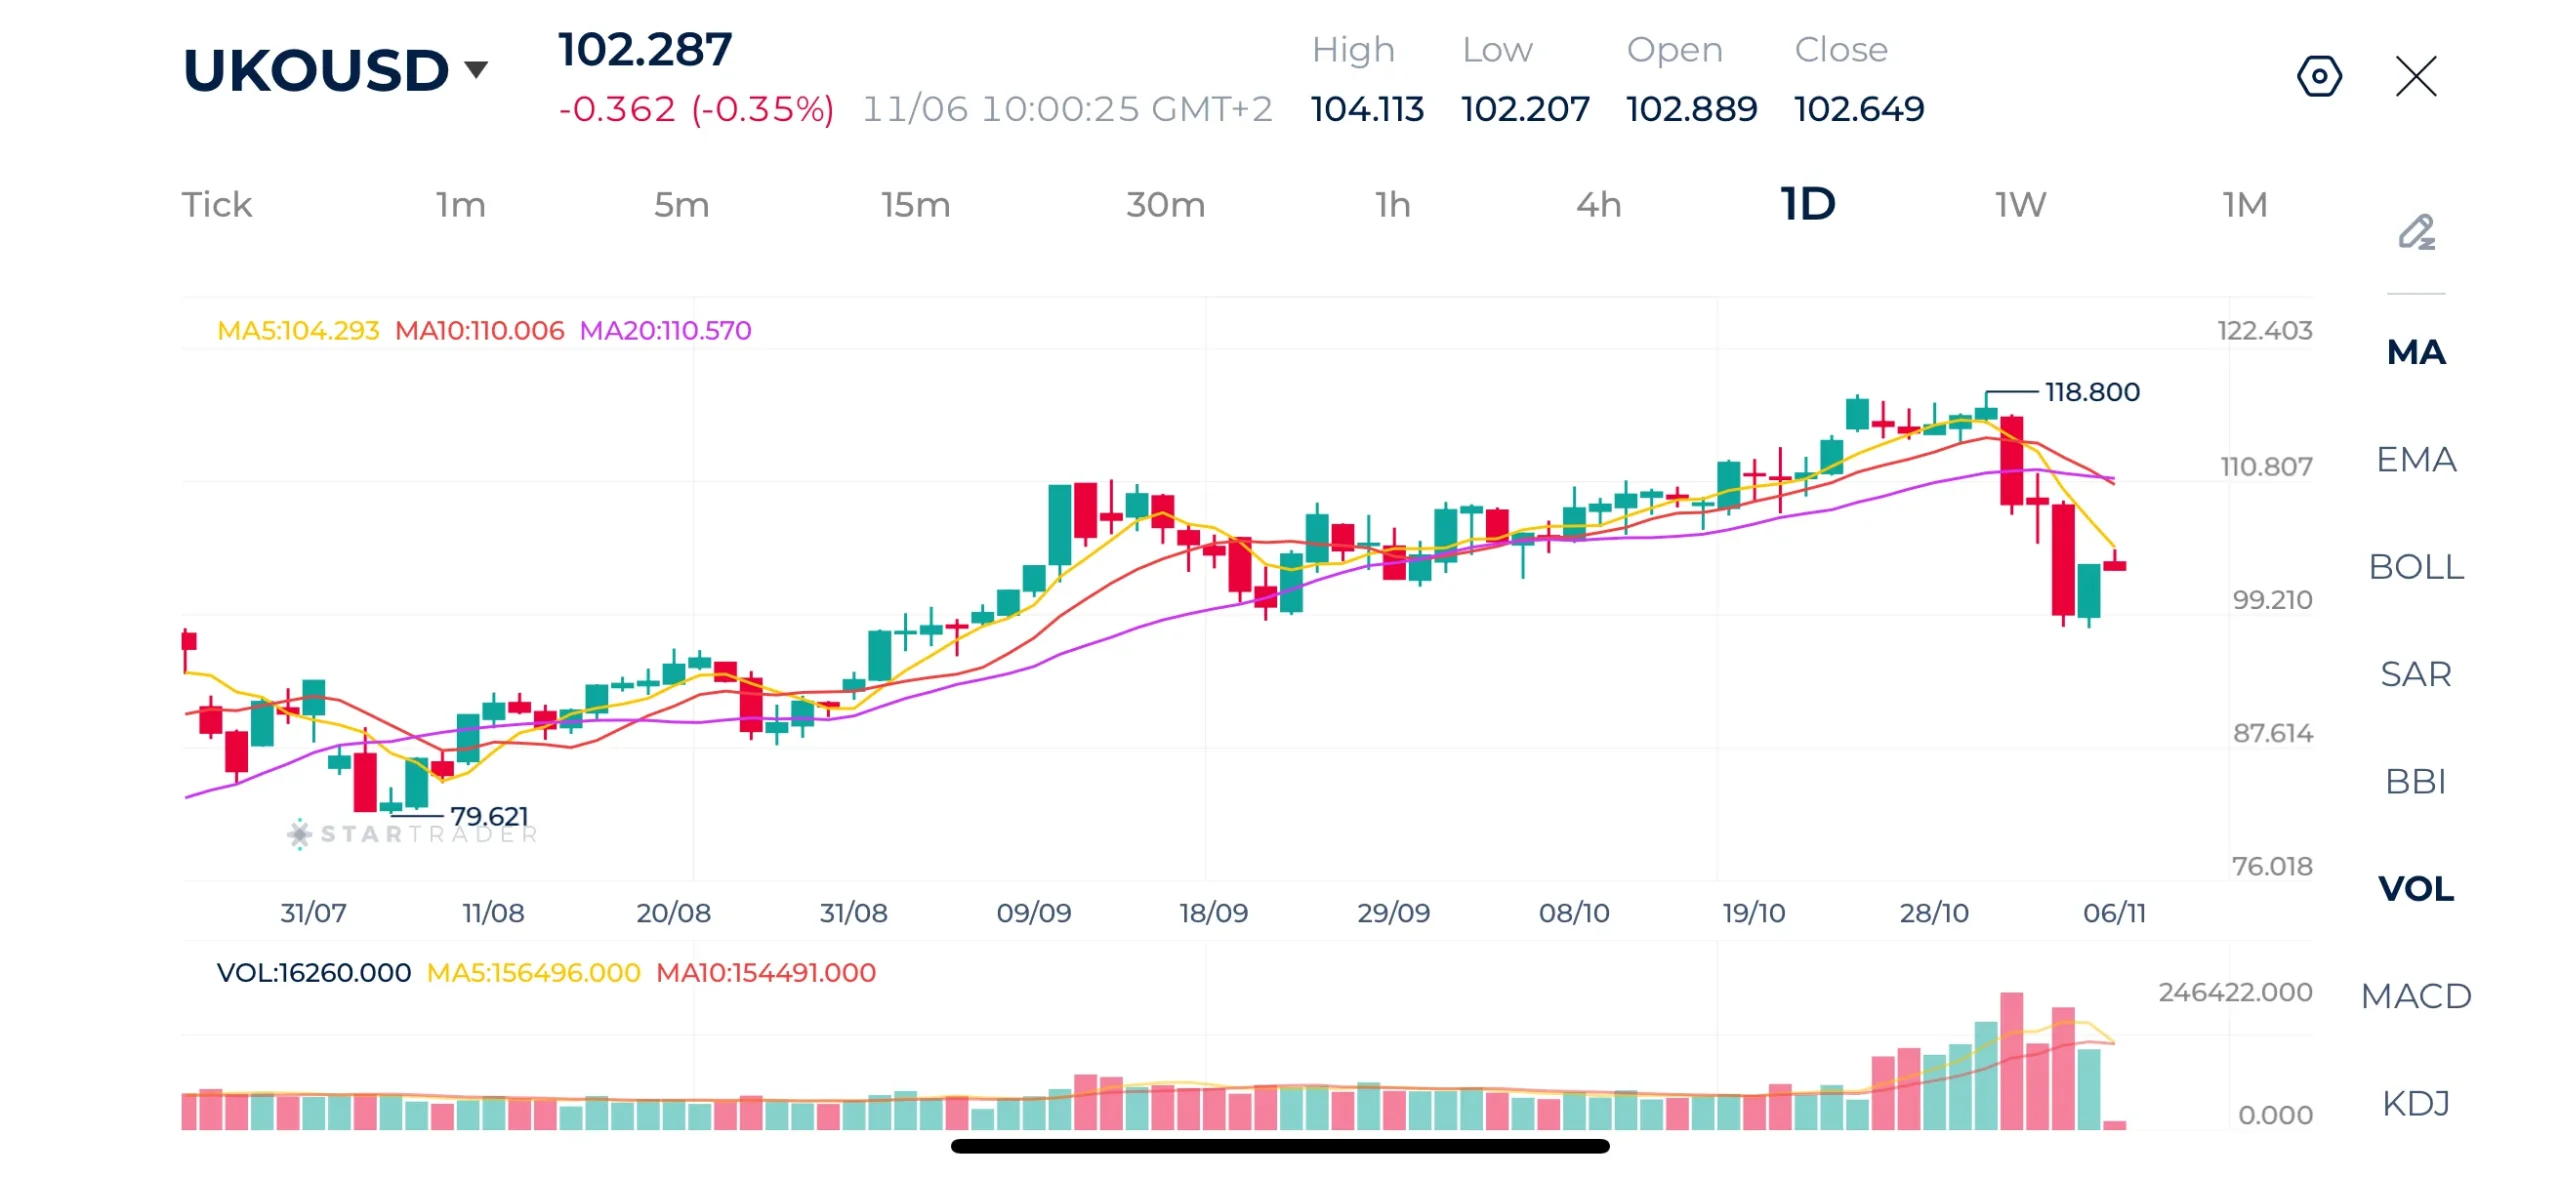
Source: STARTRADER app | Brent crude retreats from recent highs, but remain above $100
| Resistance | $104.20 – $104.35 | $105.66 – $105.80 | $107.28 – $107.40 |
|---|---|---|---|
| Support | $99.00 – $99.20 | $97.54 – $97.65 | $95.31 – $95.40 |
Gold Technical Analysis
Gold remains highly volatile but has shown signs of a strong recovery from its recent correction. After falling to around $3,870, the precious metal rebounded sharply and briefly reached $4,106 before pulling back toward $4,055. Price is currently above the 5-day and 10-day moving averages, but remains slightly below the 20-day moving average. This creates an important technical battle around the $4,060–4,070 area. A sustained break above $4,107 would reinforce the bullish recovery and potentially open the way toward higher levels, while a move back below $4,010 would weaken the recovery and expose the $3,870 low again.
Short term bias: neutral to bullish, with momentum improving but confirmation still needed above $4,107.
Gold Daily Chart
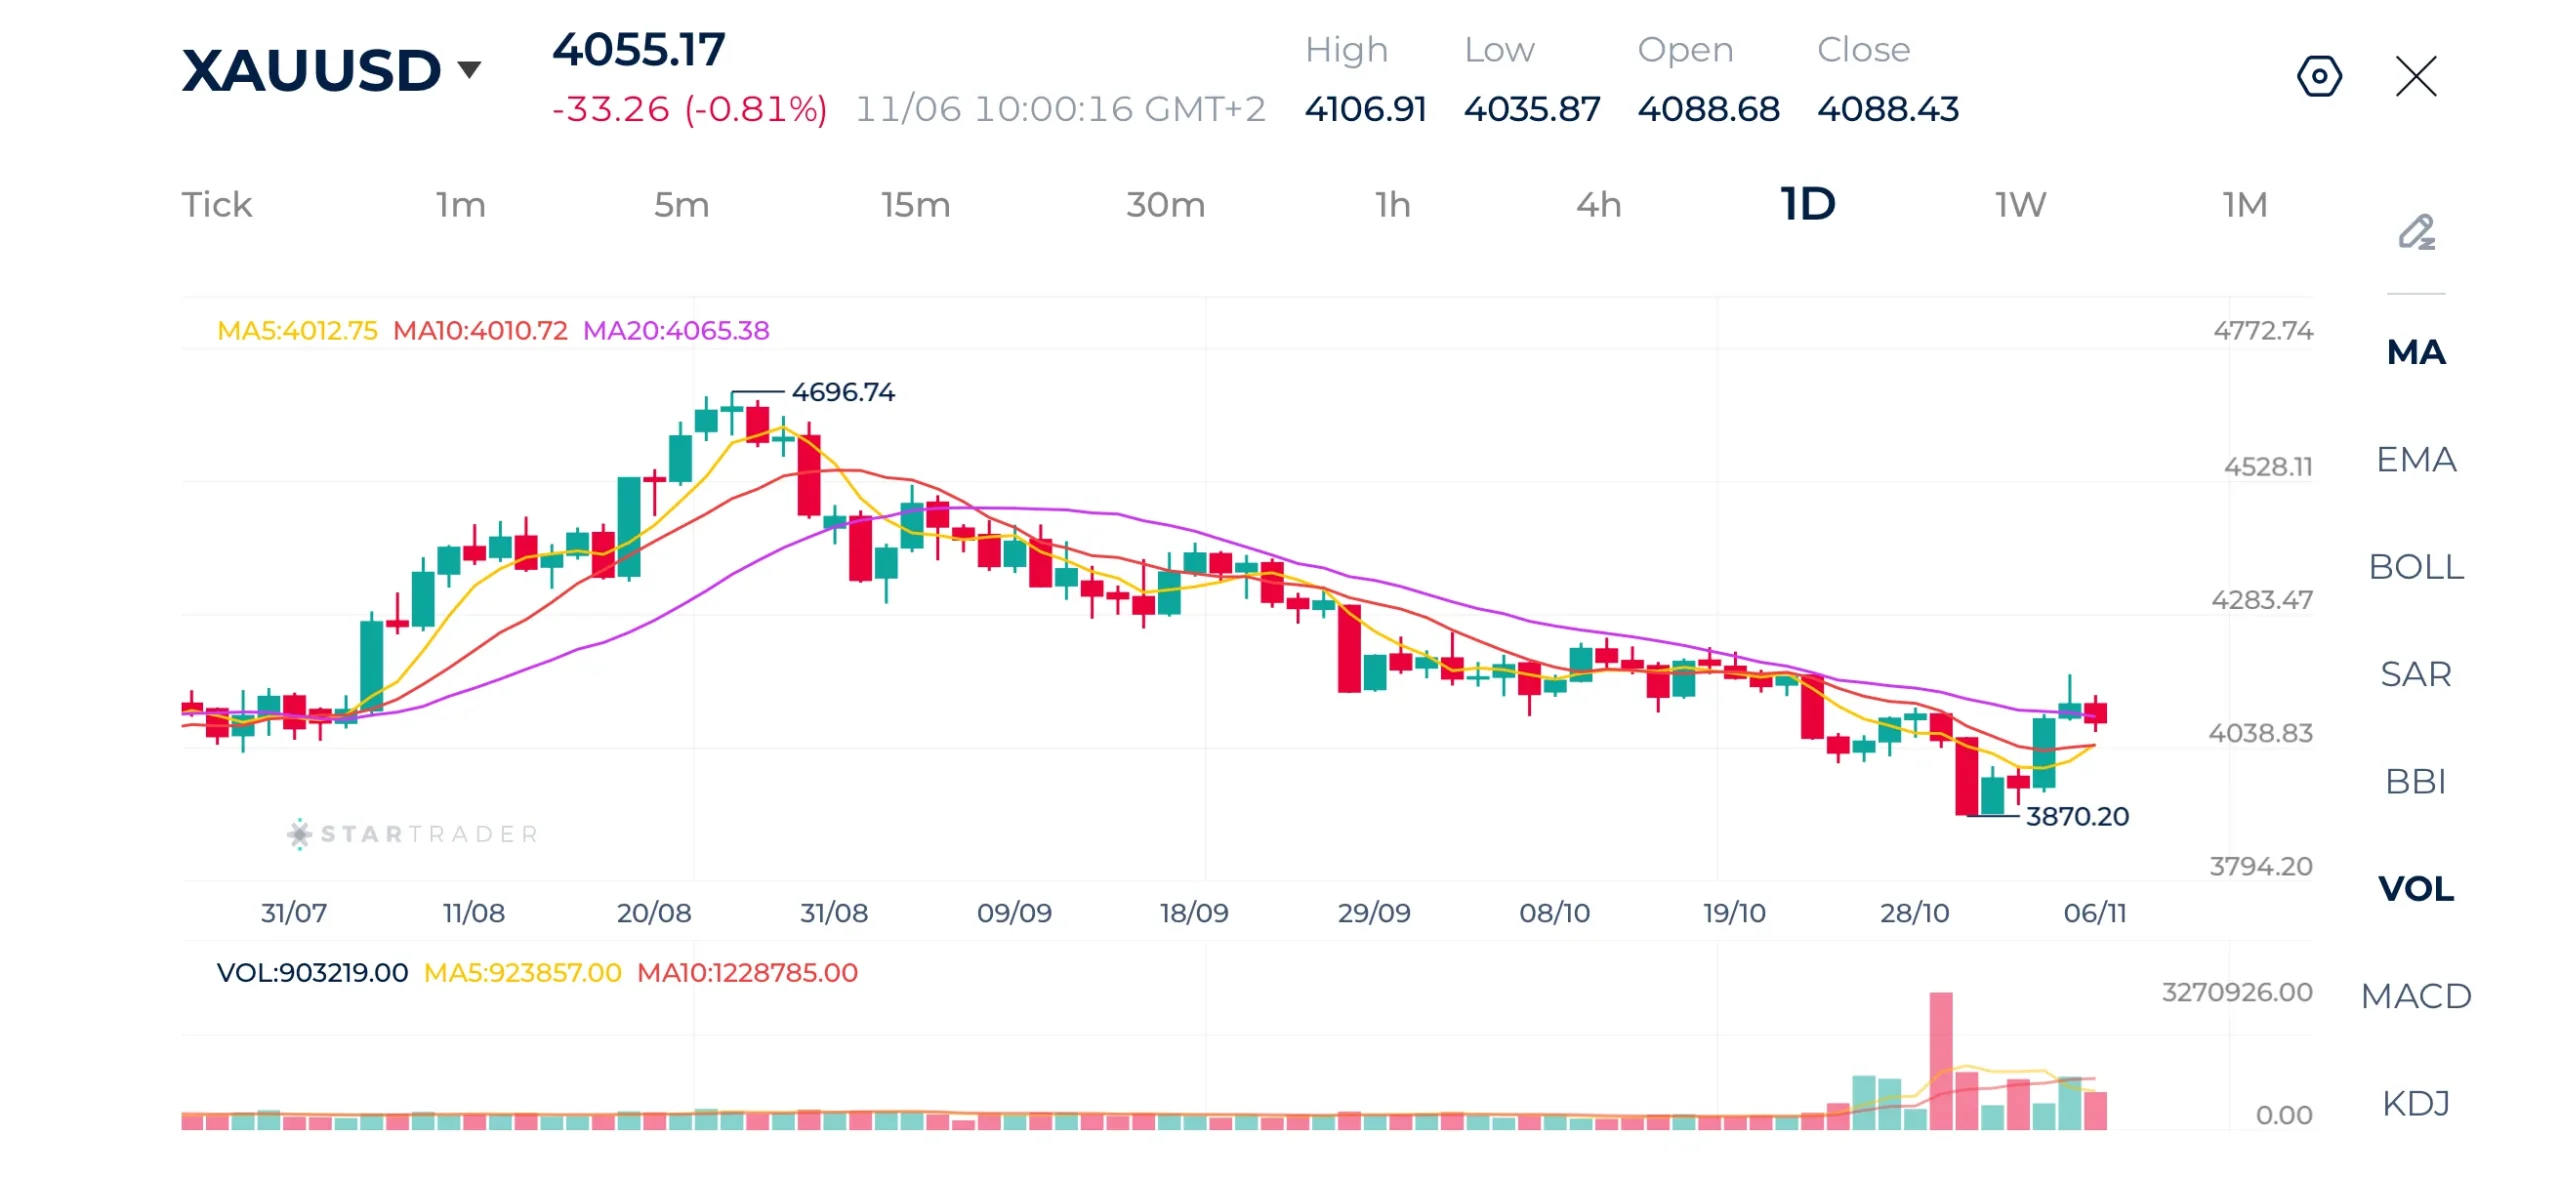
Source: STARTRADER app | Gold prices recover following a steep decline below $4,000 support level
| Resistance | $4,107 – $4,120 | $4,250 – $4,261 | $4,300 – $4,312 |
|---|---|---|---|
| Support | $3,933 – $3,940 | $3,870 – $3,875 | $3,800 – $3,812 |
Risk Disclaimer: This material is provided for informational purposes only and does not constitute a recommendation or investment advice. Trading financial instruments on margin involves substantial risk and may not be appropriate for all investors.
https://open.spotify.com/episode/4BDz2e4RR9mmrZL8F0MldY?si=kjzbW4f2SJKfx0NrYCgXxQ
Tags


Open Live Account
 Email Address
 Phone Number
Important Notice
STARTRADER does not accept any applications from Australian residents.
To comply with regulatory requirements, clicking the button will redirect you to the STARTRADER website operated by STARTRADER PRIME GLOBAL PTY LTD (ABN 65 156 005 668), an authorized Australian Financial Services Licence holder (AFSL no. 421210) regulated by the Australian Securities and Investments Commission.
Important Notice for Residents of the United Arab Emirates
In alignment with local regulatory requirements, individuals residing in the United Arab Emirates are requested to proceed via our dedicated regional platform at startrader.ae, which is operated by STARTRADER Global Financial Consultation & Financial Analysis L.L.C.. This entity is licensed by the UAE Capital Market Authority (CMA) under License No. 20200000241, and is authorised to introduce financial services and promote financial products in the UAE.
Please click the "Continue" button below to be redirected.


