








 Web Trader MT5









Key Takeaways
- U.S. indices entered correction territory early in the week, pressured by rising oil prices and inflation fears.
- Oil prices surged above $110 mid-week following renewed escalation rhetoric from Donald Trump, before stabilizing.
- Gold and silver moved higher overall, but with strong intraday volatility driven by conflicting macro forces.
- The U.S. dollar strengthened sharply, with DXY surpassing the key 100 level, dominating safe haven flows.
- Markets reacted heavily to Trump’s statements on Iran, shifting between de-escalation hopes and renewed conflict fears.
- Global volatility stayed elevated, with markets driven more by geopolitics than fundamentals.
US Stocks and Indices Enter Correction Territory
U.S. equity markets faced significant volatility during the week, with major indices slipping into correction territory, down more than 10% from recent highs, as investors reacted to rising oil prices and inflation risks.
At the start of the week, equities declined sharply as oil surged and geopolitical tensions intensified. Rising energy prices triggered concerns about war-driven inflation, which could delay rate cuts and weigh on corporate margins.
Mid-week, markets attempted to stabilize after temporary optimism around potential de-escalation. However, renewed escalation rhetoric from Trump reversed sentiment, leading to another wave of selling.
Despite some late week recovery attempts, the overall structure remains fragile, with indices struggling as investor confidence weakened.
Oil Market Volatility Continues
Oil was once again the main driver of global markets. Prices traded around $100 early in the week, supported by ongoing supply concerns. Mid-week, WTI surged above $110 and Brent above $106–109, driven by Trump’s statements signaling continued military action.
However, oil also saw sharp intraday reversals, especially when markets briefly priced in de-escalation scenarios or diplomatic developments when Trump hinted an end to the war in the upcoming weeks.
By the end of the week, oil remained elevated but volatile, reflecting persistent geopolitical risks, uncertainty around conflict duration, and sensitivity to political headlines
Gold Rises but Remains Highly Volatile
Gold and silver showed an overall upward bias during اthe week, but with strong two-way volatility.
Gold traded roughly between $4,500–$4,650, rising on safe haven demand but failing to break decisively higher with a strong dollar limiting upside.
Silver followed a similar pattern, showing more volatility due to its industrial component.
Precious metals are stillt struggling to trend strongly due to USD strength.
Major Economic Calendar Events for the Upcoming Week
| Date | Metric | Country | Previous | Time [Dubai] |
| Monday, 6 April | ISM Services PMI | USA | 56.1 | 6:00 PM |
| Tuesday, 7 April | Durable Goods Orders m/m | USA | 0.00% | 4:30 PM |
| Tuesday, 7 April | Ivey PMI | Canada | 56.6 | 6:00 PM |
| Wednesday, 8 April | Interest Rate Decision | New Zealand | 2.25% | 6:00 AM |
| Wednesday, 8 April | FOMC Meeting Minutes | USA | 10:00 PM | |
| Thursday, 9 April | Core PCE Price Index m/m | USA | 0.40% | 4:30 PM |
| Thursday, 9 April | Final GDP q/q | USA | 0.70% | 4:30 PM |
| Friday, 10 April | Unemployment Rate | Canada | 6.70% | 4:30 PM |
| Friday, 10 April | Consumer Price Index y/y | USA | 2.40% | 4:30 PM |
Technical Analysis and Forecast:
Brent Technical Analysis
Brent crude ends the week around $112 a barrel. Price action on the daily timeframe remains in a strong bullish trend following an aggressive breakout move.
Price continues to hold above all major moving averages, which are well aligned to the upside, confirming sustained bullish momentum. The current consolidation appears healthy so far.
As long as price remains above the $108–$106 support zone, the bullish outlook remains intact. A break below $106, however, could signal a deeper correction toward the $100–&102 region before the trend resumes.
Brent Daily Chart
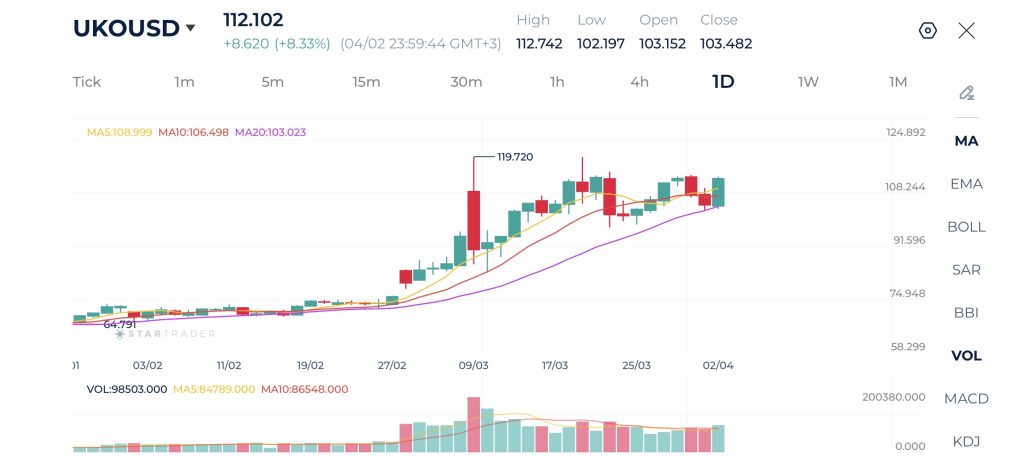
| Resistance | $109.82 $110.00 | $112.55 – $112.80 | $114.75 – $115.00 |
| Support | $106.20 – $106.45 | $104.80 – $105.00 | $102.10 $102.35 |
Gold Technical Analysis
After an overall positive week, gold settled around $4,700 level. Price is still in a largely corrective trend though. The 20-day moving average has crossed below the 50-day average, and price is trading below both, confirming bearish momentum in the short and medium term.
Despite a recent bounce from the $4,100 area, the recovery appears corrective, with price now struggling near resistance around $4,800. If sellers maintain control below this level, the market could revisit $4,400 and potentially retest the $4,100 lows. However, a sustained move above $4,850–$4,900 would signal a shift back toward bullish continuation.
Gold Daily Chart
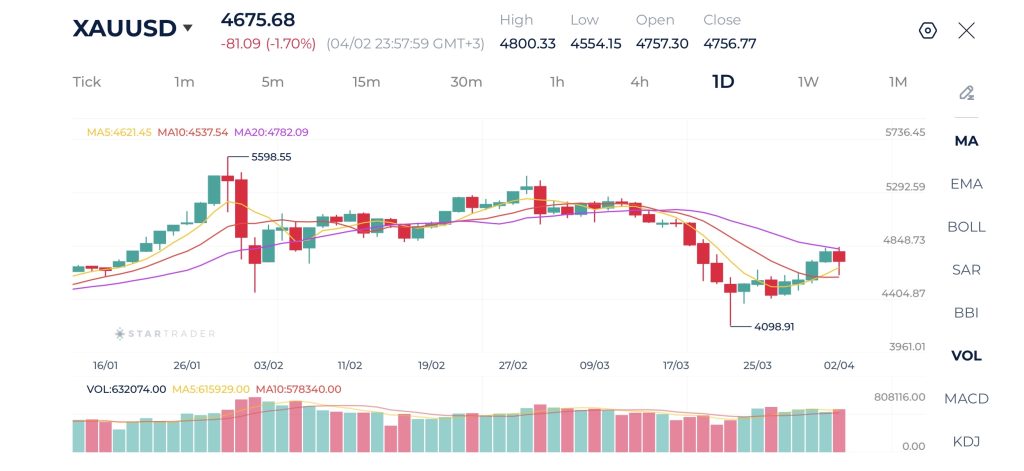
| Resistance | $4,920 – $4,940 | $5,160 – $5,175 | $5,300 – $5,326 |
| Support | $4,500 – $4,520 | $4,380 – $4,400 | $4,120 $4,155 |
Dow Jones Technical Analysis
Dow Jones is trading around 46,500 level and continues to exhibit a broader corrective structure. The daily chart shows a clear downtrend with consistent lower highs and lower lows, supported by bearish alignment of moving averages, as price remains below the 50 and 100 moving averages. The recent rebound from 44,845 suggests a temporary relief rally, but price action remains capped below the 47,000–47,500 resistance zone.
The inability to break above this area reinforces the bearish bias. If downside pressure resumes, the next key support lies around 44,800, and a break below it could accelerate losses further. A confirmed breakout above 47,500 would be required to invalidate the bearish structure and shift momentum back to the upside.
Dow Jones Daily Chart
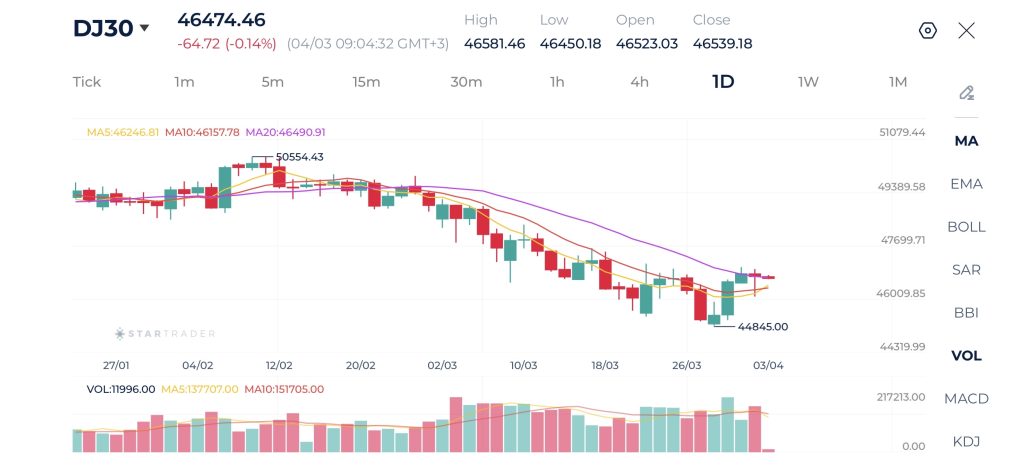
| Resistance | 47,520 – 47,554 | 48,781 – 48,833 | 49,360 – 49,381 |
| Support | 44,845 – 44,866 | 43,967 – 4,400 | 41,622 – 41,684 |
US Dollar Index (DXY) Technical Analysis
The US Dollar Index shows strong price action with a steady rise. Price is forming higher lows and pushing beyond the psychological 100.00 level. Moving averages are beginning to align bullishly, with price holding above the 20 and 50 MAs, while the 100 MA is flattening, suggesting improving medium term sentiment.
However, the recent rejection near 100.50 indicates that sellers are still active at higher levels, preventing a clean breakout. As long as price remains above the 99.00–99.30 support zone, the bullish structure remains intact, and another attempt to break above 100.50 could open the door toward 101.00. A failure to hold above support, however, would shift momentum back into consolidation or a deeper pullback.
DXY Daily Chart
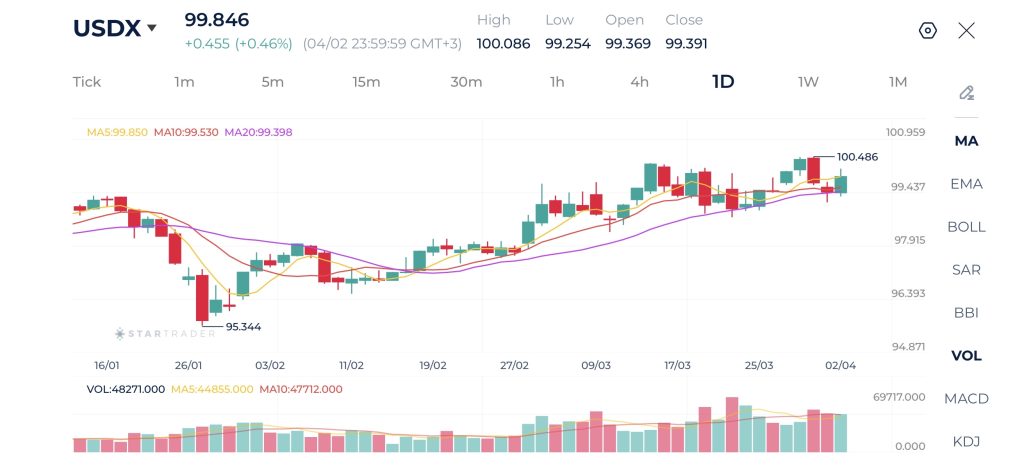
| Resistance | 100.50 – 100.58 | 101.86 – 102.00 | 102.85 – 103.00 |
| Support | 99.20 – 99.34 | 98.00 – 98.16 | 96.35 – 96.61 |
Risk Disclaimer: This material is provided for informational purposes only and does not constitute a recommendation or investment advice. Trading financial instruments on margin involves substantial risk and may not be appropriate for all investors.
Tags


Open Live Account
 Email Address
 Phone Number
Important Notice
STARTRADER does not accept any applications from Australian residents.
To comply with regulatory requirements, clicking the button will redirect you to the STARTRADER website operated by STARTRADER PRIME GLOBAL PTY LTD (ABN 65 156 005 668), an authorized Australian Financial Services Licence holder (AFSL no. 421210) regulated by the Australian Securities and Investments Commission.
Important Notice for Residents of the United Arab Emirates
In alignment with local regulatory requirements, individuals residing in the United Arab Emirates are requested to proceed via our dedicated regional platform at startrader.ae, which is operated by STARTRADER Global Financial Consultation & Financial Analysis L.L.C.. This entity is licensed by the UAE Capital Market Authority (CMA) under License No. 20200000241, and is authorised to introduce financial services and promote financial products in the UAE.
Please click the "Continue" button below to be redirected.


