








 Web Trader MT5









Key Takeaways
- Oil prices fluctuated sharply as escalating U.S.–Iran tensions and low inventories in the US. raised supply disruption fears
- Cryptocurrencies suffered a major sell-off, with Bitcoin falling below $60,000 and Ethereum breaking under $2,000, marking one of the worst weeks of the year for digital assets.
- Gold and silver declined sharply, ending a multi-week rally as profit taking accelerated and volatility spiked across commodities.
- U.S. equity markets sold off, with major indices declining for the week amid risk-off sentiment and earnings driven volatility.
- Technology stocks came under pressure, led by reactions to Alphabet’s earnings and broader valuation concerns.
- Global risk appetite deteriorated, triggering capital rotation out of high beta assets into cash and defensive positioning.
Precious Metals Experience Sharp Decline and High Volatility
Precious metals experienced a volatile and corrective week after reaching record highs in January. Gold declined approximately 1.4%, falling from near $4,900 at the start of the week to around $4,400, as investors locked in profits and reduced exposure amid broader market stress. The precious metal later settled around the $4,800 level.
Silver underperformed gold, dropping roughly 10% on the week to trade near $70.20, after previously trading below $65. Silver’s dual role as both a safe-haven and industrial metal amplified volatility, making it more vulnerable during he sell-off.
Copper also suffered selling pressure during the week as it fell below the $6 market and ended the wek around $5.8 per pound.
Heavy Sell-Off in the Crypto Market Drags Bitcoin Below $60,000
The cryptocurrency market saw massive style selling during the week. Bitcoin plunged below $60,000, reaching lows near $59,997, and ending the week down approximately 15%.
Ethereum broke below the key $2,000 level, falling to around $1,747, marking a weekly loss of nearly 16%. The sell-off was driven by deteriorating risk sentiment, declining liquidity expectations, and forced liquidations across derivatives markets.
Altcoins suffered even steeper losses, with several major tokens down 15–25% on the week. Overall crypto market capitalization dropped by roughly 14%, reaching as los as $2.05 trillion, highlighting the sector’s sensitivity to macro driven risk aversion.
U.S. Indices Retreat on Software Concerns
U.S. stock markets ended the week firmly lower, pressured by global risk-off sentiment and earnings volatility. The S&P 500 declined about -2.3%, while the Nasdaq Composite fell roughly -3.1%, reflecting heavy selling in technology stocks.
The Dow Jones Industrial Average lost around 1.8%, supported modestly by defensive sectors such as healthcare and consumer staples. Market breadth weakened notably, signaling broad-based selling rather than isolated sector moves.
Alphabet’s earnings were a focal point, triggering sharp intraday volatility in tech stocks. While revenue beat expectations, large CapEx planned for 2026 and margin concerns weighed on sentiment, contributing to renewed pressure on the broader technology and AI complex.
Geopolitics and Inventories Numbers Caused Mixed Sentiment on Oil
Oil prices were highly volatile throughout the week. WTI crude initially surged above $65.22 per barrel, driven by heightened U.S.–Iran tensions and fears of supply disruptions in the Middle East.
However, gains proved short lived. Prices retreated to below $61 per barrel after U.S. Crude inventory data showed a decline of approximately 3.5 million barrels, raising immediate supply concerns.
By the end of the week, Brent finished marginally higher around 1% to $68.00.
Key Economic Data of the week
- ISM Manufacturing PMI in the US rose above 50 for the first time in 12 months as it hit 52.6 in January.
- Reserve Bank of Australia raised interest rates by 25 basis points to 3.85% in line with expectations.
- The unemployment rate in New Zealand rose to 5.4% in the fourth quarter of 2025.
- ADP Non-Farm Employment Change showed an increase of 22K jobs only in January, lower than market expectations of 46K jobs.
- ISM Services PMI in the US fell to 53.8 in January from 54.4 in December.
- Bank of England kept its official bank rate at 3.75% as expected.
- The European Central Bank maintained its policy rate at 2.15% in line with expectations.
- US JOLTS Job Openings fall to 6.54m last December.
Major Economic Calendar Events for the Upcoming Week
| Date | Metric | Country | Previous | Time [Dubai] |
| Monday, 9 February | Current Account | Japan | 3.14T | 3:50 AM |
| Tuesday, 10 February | Retail Sales m/m | USA | 0.60% | 5:30 PM |
| Tuesday, 10 February | JOLTS Job Openings | USA | 7.15m | Tentative |
| Wednesday, 11 February | Non-Farm Payrolls | USA | 5:30 PM | |
| Thursday, 12 February | Gross Domestic Product m/m | UK | 0.30% | 11:00 AM |
| Thursday, 12 February | Unemployment Claims | USA | 5:30 PM | |
| Friday, 13 February | Consumer Price Index y/y | USA | 2.70% | 5:30 PM |
Technical Analysis and Forecast:
Gold Technical Analysis
Gold remains in an overall long term bullish trend, but the latest price action signals an aggressive correction after the parabolic move toward $5,600. The rejection from that high produced a sharp pullback, yet price is still holding well above prior major breakout levels, which keeps the broader bullish structure intact.
The moving averages remain positively stacked, with the 30-day moving average trending upward and price still trading above it. As long as gold holds above the 30-day moving average, the trend remains bullish.
Momentum shows short-term weakness but no trend failure. The MACD has crossed lower and turned negative, reflecting the depth of the correction, but it is still far from the extreme negative readings seen in past bearish reversals. This supports the idea that gold is digesting gains, not entering a bear market. A bullish continuation would be reinforced by MACD flattening and turning higher above key support zones.
Gold Daily Chart
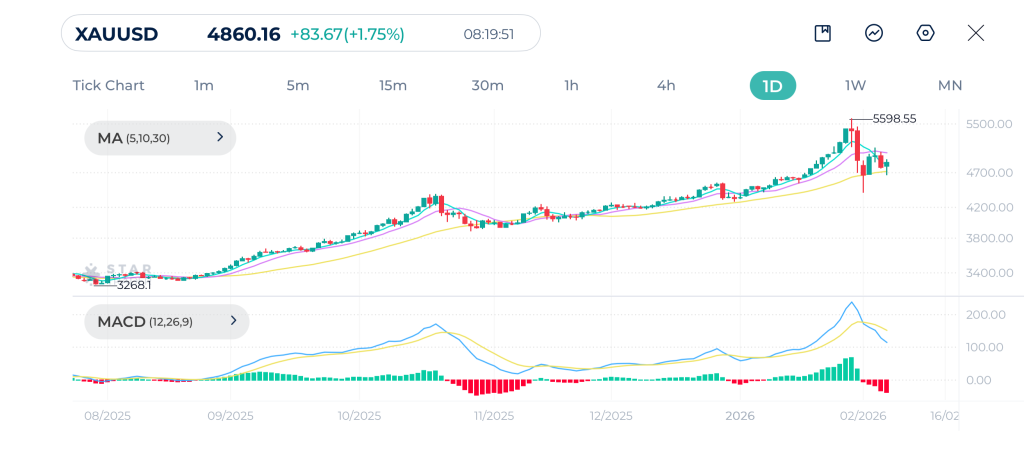
| Resistance | $5,080 – $5,093 | $5,183 – $5,200 | $5,215 – $5,231 |
| Support | $4,650- $4,654 | $4,520 – $4,528 | $4,405 – $4,416 |
S&P 500 Technical Analysis
The S&P 500 remains in a dominant long term uptrend, but recent price action shows signs of trend fatigue near the 7017 resistance zone. Multiple rejections from this level indicate that buyers are struggling to sustain momentum at higher prices, increasing the probability of consolidation or a deeper pullback.
From a moving average standpoint, the trend is still technically bullish, as price remains above the 30-day moving average However, the flattening of the 5 and 10 MAs suggests a loss of upside acceleration. If price fails to hold above the 30-day moving average, this would be the first meaningful warning of a broader corrective phase on the daily chart.
The MACD reinforces this cautious tone. Momentum has rolled over and is hovering near the zero line, showing that bullish momentum is weakening but not yet reversed. This setup typically precedes either a sideways consolidation or a corrective move.
S&P 500 Daily Chart
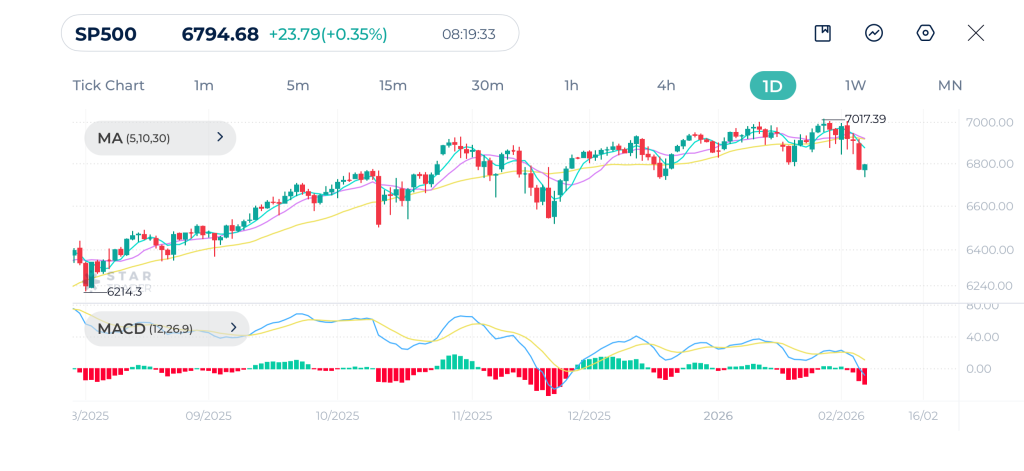
| Resistance | 6,854 – 6,861 | 6,918 – 6,921 | 6,951 – 6,962 |
| Support | 6,720 – 6,731 | 6,670 – 6,675 | 6,612 – 6,630 |
Bitcoin Technical Analysis
Bitcoin is still trading within a clear medium term downtrend, despite the strong rebound from the $60,000 support zone. The recent bullish candle is impulsive, but structurally it remains a reactionary bounce after a sharp sell-off. Price is still well below the previous major highs and has not reclaimed any broken bullish structure on the daily chart.
From a moving average perspective, bitcoin remains bearishly aligned. The daily moving averages MA(5) and MA(10) have started to curl higher, but price is still trading below the 30-day moving average, which continues to slope downward and act as dynamic resistance. Until Bitcoin can close multiple daily candles above the 30-day moving average, this recovery should be treated as a corrective rally within a broader bearish phase.
Momentum supports this cautious view. The MACD remains deeply negative, with no bullish crossover yet. Although downside momentum is slowing, sellers are losing strength but have not fully lost control. A confirmed bullish shift would require a MACD crossover accompanied by price reclaiming the 30-day moving average.
Bitcoin Daily Chart
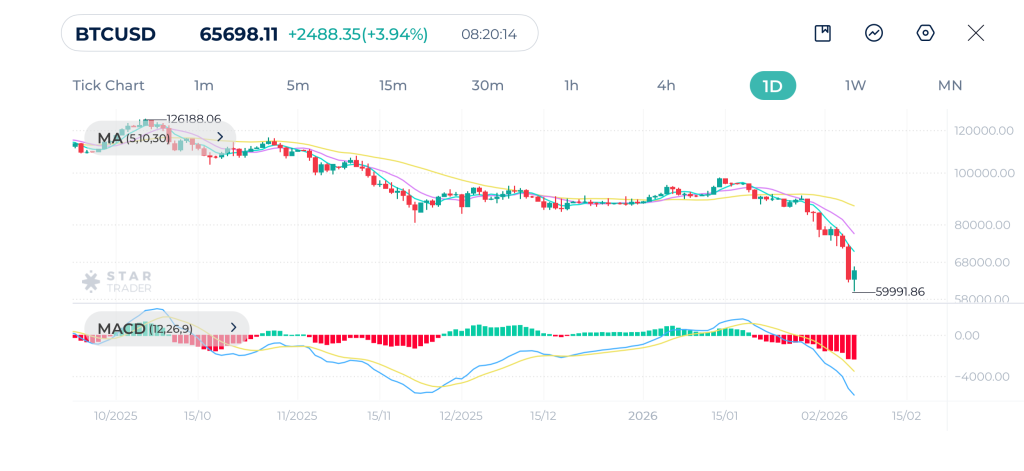
| Resistance | $68,210 – $68,312 | $72,316 – $72,400 | $76,391 – $76,405 |
| Support | $60,057 – $60,128 | $57,362 – $57,410 | $55,272 – $55,310 |
Brent Technical Analysis
Brent crude has transitioned from a prolonged consolidation into a clear bullish expansion phase. The strong rebound from the $59 support area marked a structural shift, and the subsequent rally toward $71 confirms a sequence of higher highs and higher lows, which defines a bullish daily trend.
The moving average structure is clearly supportive. Price is trading above all three moving averages, with the shorter moving averages MA(5) and MA(10) leading higher. This alignment indicates strong trend participation.
Momentum strongly confirms the move. The MACD has crossed into positive territory, signaling accelerating bullish momentum. There are no divergence warnings at this stage, which suggests that oil still has room to extend higher before facing meaningful exhaustion.
Brent Daily Chart
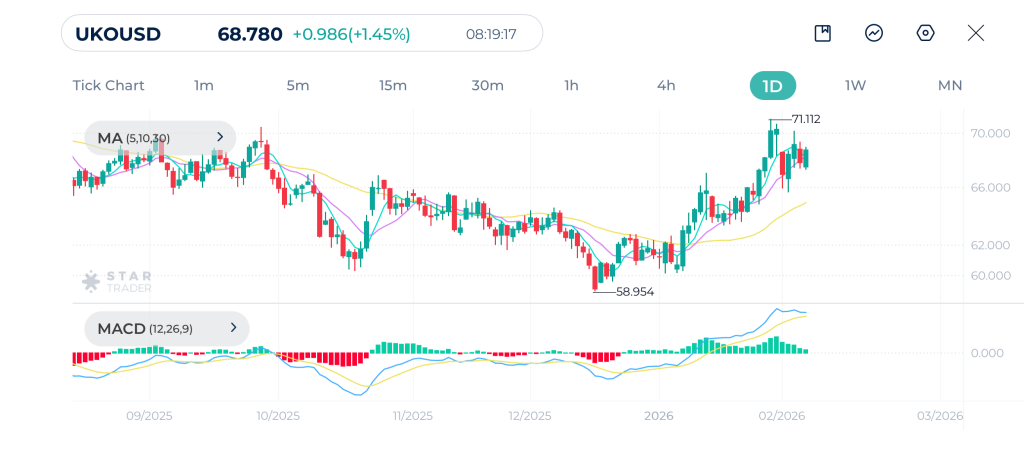
| Resistance | $69.53 – $69.61 | $70.05 – $70.21 | $71.75 – $71.82 |
| Support | $66.65 – $66.71 | $65.20 – $65.33 | $64.19 – $64.26 |
Tags


Open Live Account
 Email Address
 Phone Number
Important Notice
STARTRADER does not accept any applications from Australian residents.
To comply with regulatory requirements, clicking the button will redirect you to the STARTRADER website operated by STARTRADER PRIME GLOBAL PTY LTD (ABN 65 156 005 668), an authorized Australian Financial Services Licence holder (AFSL no. 421210) regulated by the Australian Securities and Investments Commission.
Important Notice for Residents of the United Arab Emirates
In alignment with local regulatory requirements, individuals residing in the United Arab Emirates are requested to proceed via our dedicated regional platform at startrader.ae, which is operated by STARTRADER Global Financial Consultation & Financial Analysis L.L.C.. This entity is licensed by the UAE Capital Market Authority (CMA) under License No. 20200000241, and is authorised to introduce financial services and promote financial products in the UAE.
Please click the "Continue" button below to be redirected.


