


Brent Technical Analysis
Brent crude suffered a sharp selloff last week from $101.11 to $87.28, then staged a strong rebound back toward $96.00. This suggests panic selling has eased, but price is now pausing near resistance after the recovery leg. Price is trading around moving averages MA5 and MA10, while the MA20 is below current price, indicating the market is trying to stabilize.
Immediate resistance stands at $96.00–$96.50. A breakout above this zone could trigger further upside toward $98.30 and possibly $101.10. Support is found at $94.20, then $92.00, with stronger support at $87.28. Momentum has improved, but confirmation of a bullish reversal requires a clear break above current resistance.
Brent 1H Chart
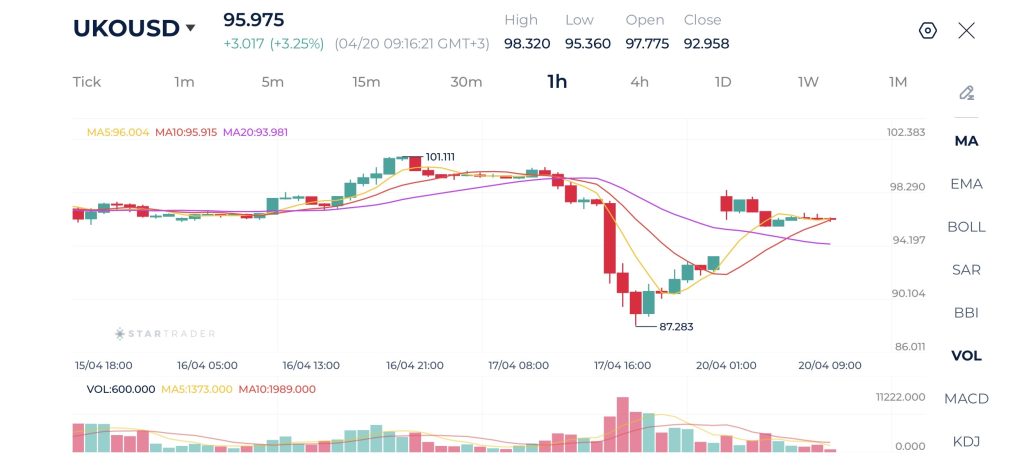
| Resistance | $96.00 | $98.30 | $101.10 |
| Support | $94.20 | $92.50 | $87.30 |
Gold Technical Analysis
Gold has entered a corrective phase on the 1H chart after failing to hold the breakout above $4,850 and rejecting sharply from $4,889. Price dropped to 4,737 before rebounding, but the bounce has so far been modest. It is trading below the moving average MA20 4,820 and around the averages MA5 and MA10, suggesting recovery momentum remains limited.
Immediate resistance is located at $4,800–$4,820. A clean move above that zone would improve sentiment and allow another test of $4,858, then $4,889. Support is seen at $4,768, followed by the key low at $4,737. If sellers break below $4,737, downside pressure could accelerate. Current bias is neutral-to-bearish while price remains below the MA20.
Gold 1H Chart
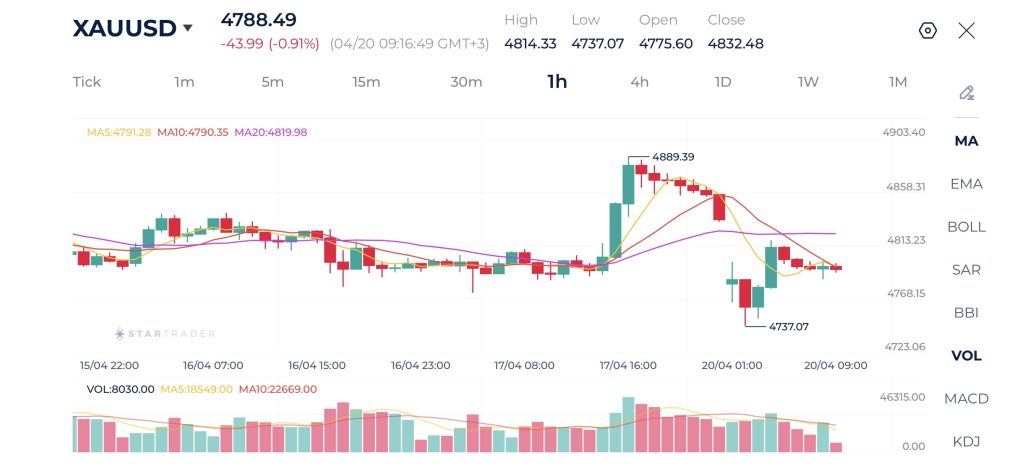
| Resistance | $4,814 | $4,872 | $4,900 |
| Support | $4,766 | $4,737 | $4,706 |
Bitcoin Technical Analysis
Bitcoin on the 1H chart is under pressure after failing to sustain moves above the $75,600–$76,000 area. Price has rolled over from the $77,602 swing high and recently printed a lower low near $73,710, confirming short-term bearish structure. It is now trading below the moving average MA20 $74,834 while MA5 and MA10 remain under pressure, showing momentum is still soft.
The immediate resistance zone is $74,500–$74,850, where price is currently struggling near the moving averages. A recovery above this area could open the way toward $75,650, then $76,800. On the downside, support sits at $73,710, followed by $73,350. If that floor breaks, sellers could target a deeper retracement. For now, the short-term bias is bearish-to-neutral unless bulls reclaim the MA20 and previous lower highs.
Bitcoin 1H Chart
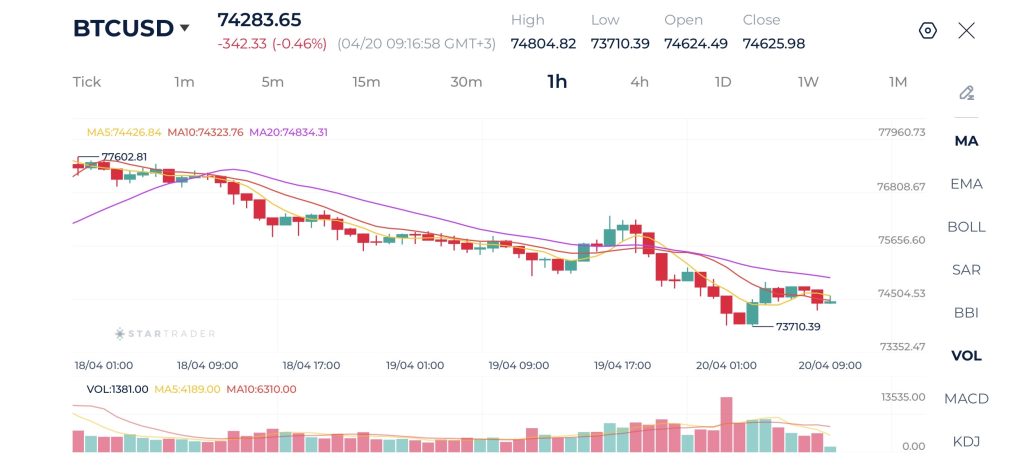
| Resistance | $75,465 | $76,230 | $76,950 |
| Support | $73,777 | $72,563 | $71,480 |
Risk Disclaimer: This material is provided for informational purposes only and does not constitute a recommendation or investment advice. Trading financial instruments on margin involves substantial risk and may not be appropriate for all investors.
Tags
Open Live Account
Please enter a valid country
No results found
No results found
Please enter a valid email
Please enter a valid verification code
1. 8-16 characters + numbers (0-9) 2. blend of letters (A-Z, a-z) 3. special characters (e.g, !a#S%^&)
Please enter the correct format
Please tick the checkbox to proceed
Please tick the checkbox to proceed
Important Notice
STARTRADER does not accept any applications from Australian residents.
To comply with regulatory requirements, clicking the button will redirect you to the STARTRADER website operated by STARTRADER PRIME GLOBAL PTY LTD (ABN 65 156 005 668), an authorized Australian Financial Services Licence holder (AFSL no. 421210) regulated by the Australian Securities and Investments Commission.
CONTINUEImportant Notice for Residents of the United Arab Emirates
In alignment with local regulatory requirements, individuals residing in the United Arab Emirates are requested to proceed via our dedicated regional platform at startrader.ae, which is operated by STARTRADER Global Financial Consultation & Financial Analysis L.L.C.. This entity is licensed by the UAE Capital Market Authority (CMA) under License No. 20200000241, and is authorised to introduce financial services and promote financial products in the UAE.
Please click the "Continue" button below to be redirected.
CONTINUEError! Please try again.

