








 Web Trader MT5









Key Takeaways
- U.S. Market correction deepens amid caution over stretched valuations, especially in tech and AI companies.
- The U.S. dollar index (DXY) recaptures 100.00 level, driven by softer rate-cut expectations and hawkish signals from the Fed minutes.
- The Fed’s October meeting minutes revealed division among policymakers, reducing odds of a December rate cut.
- The delayed September NFP jobs report showed a rise of 119,000 jobs, with unemployment rising to 4.4%.
- The crypto market weakened. Bitcoin fell below $90,000, while Ethereum slipped below $3,000.
- Precious metals were under pressure. Gold remained elevated but trimmed gains amid dollar strength, and silver also pulled back.
U.S. Stock Market
US equities fell even further this week amid growing caution around valuation levels and how clear the growth outlook remains. The S&P 500, Dow Jones, and Nasdaq 100 slipped over the period as investor focus shifted from growth hopes to caution. Technology and AI-linked stocks, which had driven much of the year’s advance, came under pressure as investors questioned the sustainability of sales and earnings growth in such companies. Market breadth deteriorated and some large-cap names pulled back.
Nvidia’s blow-out Q3 earnings with latest report showing $57 billion in revenue, up 62% year-over-year, and adjusted EPS of $1.30, provided a sharp boost to investor sentiment across tech and growth sectors. This performance reignited the AI growth narrative that had been under pressure amid valuation concerns. As a result, Nvidia shares jumped 5% in after-hours trading, but later gave away all of these gains.
Overall for the week, Dow Jones declined 2.7% to 45,817. Nasdaq fell more than 4% to 24,044, and the S&P500 lost 2.8% to end the week at around 6,554
The dollar index jumps above 100.00 as expectations of a rate cut ease
The U.S. dollar index rose during the week, reaching near 100.36 as traders recalibrated their expectations of future monetary policy. The strengthening dollar reflected diminished odds of a Fed rate cut in December following the release of the Fed’s October meeting minutes on 19 November. The minutes showed several policymakers opposed further reducing rates amid inflation and labour-market risks, signaling that the easing path may not be as smooth as many expected.
Meanwhile, the long-delayed September non-farm payrolls report finally arrived and revealed a net gain of 119,000 jobs, beating expectations of 53,000, while the unemployment rate ticked up to 4.4%. Although the number was modest, it reinforced the message of a still-resilient labour market, reducing pressure on the Fed to cut rates. The combination of hawkish minutes and solid jobs data reinforced dollar strength and weighed on risk assets, notably growth stocks and precious metals.
Crypto under selling pressure. Gold and Silver fluctuate
Risk assets beyond equities also reflected the shift in sentiment. On the crypto front, Bitcoin fell below $90,000 for the first time in seven months, evern reaching around $82,000 levels and wiping out much of its 2025 gains. Ethereum dropped to about $2,700, as a combination of reduced speculative appetite and institutional outflows weighed on crypto sentiment. Crypto-related equities and ETFs saw sharp outflows, raising concerns about contagion and risk rotation.
In the precious-metals space, gold saw its appeal tempered by the firmer dollar and declining expectations for rate cuts, with spot gold near $4,062 early in the week. Silver, meanwhile, rose modestly but lacked a strong breakout as risk sentiment weighed on industrial demand. With the dollar rallying, gold and silver faced headwinds despite their safe-haven status.
The confluence of a resilient dollar, cautious monetary policy, and slipping risk assets set the stage for a week of consolidation. While gold and crypto had been benefitting from earlier rate-cut hopes and risk-on flows, this week underscored how quickly sentiment can turn when those fundamentals are questioned.
Key Economic Data of the week
- Canadain CPI numbers remain steady at 2.7% on a yearly basis, slightly below expectations of 2.8%
- The Empire State Manufacturing Index jumps unexpectedly to 18.7, compared with 10.7 in the prior reading.
- CPI inflation falls to 3.6% in the UK for the month of October, from 3.8% in September
- Non-farm payrolls surprise the markets with 119K increase in September, versus expectations of 53K
Major Economic Calendar Events for the Upcoming Week
| Date | Metric | Country | Previous | Time [Dubai] |
| Monday, 24 November | German IFO Business Climate | Euro | 88.4 | 1:00 PM |
| Tuesday, 25 November | Producer Price Index | USA | 5:30 PM | |
| Tuesday, 25 November | Richmond Manufacturing Index | USA | 7:00 PM | |
| Wednesday, 26 November | Consumer Price Index | Australia | 3.50% | 4:30 AM |
| Wednesday, 26 November | Interest Rate Decision | New Zealand | 2.50% | 5:00 PM |
| Wednesday, 26 November | Preliminary GDP | USA | 5:30 PM | |
| Wednesday, 26 November | Unemployment Claims | USA | 5:30 PM | |
| Wednesday, 26 November | Core PCE Price Index m/m | USA | 7:00 PM | |
| Wednesday, 26 November | New Home Sales | USA | 7:00 PM | |
| Thursday, 27 November | Retail Sales q/q | New Zealand | 0.50% | 1:45 AM |
| Friday, 28 November | Tokyo Core CPI y/y | Japan | 2.80% | 3:30 AM |
| Friday, 28 November | Gross Domestic Product m/m | Canada | -0.30% | 5:30 PM |
Technical Analysis and Forecast:
Nasdaq Technical Analysis
Nasdaq 100 continues to trade under clear downside pressure after breaking below the short-term moving averages (5, 10, and 30). The rejection from the 26,289 high marked the beginning of the pullback, and since then, the index has formed a series of lower highs and lower lows, confirming a shift from bullish momentum to a corrective phase.
The candles show that sellers are still in control despite today’s small bounce. The price is now hovering around the 24,200–24,500 zone, which acted as a support area before and is currently being retested.
MACD further validates this negative sentiment, as the MACD line has crossed strongly below the signal line. This indicates increasing bearish momentum and suggests that the index may remain pressured in the short term.
If price manages to hold above the 24,000–24,200 support region, a technical rebound toward the 25,000 psychological level could follow. But a breakdown below this zone would open the door for a move toward 23,300 next.
Nasdaq 100 Daily Chart
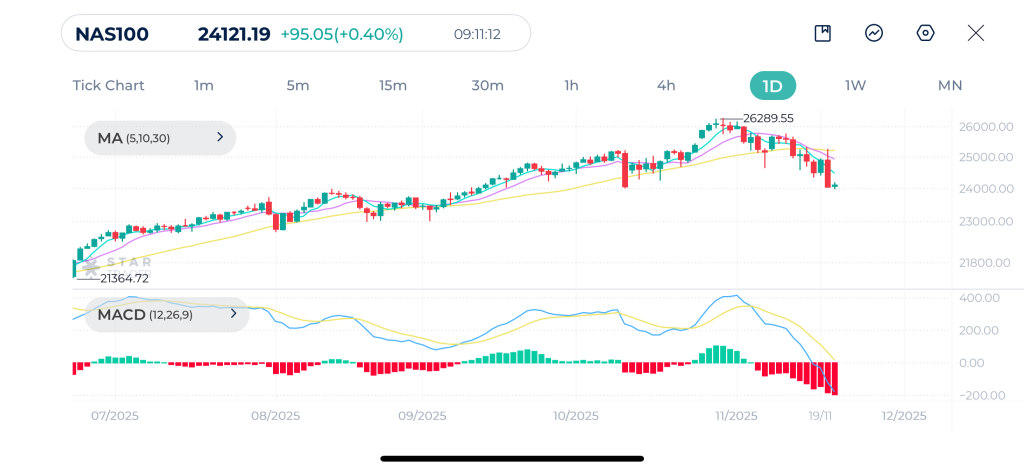
| Resistance | 24,445 – 24,458 | 24,976 – 24,988 | 25,282 – 25,290 |
| Support | 23,747 – 23,760 | 23,465 – 23,470 | 23,260 – 23,276 |
Gold Technical Analysis
The daily chart of gold shows a sharp correction and consolidation around $4,030 after a strong bullish trend peaking at $4,381.36. The long-term trend is up, but the price is currently consolidating after a drop.
Price is above the long-term 30-day moving average, but below the short-term 5 and 10-day moving averages. A recent bearish crossover indicates the short-term trend has paused.
MACD is below the zero line, but the lines are flattening, suggesting the selling pressure may be waning. If price closes above the 10-day moving average and MACD crosses above its signal line, this would support continuation of the primary uptrend. However, if price breaks and closes below the 30-day moving average, this signals a deeper correction or trend reversal.
Gold Daily Chart
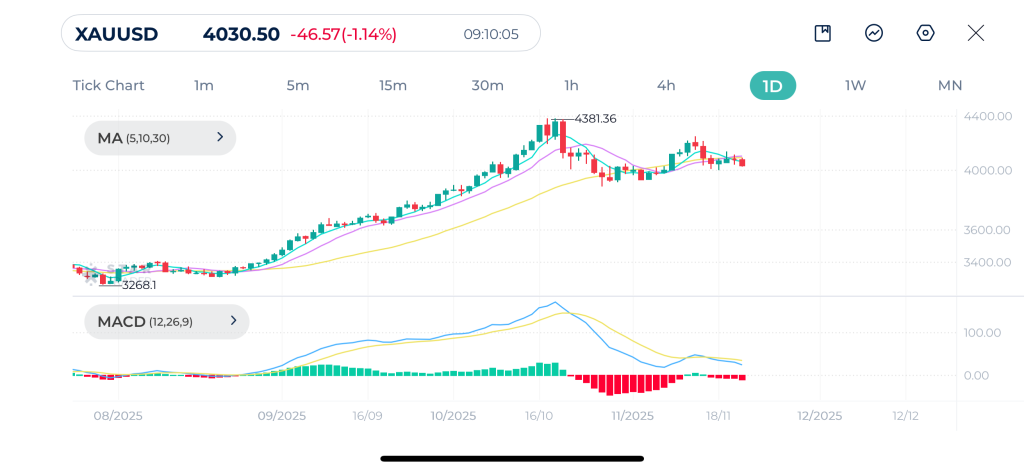
| Resistance | $4,132 – $4,156 | $4,246 – $4,270 | $4,325 – $4,330 |
| Support | $3,997 – $4,000 | $3,929 – $3,943 | $3,878 – $3,890 |
Bitcoin Technical Analysis
Bitcoin continues to experience a strong bearish phase, with prices accelerating downward toward the current 85,300 area. The candles are long and decisively red, indicating persistent selling pressure with almost no bullish recovery attempts. Price is trading well below all three moving averages (5, 10, and 30), and the slope of these averages is sharply downward, confirming a well-established downtrend.
The MACD shows heavy bearish momentum, with the MACD line diverging significantly below the signal line. This suggests strong downside continuation and no signs of bullish divergence yet. If Bitcoin breaks below $85,000, the next potential support lies in the $80,000–$82,000 region where demand previously reacted. A daily close back above $92,000 would begin easing the bearish pressure and signal an early reversal attempt. For now, momentum clearly favors the sellers.
Bitcoin Daily Chart
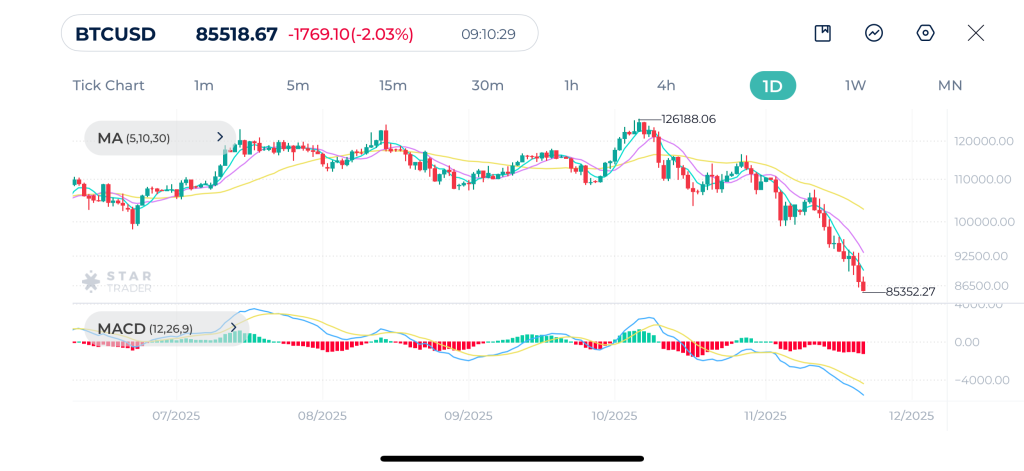
| Resistance | $90,000 – $90,120 | $92,568 – $92,620 | $95,000 – $95,130 |
| Support | $84,00 – $84,076 | $82,240 – $82,260 | $78,200 – $78,285 |
EURUSD Technical Analysis
EURUSD is currently moving in a mild downtrend after failing to sustain the October rally that peaked near 1.19179. Since then, the pair has been creating lower highs while gradually slipping below the moving averages. The recent rebound attempt was capped near the 1.16 zone, and price has once again turned downward, testing the region below the moving averages.
The structure shows indecision followed by renewed selling, suggesting buyers are losing control as the pair remains under macro pressure from a stronger USD.
MACD is relatively neutral, but bearish bias is developing again. The MACD line is slightly below the signal line, signaling weakening bullish momentum
If EURUSD stays below the 1.1550–1.1580 zone, the pair may slide back toward 1.1450 and possibly 1.1400, which previously acted as a strong demand area. A recovery above 1.1650, however, would indicate a possible shift back into a consolidation phase rather than a continuation of the downtrend.
EURUSD Daily Chart
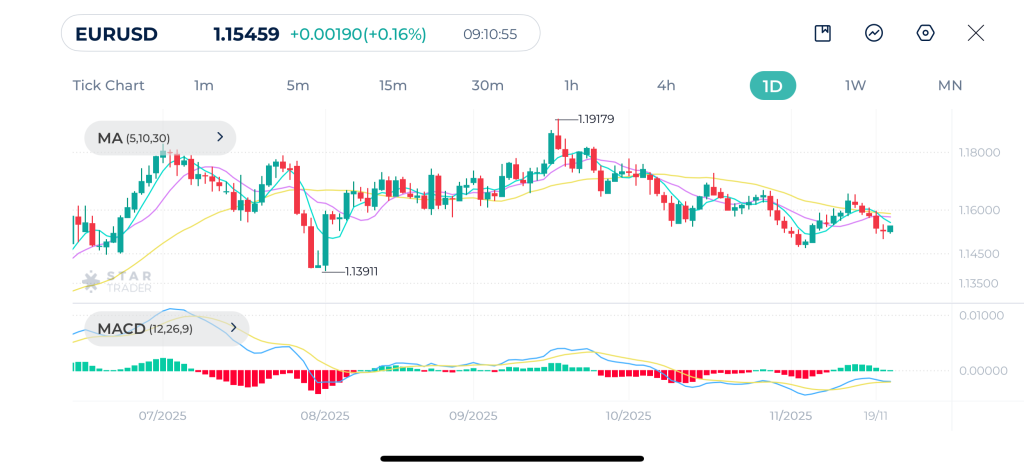
| Resistance | 1.1604 – 1.1610 | 1.1654 – 1.1662 | 1.1700 – 1.1710 |
| Support | 1.1468 – 1.1476 | 1.1392 – 1.1405 | 1.1218 – 1.1230 |
Tags


Open Live Account
 Email Address
 Phone Number
Important Notice
STARTRADER does not accept any applications from Australian residents.
To comply with regulatory requirements, clicking the button will redirect you to the STARTRADER website operated by STARTRADER PRIME GLOBAL PTY LTD (ABN 65 156 005 668), an authorized Australian Financial Services Licence holder (AFSL no. 421210) regulated by the Australian Securities and Investments Commission.
Important Notice for Residents of the United Arab Emirates
In alignment with local regulatory requirements, individuals residing in the United Arab Emirates are requested to proceed via our dedicated regional platform at startrader.ae, which is operated by STARTRADER Global Financial Consultation & Financial Analysis L.L.C.. This entity is licensed by the UAE Capital Market Authority (CMA) under License No. 20200000241, and is authorised to introduce financial services and promote financial products in the UAE.
Please click the "Continue" button below to be redirected.


