


Key Takeaways
- The Federal Reserve kept interest rates unchanged at 3.50% – 3.75%, but a rare split vote highlighted internal disagreement and rising inflation concerns.
- S&P 500 and Nasdaq reached new all-time highs, driven by strong Big Tech earnings
- Oil prices surged to the highest levels since 2022, with Brent exceeding $120 amid U.S.–Iran tensions
- Gold declined and remained under pressure, while silver showed relative resilience
- U.S. dollar strengthened significantly, supported by hawkish Fed expectations and geopolitical uncertainty
- Tech earnings broadly beat expectations, reinforcing confidence in AI-driven growth, though not without selective disappointments
- Geopolitical risks escalated, particularly around the Strait of Hormuz, impacting energy markets and global sentiment
The Federal Reserve Kept Interest Rates Unchanged
The Federal Reserve meeting was one of the most important events of the week. While the Fed kept rates unchanged at 3.50%–3.75%, the level of dissent among policymakers stood out. This was the highest disagreement since 1992.
On the one hand, some policymakers are still open to easing if economic conditions soften. On the other hand, a growing number are increasingly concerned that inflation, especially energy driven inflation, is becoming more persistent.
Tech Companies Drive US Indices to new Record Highs
U.S. equities delivered a strong performance overall, with both the S&P 500 and Nasdaq hitting fresh record highs during the week. The rally was largely fueled by exceptional earnings from major technology companies, particularly those heavily exposed to artificial intelligence.
Companies like Microsoft, Alphabet, and Amazon reported strong results, especially in cloud computing and AI infrastructure, reinforcing the idea that massive capital expenditures in AI are beginning to generate real returns.
Nasdaq 100 rose 1% during the week to a new record high of 27,540. The S&P 500 was up 1.1% for the week, breaking above 7,200 for the first time.
Oil Surged to the Highest Level Since 2022
Oil was arguably the most important driver of macro sentiment this week. Prices surged sharply, with Brent crude moving above $120–$126, reaching levels not seen since 2022. The rally was driven by a combination of geopolitical escalation and structural supply disruptions.
The key issue remains the U.S.–Iran conflict, particularly the ongoing U.S. naval blockade, disruptions in the Strait of Hormuz, and the lack of progress in negotiations, keeping markets on edge. What makes this rally particularly important is not just the price level, but its implications as higher oil prices directly feed into global inflation, which complicates central bank policy, reduces the likelihood of rate cuts, and puts pressure on economic growth
If oil continues rising toward the $130–$150 range, it could become the dominant macro driver in the coming weeks.
Looking ahead, markets are entering a phase where multiple high-impact themes are converging, mainly central bank policy, geopolitical tensions, and earnings momentum.
Major Economic Calendar Events for the Upcoming Week
| Date | Metric | Country | Previous | Time [Dubai] |
| Monday, 4 May | Eurogroup Meetings | Euro | All Day | |
| Tuesday, 5 May | Interest Rate Decision | Australia | 4.10% | 8:30 AM |
| Tuesday, 5 May | ISM Services PMI | USA | 54 | 6:00 PM |
| Tuesday, 5 May | JOLTS Job Openings | USA | 6.88M | 6:00 PM |
| Wednesday, 6 May | Unemployment Rate | New Zealand | 5.40% | 2:45 AM |
| Wednesday, 6 May | ADP Non-Farm Employment Change | USA | 62K | 4:15 PM |
| Thursday, 7 May | Unemployment Claims | USA | 4:30 PM | |
| Friday, 8 May | Unemployment Rate | Canada | 6.70% | 4:30 PM |
| Friday, 8 May | Non-Farm Employment Change | USA | 178K | 4:30 PM |
| Friday, 8 May | Unemployment Rate | USA | 4.30% | 4:30 PM |
Technical Analysis and Forecast:
Brent Oil Technical Analysis
Oil is showing a strong bullish structure on the daily chart, with a clear breakout and continuation pattern on the daily timeframe. After a prolonged accumulation phase, price has accelerated higher, breaking above key resistance levels and reaching the $120.30 area.
The moving averages are strongly aligned to the upside, and price is trading well above them, confirming sustained bullish momentum. The trend is characterized by strong impulsive moves and shallow pullbacks, indicating aggressive buying interest.
As long as price remains above the $110–$112 support zone, the bullish trend is expected to continue, with potential extensions toward $122 and higher.
Brent Oil Daily Chart
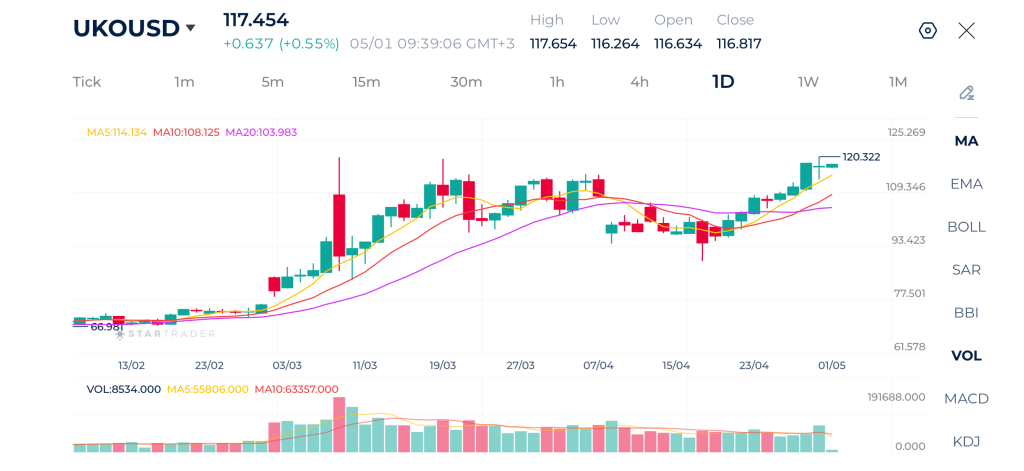
| Resistance | $120.32 – $120.50 | $122.65 – $122.80 | $124.46 – $124.67 |
| Support | $116.26 – $116.48 | $109.34 – $109.50 | $106.45 – $106.66 |
Gold Technical Analysis
Gold remains under broader bearish pressure on the daily timeframe, despite entering a consolidation phase in recent sessions.
The moving averages are still not fully aligned to the upside, and price continues to struggle below key resistance zones around $4,700–$4,800. This suggests that the current movement is more of a corrective consolidation. The inability to break higher indicates that sellers are still in control in the broader context.
A break below the recent support around $4,550 could trigger another leg lower, while a sustained move above $4,800 would be required to shift the structure toward a more bullish outlook.
Gold Daily Chart
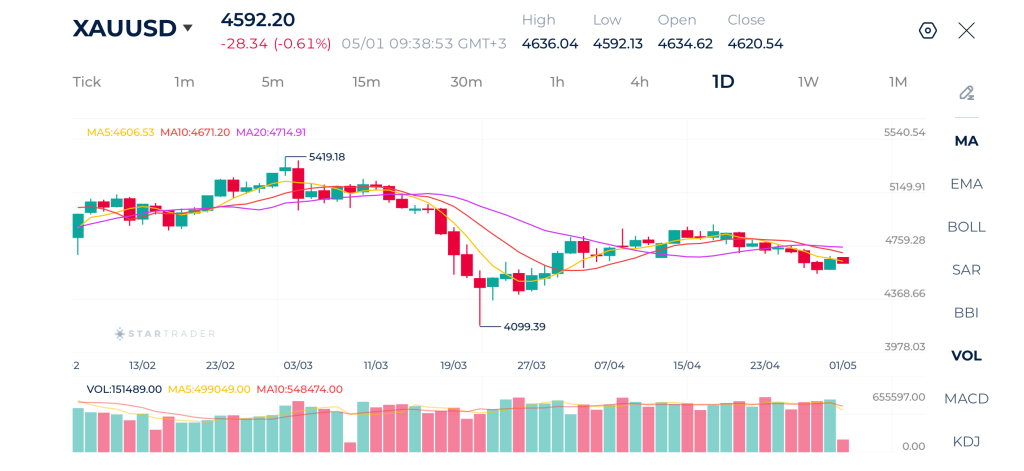
| Resistance | $4,660 – $4,680 | $4,720 – $4,735 | $4,800 – $4,825 |
| Support | $4,370 – $4,390 | $4,269 – $4,254 | $4,099 – $4,115 |
S&P 500 Technical Analysis
The S&P 500 remains in a strong bullish trend on the daily timeframe, with a clear sequence of higher highs and higher lows supported by well-aligned moving averages. The recent rally pushed price toward new highs around 7,245.
The broader trend remains firmly bullish as long as price holds above the 7,050–7,100 support zone. Any pullback toward this area would likely be viewed as a corrective move within an ongoing uptrend. A break above 7,250 could trigger another leg higher, while a deeper correction below 7,050 would be needed to signal a more meaningful shift in momentum.
S&P 500 Daily Chart
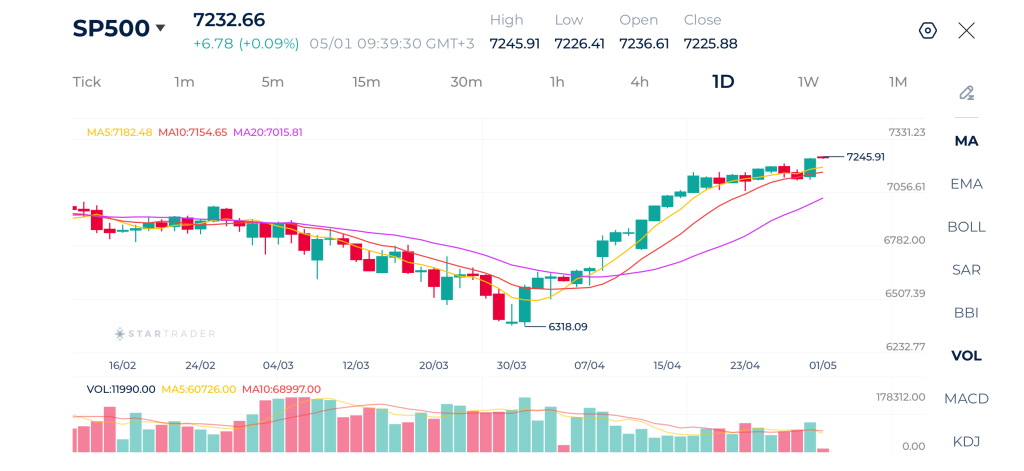
| Resistance | 7,245 – 7,250 | 7,287 – 7,300 | 7,348 – 7,360 |
| Support | 7,100 – 7,120 | 7,026 – 7,040 | 6,989 – 7,000 |
EURUSD Technical Analysis
On the daily timeframe, EURUSD has shifted from a clear downtrend into a recovery phase, but that rebound now appears to be losing momentum. After bouncing strongly from the 1.1410 area, price pushed toward the 1.1800 region but failed to sustain higher levels, forming a lower high relative to the previous structure.
Currently, price is consolidating around the moving averages, with MA10, MA20, and MA50 starting to flatten, which reflects a transition from trending conditions into a more neutral, range-bound environment. The inability to break decisively above 1.1750–1.1800 suggests weakening bullish momentum, while support around 1.1650 remains key in the near term.
A break below this level could shift the structure back toward bearish continuation, whereas a sustained move above 1.1800 would be required to confirm a stronger bullish trend resumption.
EURUSD Daily Chart
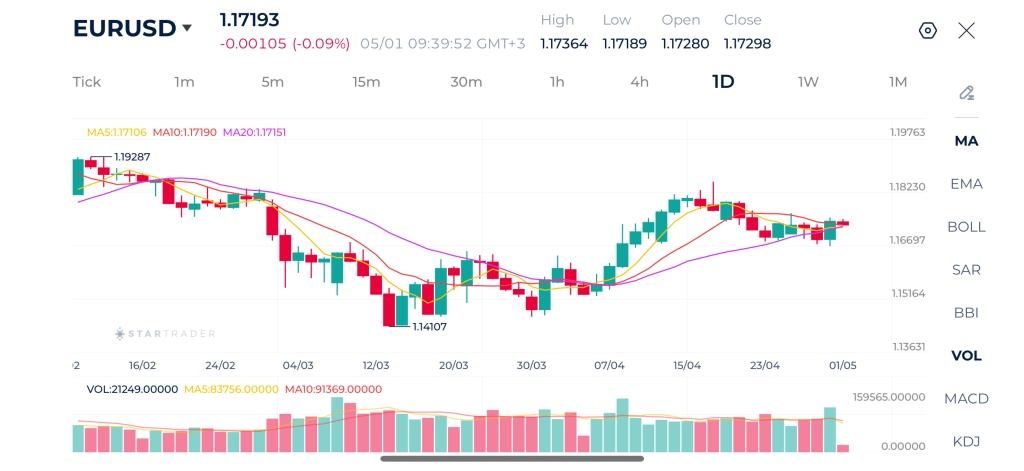
| Resistance | 1.1788 – 1.1800 | 1.1855 – 1.1870 | 1.1920 – 1.1934 |
| Support | 1.1650 – 1.1657 | 1.1589 – 1.1600 | 1.1504 – 1.1512 |
Risk Disclaimer: This material is provided for informational purposes only and does not constitute a recommendation or investment advice. Trading financial instruments on margin involves substantial risk and may not be appropriate for all investors.
Tags
Open Live Account
Please enter a valid country
No results found
No results found
Please enter a valid email
Please enter a valid verification code
1. 8-16 characters + numbers (0-9) 2. blend of letters (A-Z, a-z) 3. special characters (e.g, !a#S%^&)
Please enter the correct format
Please tick the checkbox to proceed
Please tick the checkbox to proceed
Important Notice
STARTRADER does not accept any applications from Australian residents.
To comply with regulatory requirements, clicking the button will redirect you to the STARTRADER website operated by STARTRADER PRIME GLOBAL PTY LTD (ABN 65 156 005 668), an authorized Australian Financial Services Licence holder (AFSL no. 421210) regulated by the Australian Securities and Investments Commission.
CONTINUEImportant Notice for Residents of the United Arab Emirates
In alignment with local regulatory requirements, individuals residing in the United Arab Emirates are requested to proceed via our dedicated regional platform at startrader.ae, which is operated by STARTRADER Global Financial Consultation & Financial Analysis L.L.C.. This entity is licensed by the UAE Capital Market Authority (CMA) under License No. 20200000241, and is authorised to introduce financial services and promote financial products in the UAE.
Please click the "Continue" button below to be redirected.
CONTINUEError! Please try again.

