


Key Takeaways
- Global markets entered 2026 on a cautious but constructive note, with thin liquidity and light trading volumes due to the year-end holiday period.
- Precious metals remained historically strong, consolidating near record highs after explosive December rally.
- The U.S. dollar recovered slightly during the week, with the dollar index rising above 98.00 again.
- U.S. stock indices closed the year near all-time highs, supported by easing financial conditions.
- Bitcoin and major cryptocurrencies struggled to regain momentum, as capital continued rotating toward stocks and metals.
U.S. Indices See Profit Taking Near Record Highs
U.S. equity markets ended 2025 on a strong footing and began 2026 with modest consolidation. The S&P 500 and Dow Jones hovered near record levels, supported by expectations that monetary policy will remain accommodative in the coming months. Dow Jones dropped nearly 1% during the week to 48,200, down from its record high 48,880 logged in early December. The S&P 500 retreated 0.75% to 6,879, but it’s still trading near record levels.
The Nasdaq 100 remained under pressure as profit taking persisted in high valuation technology and AI-related stocks. Investors appeared more selective toward the end of the year, favoring companies with stable cash flows and pricing power. The Federal Reserve’s December meeting minutes revealed a highly divided FOMC. While the committee ultimately lowered rates by 25 basis points to 3.5%–3.75%, some officials indicated that they could have supported leaving rates unchanged due to lingering inflation concerns.
Most policymakers agreed that further rate cuts may be appropriate if inflation continues to ease, but there was clear disagreement over the timing and pace of future easing.
The minutes also highlighted expectations from the dot plot for one more rate cut in 2026 and another in 2027, bringing rates toward a neutral level near 3%.
Gold and Silver Retreat after Reaching New Record Levels
Gold retreated from its record highs dropping more than 3% during the week, The precious metal recorded a new all-time high at $4,550 on Monday before ending the week around $4,374. Silver saw strong profit taking after December’s historic surge. Prices eased from near $83.75 on Monday to around $70 on Wednesday.
The gold-to-silver ratio stabilized near 59, significantly lower than earlier in the year, highlighting silver’s relative outperformance and reinforcing the bullish structure across precious metals.
The U.S. Dollar Index (DXY) stabilized during the week after dropping below 98.00. Expectations of further Federal Reserve rate cuts in 2026 are likely to keep pressure on the dollar, particularly against major currencies.
EURUSD declined around 0.23%, but the overall bullish trend seems to remain intact.
GBPUSD fell to 1.3400 on Wednesday, but later rebounded and ended the week around 1.3467.
USDJPY saw some fluctuations during the week, but later rose to 156.90, supported by a stronger dollar.
Key Economic Data of the week
- US Pending Home Sales jumped to 3.3% in November, surpassing market consensus of 1.0%
- US unemployment claims fall to 199K, lower than market expectations of 219K.
- Chinese Manufacturing PMI rose to 50.1 min December, up from 49.2 in November.
- FOMC minutes show divided Fed, but more rate cuts in 2026 and 2027
Major Economic Calendar Events for the Upcoming Week
| Date | Metric | Country | Previous | Expected | Time [Dubai] |
| Monday, 5 January | ISM Manufacturing PMI | USA | 48.2 | 48.4 | 7:00 PM |
| Tuesday, 6 January | Final Services PMI | Euro | 52.6 | 52.6 | 1:000pm |
| Wednesday, 7 January | Consumer Price Index y/y | Australia | 3.80% | 4:30 AM | |
| Wednesday, 7 January | ADP Non-Farm Employment Change | USA | -32K | 50K | 5:15 PM |
| Wednesday, 7 January | ISM Services PMI | USA | 52.6 | 52.2 | 7:00 PM |
| Wednesday, 7 January | JOLTS Job Openings | USA | 7.67m | 7.73 | 7:00 PM |
| Thursday, 8 January | Consumer Price Index | Switzerland | -0.20% | 0.00% | 11:30 AM |
| Friday, 9 January | Unemployment Rate | Canada | 7% | 6.70% | 5:30 PM |
| Friday, 9 January | Non-Farm Employment Change | USA | 64K | 52K | 5:30 PM |
| Friday, 9 January | Unemployment Rate | USA | 4.60% | 4.50% | 5:30 PM |
Technical Analysis and Forecast:
Dow Jones Technical Analysis
Dow Jones remains in a well-established uptrend on the daily chart, characterized by consistent higher highs and higher lows. Price continues to trade above all key moving averages, with 30-day moving average trending upward, reinforcing the strength of the underlying bullish structure.
MACD lines remain above the zero level, indicating that bullish momentum is cooling but not reversing.
Key support lies around 47,800–48,000, which aligns with previous breakout levels and the rising MA(30). As long as this zone holds, the Dow is likely to maintain its bullish bias and potentially retest the 49,000 highs. A decisive daily close below the longer moving average MA(30) would be required to shift the outlook to neutral. Until then, the index remains technically bullish with controlled corrective behavior.
Dow Jones Daily Chart
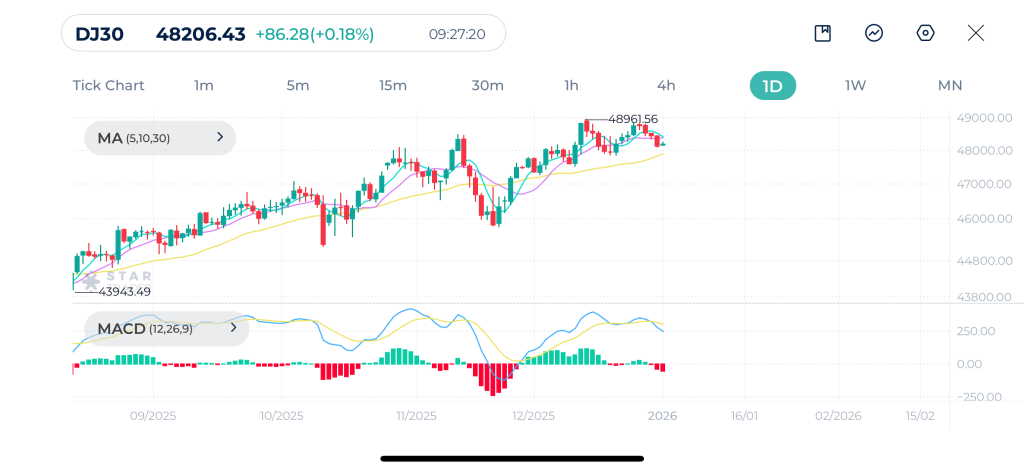
| Resistance | 48,463 – 48,500 | 48,783 – 48,880 | 48,992 – 49,000 |
| Support | 47,797 – 47,870 | 47,452 – 47,512 | 47,198 – 47,269 |
Gold Technical Analysis
Gold continues to trade in a strong primary uptrend, as clearly reflected by higher highs, higher lows, and sustained price action above the rising 30-day moving average. After reaching a new high near $4,550, gold has entered a healthy corrective pullback, but the structure remains bullish as long as price holds above the longer moving average MA (30), which has consistently acted as dynamic support throughout the trend.
MACD confirms this bullish environment despite the recent pause, and the MACD lines remain well above the zero line.
The $4,300 – $4,350 zone is a key support area. As long as this zone holds, gold remains well-positioned for another upside attempt toward the $4,550 highs and potentially beyond. A sustained break below the 30-day moving average would be the first warning signal of a deeper correction, but for now, gold remains structurally bullish on the daily timeframe.
Gold Daily Chart
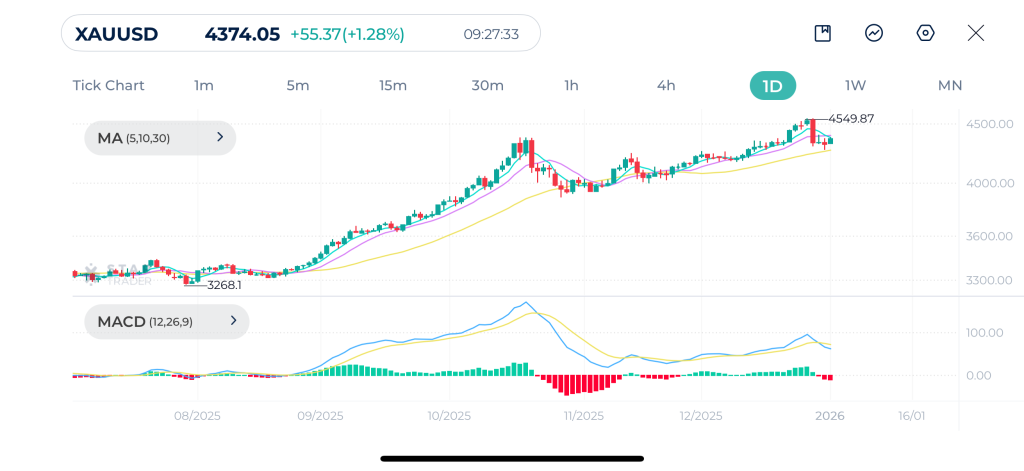
| Resistance | $4,410 – $4,421 | $4,480 – $4,492 | $4,536 – $4,550 |
| Support | $4,276 – $4,280 | $4,248 – $4,251 | $4,192 – $4,200 |
Bitcoin Technical Analysis
Bitcoin continues to trade in consolidation phase near its recent lows. Since the sell-off in October, price action has stabilized and is now moving sideways in a relatively tight range around the $88,000– $90,000 area. The market remains below the 30-day moving average, which is still sloping downward, indicating that the broader short-term trend remains bearish to neutral despite the recent stabilization.
MACD is gradually improving, and the MACD line is attempting to move closer to the signal line. This suggests that selling pressure has largely faded, but bullish momentum is still not strong enough to confirm a trend reversal. As long as Bitcoin remains below the $95,000 – $100,000 resistance zone upside moves are likely to be corrective.
Technically, the $80,600 area remains a major structural support, and holding above it keeps the medium-term bullish structure intact. A daily close above the 30-day moving average would be the first strong signal that Bitcoin is transitioning from consolidation into a renewed bullish leg. Until then, the cryptocurrency remains in a range building phase, vulnerable to volatility but no longer in aggressive distribution.
Bitcoin Daily Chart
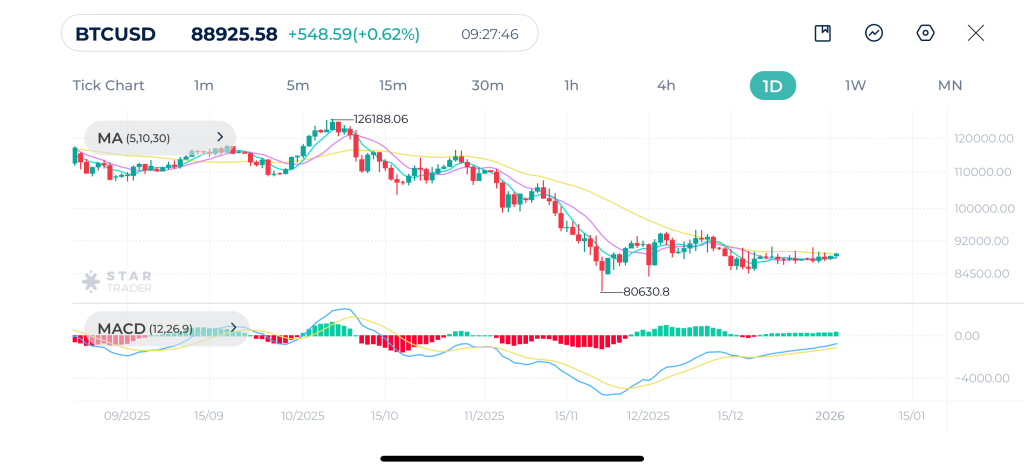
| Resistance | $90,682 – $90,705 | $94,626 – $94,681 | $96,879 – $96,900 |
| Support | $86,391 – $86,400 | $83,370 – $83,398 | $80,542 – $80,570 |
Tags
Open Live Account
Please enter a valid country
No results found
No results found
Please enter a valid email
Please enter a valid verification code
1. 8-16 characters + numbers (0-9) 2. blend of letters (A-Z, a-z) 3. special characters (e.g, !a#S%^&)
Please enter the correct format
Please tick the checkbox to proceed
Please tick the checkbox to proceed
Important Notice
STARTRADER does not accept any applications from Australian residents.
To comply with regulatory requirements, clicking the button will redirect you to the STARTRADER website operated by STARTRADER PRIME GLOBAL PTY LTD (ABN 65 156 005 668), an authorized Australian Financial Services Licence holder (AFSL no. 421210) regulated by the Australian Securities and Investments Commission.
CONTINUEImportant Notice for Residents of the United Arab Emirates
In alignment with local regulatory requirements, individuals residing in the United Arab Emirates are requested to proceed via our dedicated regional platform at startrader.ae, which is operated by STARTRADER Global Financial Consultation & Financial Analysis L.L.C.. This entity is licensed by the UAE Capital Market Authority (CMA) under License No. 20200000241, and is authorised to introduce financial services and promote financial products in the UAE.
Please click the "Continue" button below to be redirected.
CONTINUEError! Please try again.

