


Gold Technical Analysis
Gold remains under bearish pressure after extending its selloff toward $4,103 low. The precious metal continues to trade below all major moving averages, with the 5-period average below the 10-period average and both below the 20-period average. This alignment confirms strong negative momentum and highlights the dominance of sellers in the current market environment.
Technically, the $4,100-$4,105 region represents a critical support zone. A sustained break below this level would likely accelerate losses toward $4,050 and potentially the psychological $4,000 area. On the upside, immediate resistance is located around $4,140-$4,150, followed by stronger resistance near $4,175-$4,180, where the short-term moving averages converge. For sentiment to improve materially, gold would need to reclaim the $4,180-$4,200 region and establish support above it. Until then, the short-term outlook remains bearish, with downside risks continuing to dominate price action.
Gold 1H Chart
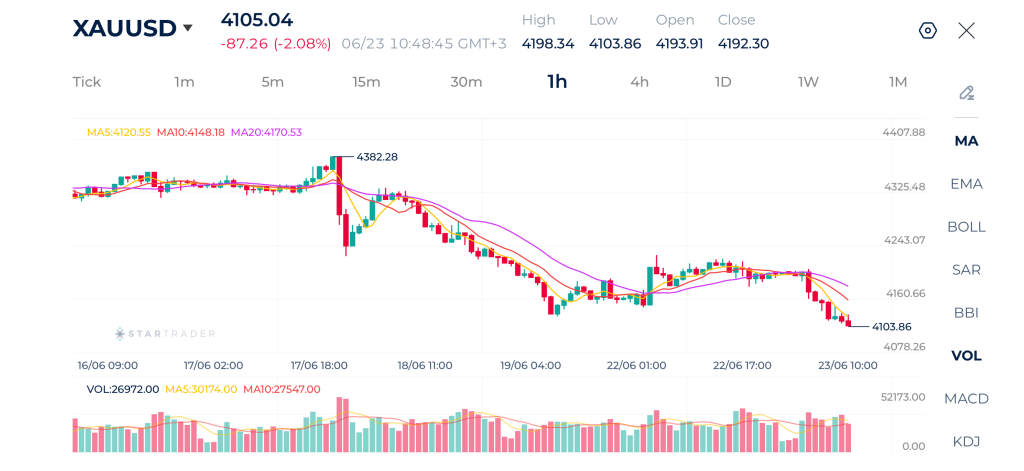
| Resistance | $4,100 | $4,140 | $4,180 |
| Support | $4,085 | $4,045 | $4,000 |
Brent Technical Analysis
Brent crude remains firmly bearish after extending its decline toward a fresh short-term low at $76.61. The market continues to trade below the 5, 10, and 20-period moving averages, while the moving averages themselves are aligned in a bearish sequence, confirming strong downside momentum. The recent breakdown below the psychological $78.00 level has accelerated selling pressure and reinforced the prevailing downtrend.
From a technical perspective, immediate support is located at $76.60, which represents the current swing low. A break below this level could trigger a deeper decline toward $76.00 and potentially $75.00. On the upside, initial resistance is seen around $77.80-$78.00, followed by stronger resistance near the declining 20-period moving average around $78.30-$78.50. Only a sustained recovery above these levels would ease the bearish outlook.
Brent 1H Chart
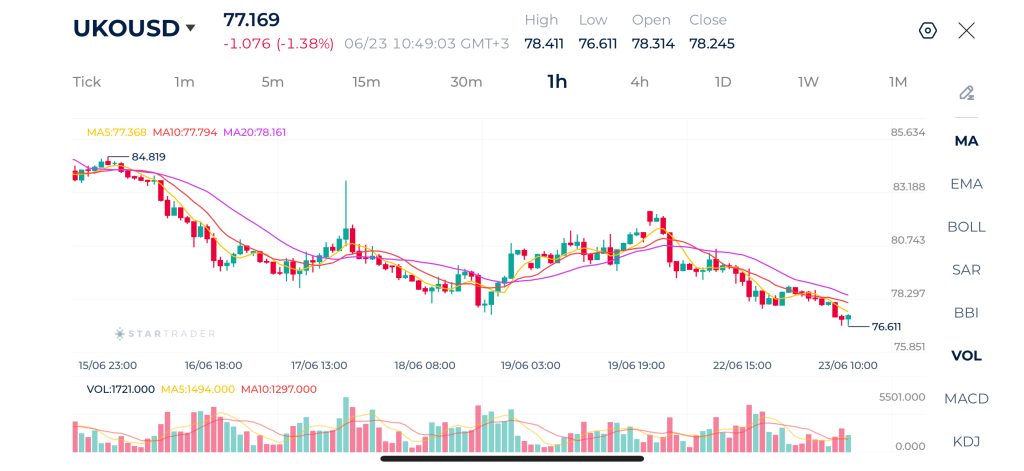
| Resistance | $78.00 | $79.50 | $80.22 |
| Support | $76.00 | $75.24 | $74.80 |
USDJPY Technical Analysis
USDJPY remains in an overall bullish trend despite a modest pullback from the recent high at 161.92. The pair continues to trade above the rising 20-period moving average, while the broader structure remains characterized by higher highs and higher lows. The strong rally from the 160.10 low reflects persistent dollar strength against the yen, although momentum has started to slow near the 162.00 resistance zone.
The recent consolidation between 161.30 and 161.90 suggests that the market is entering a pause phase following the sharp advance. Price is currently testing short-term support around the moving averages, and the interaction with these levels will likely determine the next directional move.
Immediate support is located near 161.30, followed by stronger support around 161.00 and the 20-period moving average. A break below these levels would expose 160.50 and potentially 160.10. On the upside, resistance remains at 161.90-162.00. A decisive breakout above this area would confirm trend continuation and could open the door toward 162.50. As long as the pair remains above the rising 20-period moving average, the broader bias remains bullish despite the current consolidation.
USDJPY 1H Chart
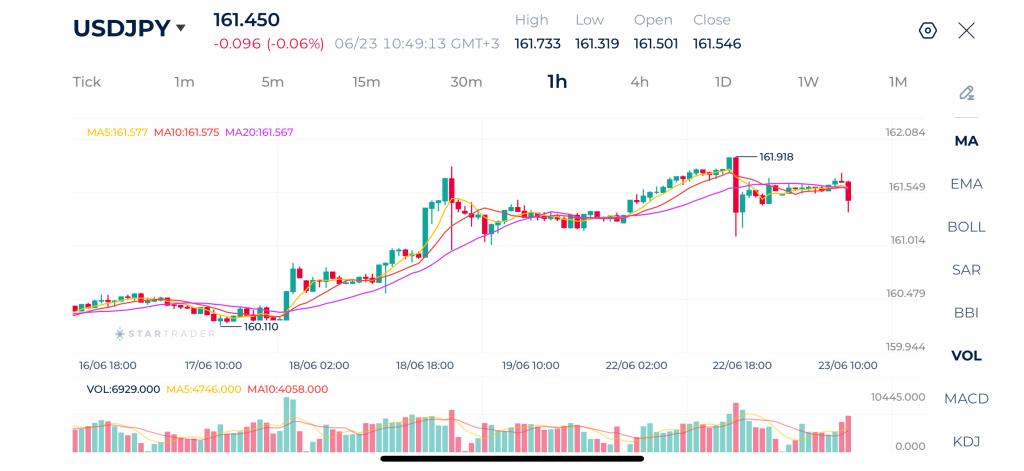
| Resistance | 162.50 | 163.88 | 165.76 |
| Support | 161.00 | 159.45 | 158.86 |
Risk Disclaimer: This material is provided for informational purposes only and does not constitute a recommendation or investment advice. Trading financial instruments on margin involves substantial risk and may not be appropriate for all investors.
Tags
Open Live Account
Please enter a valid country
No results found
No results found
Please enter a valid email
Please enter a valid verification code
1. 8-16 characters + numbers (0-9) 2. blend of letters (A-Z, a-z) 3. special characters (e.g, !a#S%^&)
Please enter the correct format
Please tick the checkbox to proceed
Please tick the checkbox to proceed
Important Notice
STARTRADER does not accept any applications from Australian residents.
To comply with regulatory requirements, clicking the button will redirect you to the STARTRADER website operated by STARTRADER PRIME GLOBAL PTY LTD (ABN 65 156 005 668), an authorized Australian Financial Services Licence holder (AFSL no. 421210) regulated by the Australian Securities and Investments Commission.
CONTINUEImportant Notice for Residents of the United Arab Emirates
In alignment with local regulatory requirements, individuals residing in the United Arab Emirates are requested to proceed via our dedicated regional platform at startrader.ae, which is operated by STARTRADER Global Financial Consultation & Financial Analysis L.L.C.. This entity is licensed by the UAE Capital Market Authority (CMA) under License No. 20200000241, and is authorised to introduce financial services and promote financial products in the UAE.
Please click the "Continue" button below to be redirected.
CONTINUEError! Please try again.

