


Brent Technical Analysis
Oil prices have recovered from their recent lows. Brent dropped to $66.05 on August 8th, but it has been pushing upward since then.
Price is consolidating just above the $67.30 level, with the shorter-term moving averages (MA 5 and 10) crossing above the 30-period moving average, suggesting a mild bullish bias.
However, the upward trend is flattening, indicating a possible slowdown in momentum since the long-term trend on oil remains largely bearish.
MACD indicates negative to positive change in bias, with the MACD line above the signal line, which supports the short-term bullish sentiment.
We are likely to see range-bound movements unless a decisive breakout occurs above $68.00 or below $66.80.
Brent 1H Chart
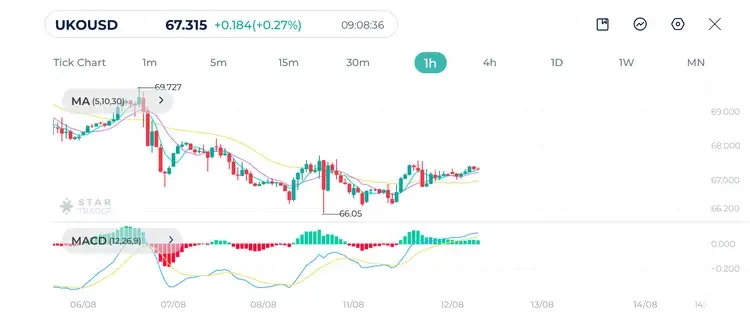
| Resistance | $66.77 | $67.00 | $67.45 |
| Support | $66.27 | $66.00 | $65.56 |
GBPUSD Technical Analysis
Sterling Pound shows a strong bullish momentum against the USD as the pair broke above 1.3400 level earlier this week, extending gains from the week before.
The alignment of the three moving averages MA(5), MA(10) and MA(30) remains bullish, with short-term averages above the 30-period moving average, but the slope has flattened, suggesting reduced buying pressure.
MACD has turned slightly positive after a bearish phase, and the MACD line is close to crossing back above the signal line, which could open the door for bullish momentum if confirmed.
A break above 1.3480 could extend gains toward 1.3520, while failure to hold 1.3400 risks a pullback toward 1.3350.
GBPUSD 1H Chart

| Resistance | 1.3446 | 1.3453 | 1.3481 |
| Support | 1.3420 | 1.3400 | 1.3360 |
Nasdaq Technical Analysis
US indices staged a strong rebound from the losses we say at the end of July. Nasdaq rose from the low of 22,949 to a recent high of 23,718, effectively erasing earlier losses.
Price is beginning to stall near the highs. The short-term moving averages are still above the long-term 30-period moving average, keeping the broader bias bullish.
Unless the index holds above 23,500, a short-term pullback toward 23,300–23,350 could unfold before buyers step back in.
Nasdaq 1H Chart
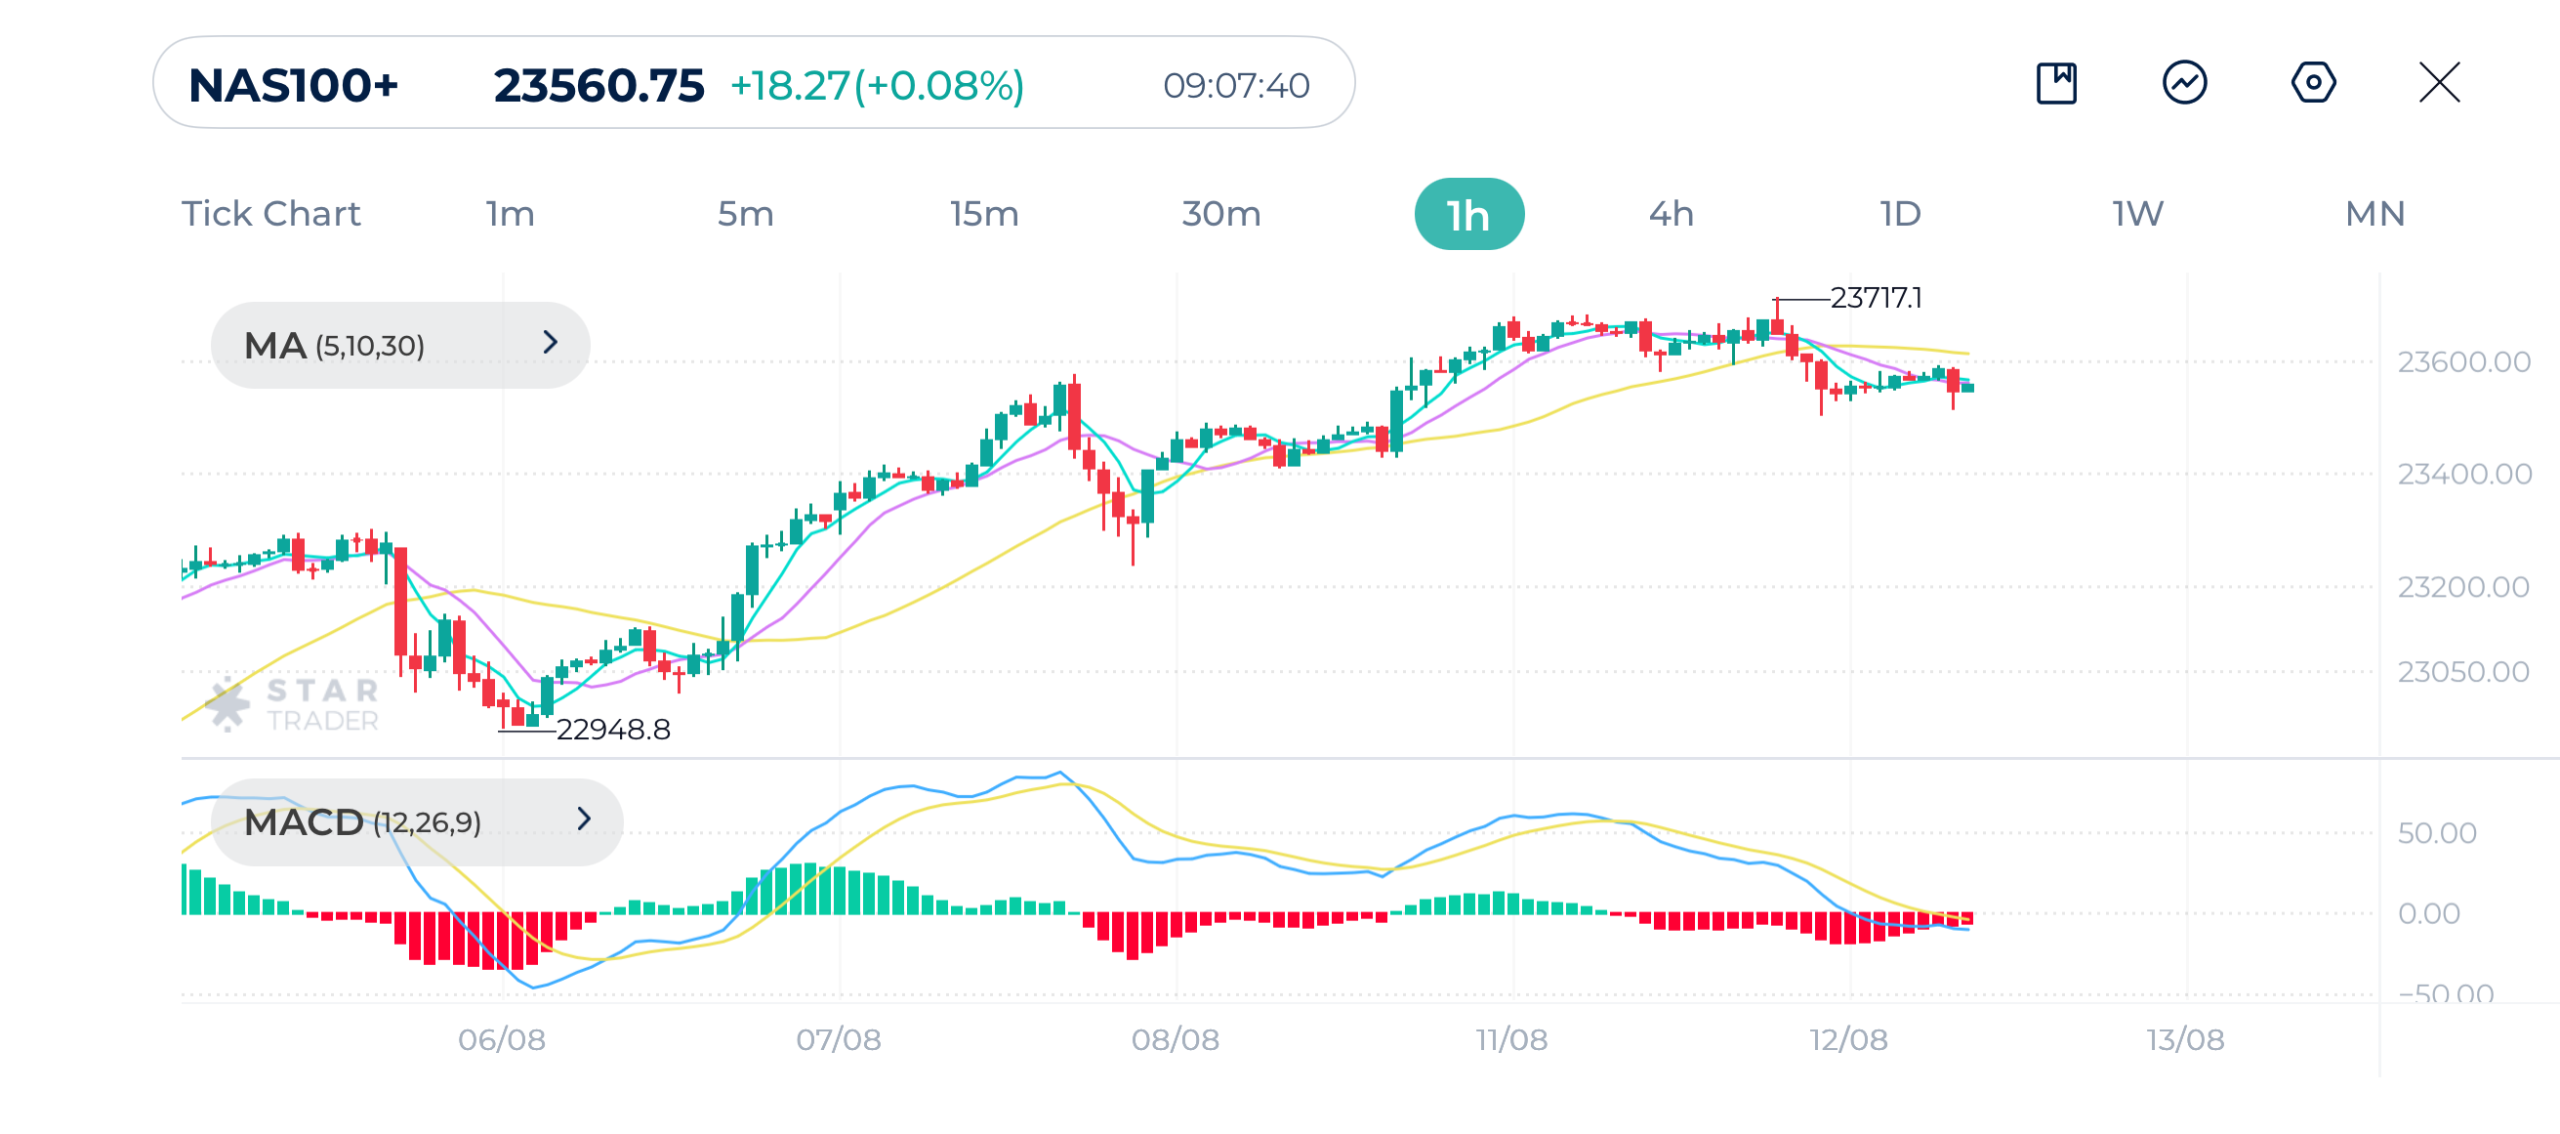
| Resistance | 23,575 | 23,596 | 23,659 |
| Support | 23,486 | 23,415 | 23,344 |
Tags
Open Live Account
Please enter a valid country
No results found
No results found
Please enter a valid email
Please enter a valid verification code
1. 8-16 characters + numbers (0-9) 2. blend of letters (A-Z, a-z) 3. special characters (e.g, !a#S%^&)
Please enter the correct format
Please tick the checkbox to proceed
Please tick the checkbox to proceed
Important Notice
STARTRADER does not accept any applications from Australian residents.
To comply with regulatory requirements, clicking the button will redirect you to the STARTRADER website operated by STARTRADER PRIME GLOBAL PTY LTD (ABN 65 156 005 668), an authorized Australian Financial Services Licence holder (AFSL no. 421210) regulated by the Australian Securities and Investments Commission.
CONTINUEImportant Notice for Residents of the United Arab Emirates
In alignment with local regulatory requirements, individuals residing in the United Arab Emirates are requested to proceed via our dedicated regional platform at startrader.ae, which is operated by STARTRADER Global Financial Consultation & Financial Analysis L.L.C.. This entity is licensed by the UAE Capital Market Authority (CMA) under License No. 20200000241, and is authorised to introduce financial services and promote financial products in the UAE.
Please click the "Continue" button below to be redirected.
CONTINUEError! Please try again.

