


Brent Technical Analysis
Oil prices show a strong downtrend on the hourly chart with minor upward correction buildings now. Price is currently moving below three major averages: MA(5), MA(10), and MA(30). The overall trend remains bearish despite minor uptick.
All three moving averages are aligned in a bearish formation. Short term moving averages MA(5) and MA(10) are starting to turn slightly upward, but as long as price respects the 30-period moving average, the downtrend remains intact.
If MACD crosses above, the upward correction might become steeper.
The overall sentiment is still bearish with potential for technical rebound. Watch out for price action at the 30-period moving average dynamic resistance level.
Brent 1H Chart
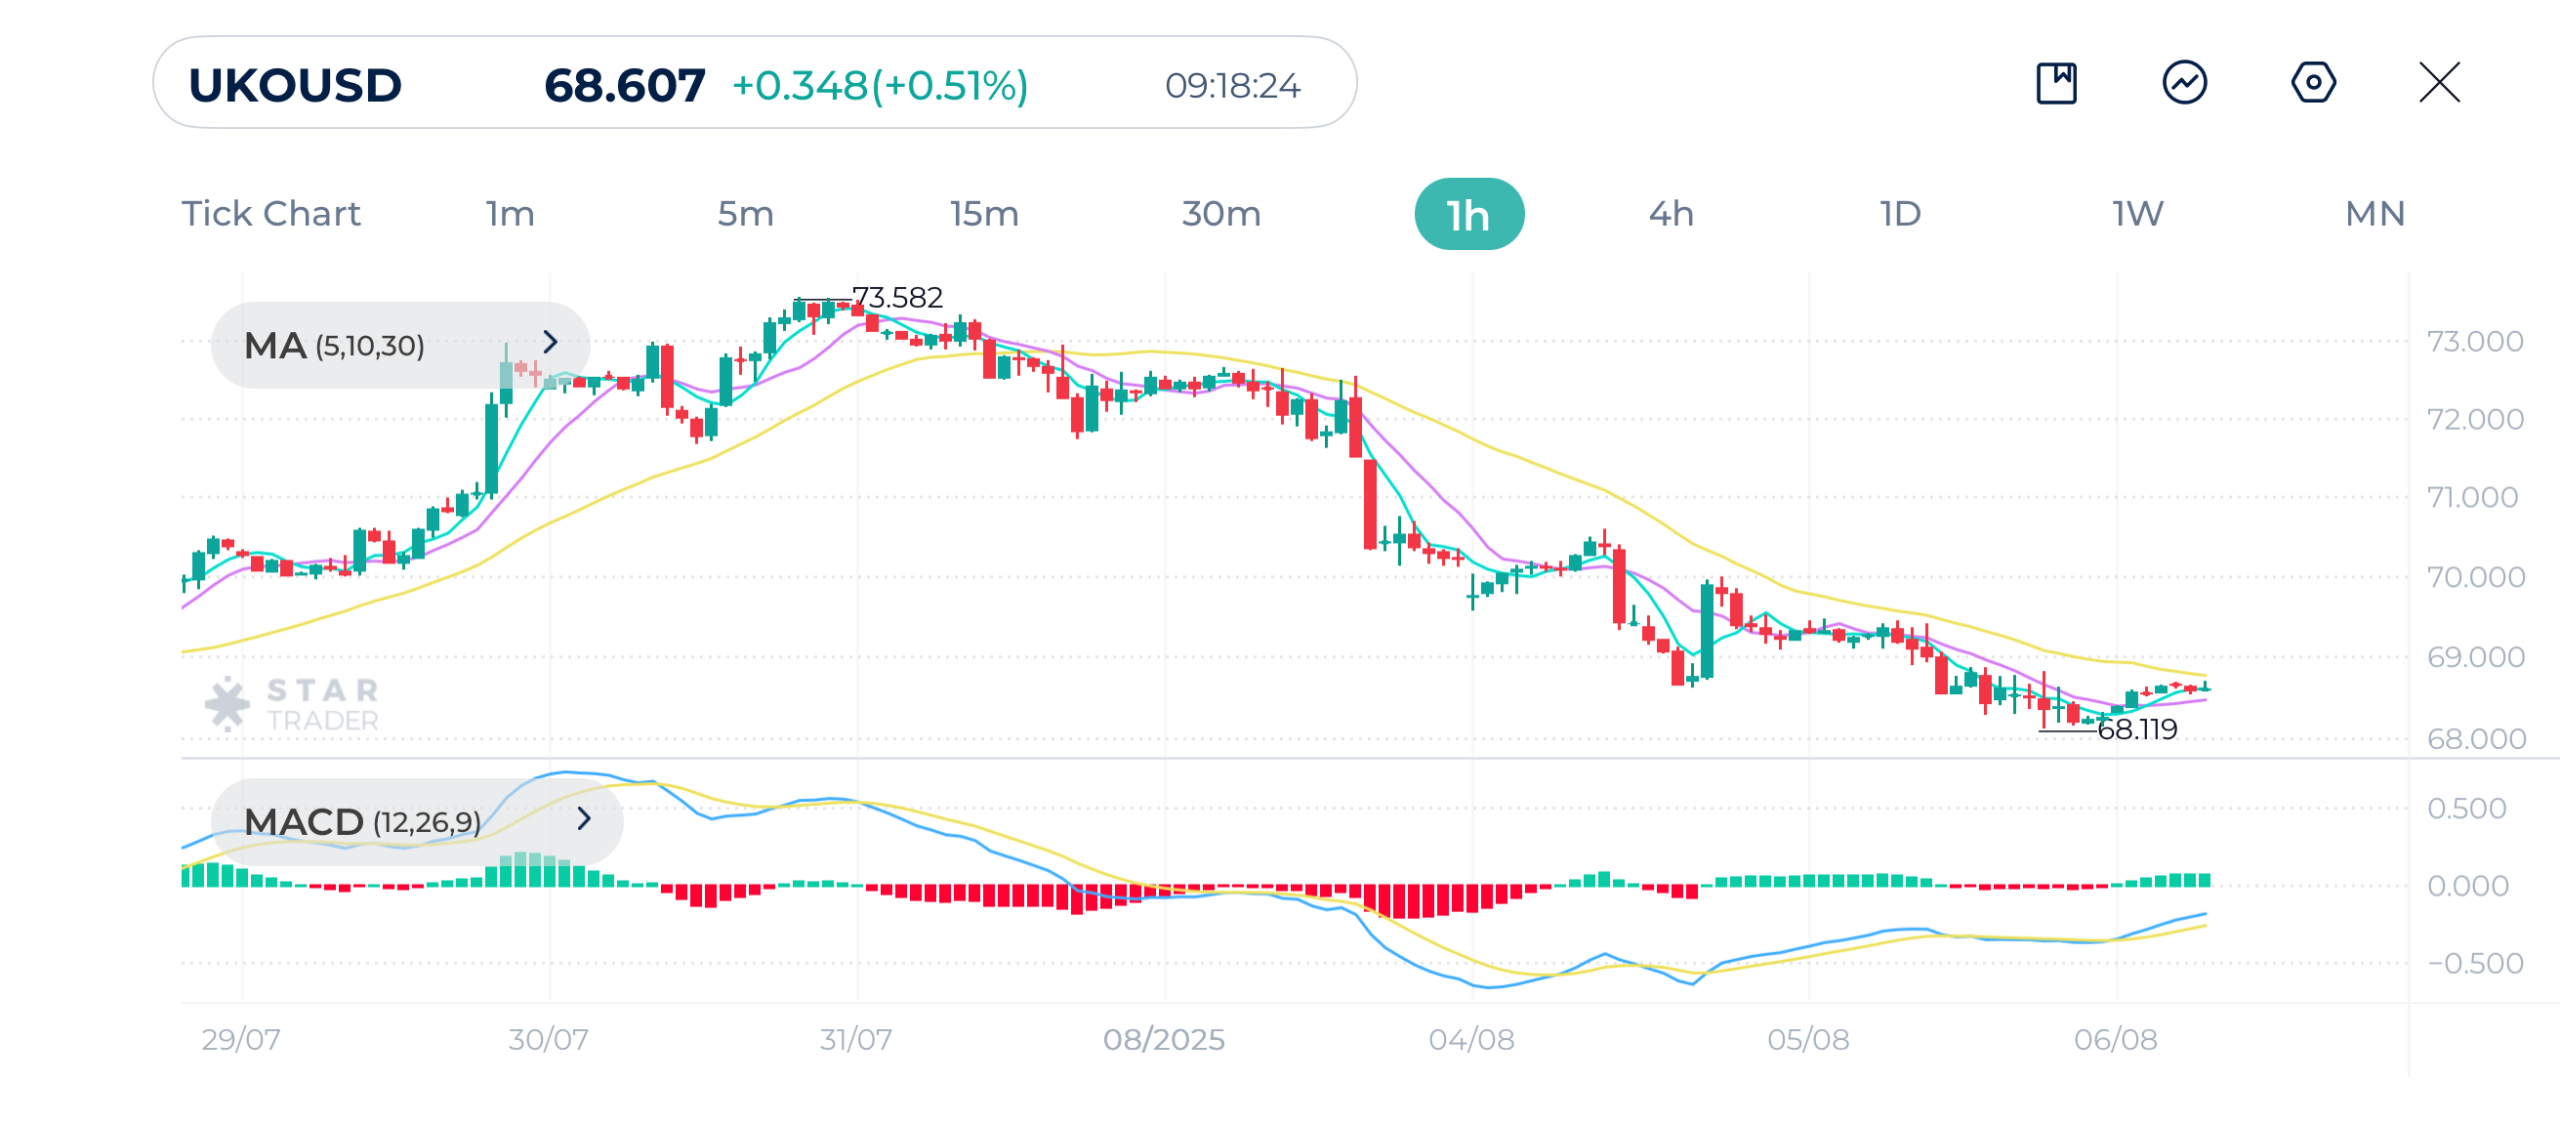
| Resistance | $68.14 | $68.71 | $69.21 |
| Support | $67.34 | $67.14 | $66.87 |
Gold Technical Analysis
Gold prices continue to go up showing bullish flag pattern, which signals a continuation in the uptrend.
The three moving averages MA(5), MA(10), and MA(30) are still in bullish alignment. However, they are currently converging with momentum fading, and a clear consolidation. The overall price action on Brent shows short-term consolidation in a medium-term bullish trend.
A breakout above $3,390 with strong volume may trigger another bullish leg.
Gold (XAUUSD) 1H Chart
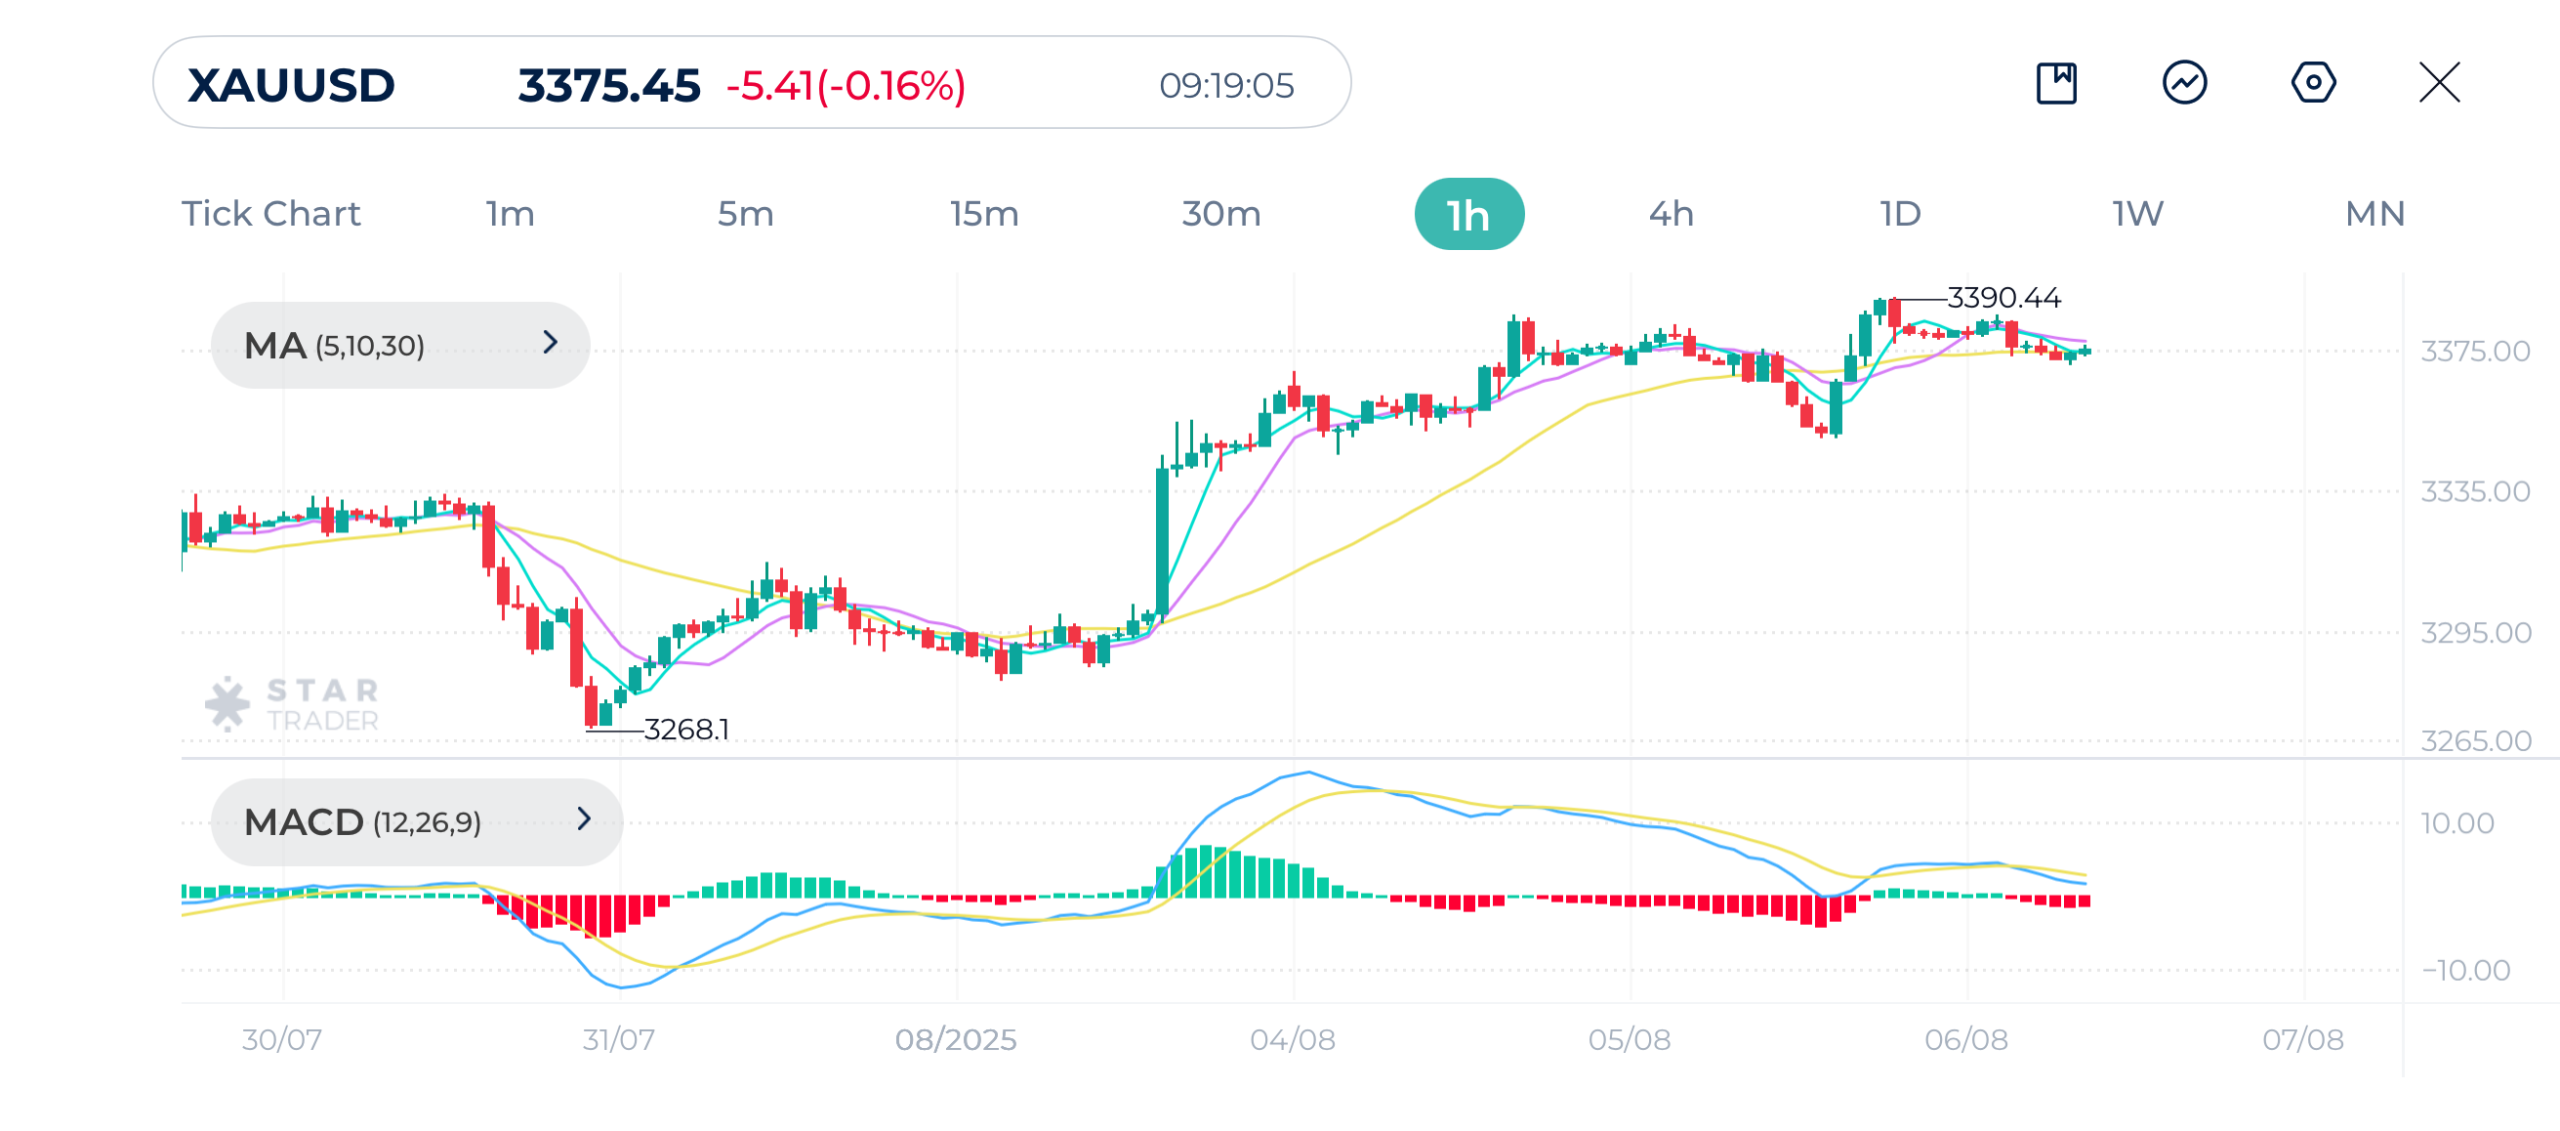
| Resistance | $3,385 | $3,402 | $3,421 |
| Support | $3,365 | $3,341 | $3,328 |
EURUSD Technical Analysis
EURUSD recently broke above the 30-period moving average on the 4H chart, indicating a bullish reversal in trend. The pair is currently consolidating below 1.1600, indicating indecision or a potential pause in the uptrend.
Short-term moving averages (5 and 10) have crossed above the 30-period MA, suggesting a bullish crossover. MACD line has crossed above the signal line and it’s now supporting the uptrend.
The overall trend is now leaning more toward bullish. Watch for breakout above 1.1600 for continuation to 1.1788.
EURUSD 4H Chart
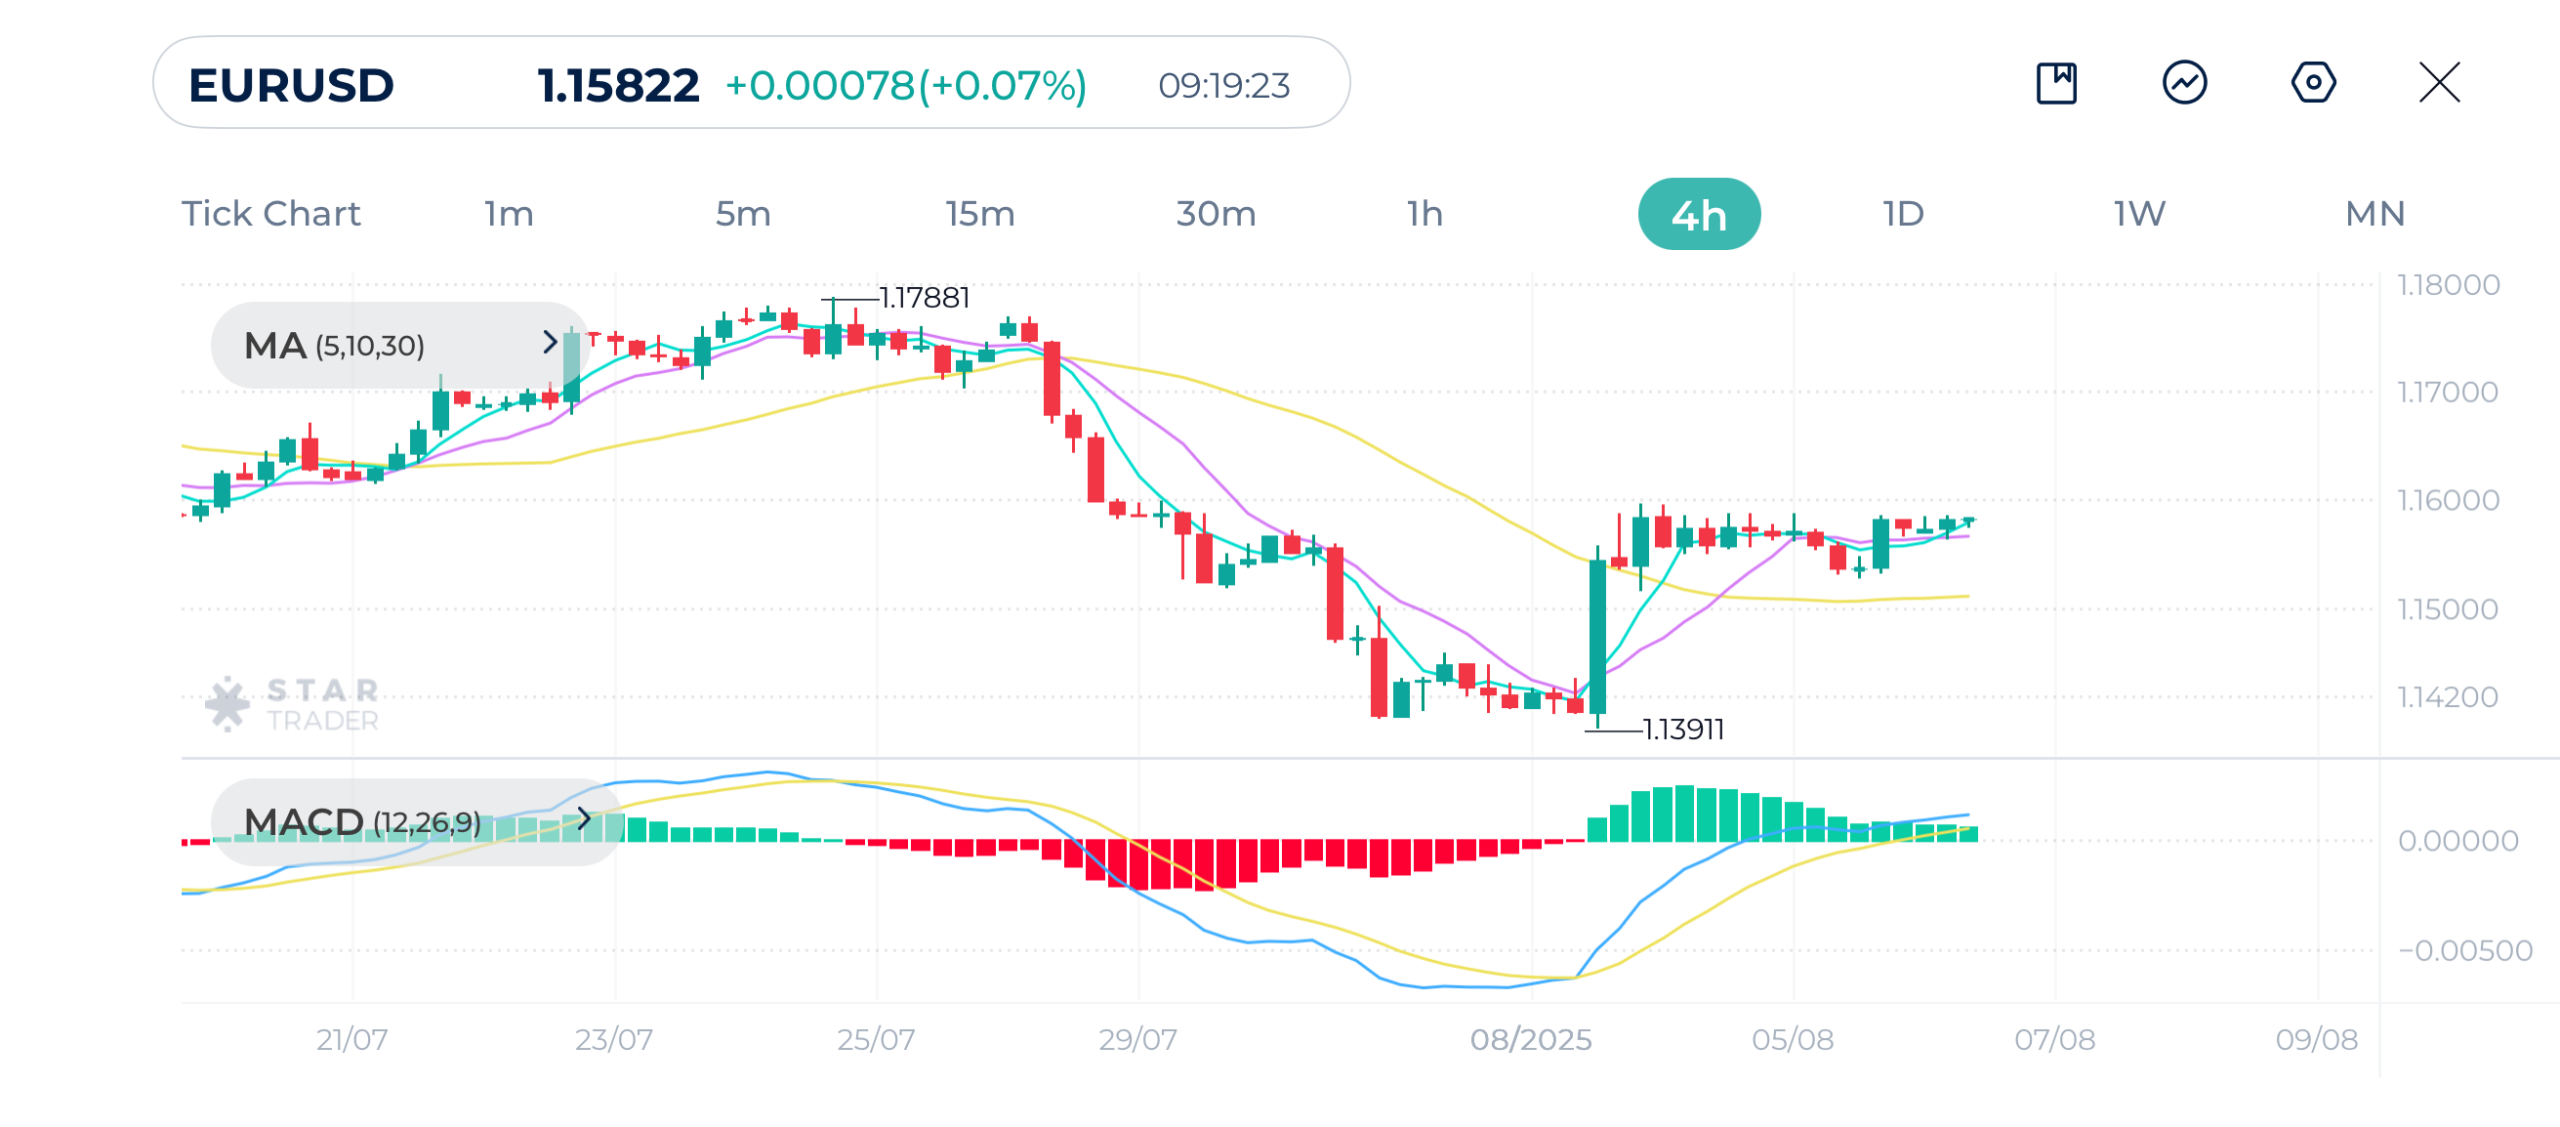
| Resistance | 1.1610 | 1.1638 | 1.1704 |
| Support | 1.1528 | 1.1473 | 1.1392 |
Tags
Open Live Account
Please enter a valid country
No results found
No results found
Please enter a valid email
Please enter a valid verification code
1. 8-16 characters + numbers (0-9) 2. blend of letters (A-Z, a-z) 3. special characters (e.g, !a#S%^&)
Please enter the correct format
Please tick the checkbox to proceed
Please tick the checkbox to proceed
Important Notice
STARTRADER does not accept any applications from Australian residents.
To comply with regulatory requirements, clicking the button will redirect you to the STARTRADER website operated by STARTRADER PRIME GLOBAL PTY LTD (ABN 65 156 005 668), an authorized Australian Financial Services Licence holder (AFSL no. 421210) regulated by the Australian Securities and Investments Commission.
CONTINUEImportant Notice for Residents of the United Arab Emirates
In alignment with local regulatory requirements, individuals residing in the United Arab Emirates are requested to proceed via our dedicated regional platform at startrader.ae, which is operated by STARTRADER Global Financial Consultation & Financial Analysis L.L.C.. This entity is licensed by the UAE Capital Market Authority (CMA) under License No. 20200000241, and is authorised to introduce financial services and promote financial products in the UAE.
Please click the "Continue" button below to be redirected.
CONTINUEError! Please try again.

