


Gold Technical Analysis
Gold has shown a bounce from $3,311 support, but the momentum is now fading. The price temporarily broke above the 30-period moving average, but the latest candles show rejection and push lower.
MACD has turned red, signaling loss of bullish momentum, while the MACD line is crossing down against the signal line.
If gold fails to hold above $3,325 resistance, it risks retesting $3,310–$3,315 support levels. Important resistance remains around $3,375.
The recent movemtns on gold appear to be short-term pullback within a broader sideways range.
Gold (XAUUSD) 1H Chart
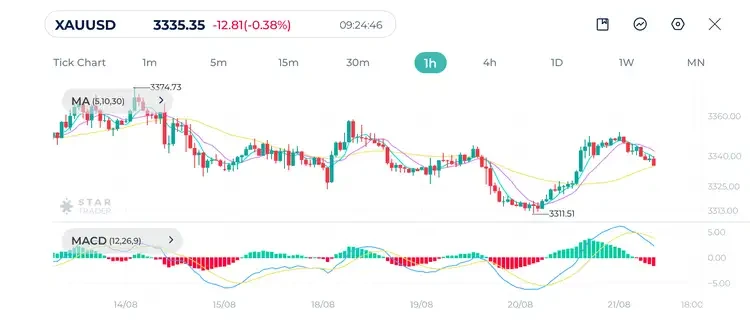
| Resistance | $3,345 | $3,358 | $3,400 |
| Support | $3,320 | $3,311 | $3,275 |
NZDUSD Technical Analysis
NZDUSD pair is in a clear downtrend on the hourly chart. Price has consistently remained under the 30-period moving average. Moving averages MA(50) and MA(10) continue to track sharply lower.
MACD is negative, but showing a small reduction in downside momentum, suggesting the pair is consolidating near 0.5810 after the steep fall.
Resistance is near 0.5860, while a break below 0.5800 could lead to further declines toward 0.5750. For now, trends remain bearish, but short-term consolidation is developing. As long as price remains below 30-period moving average, the bearish trend remains intact.
NZDUSD 1H Chart
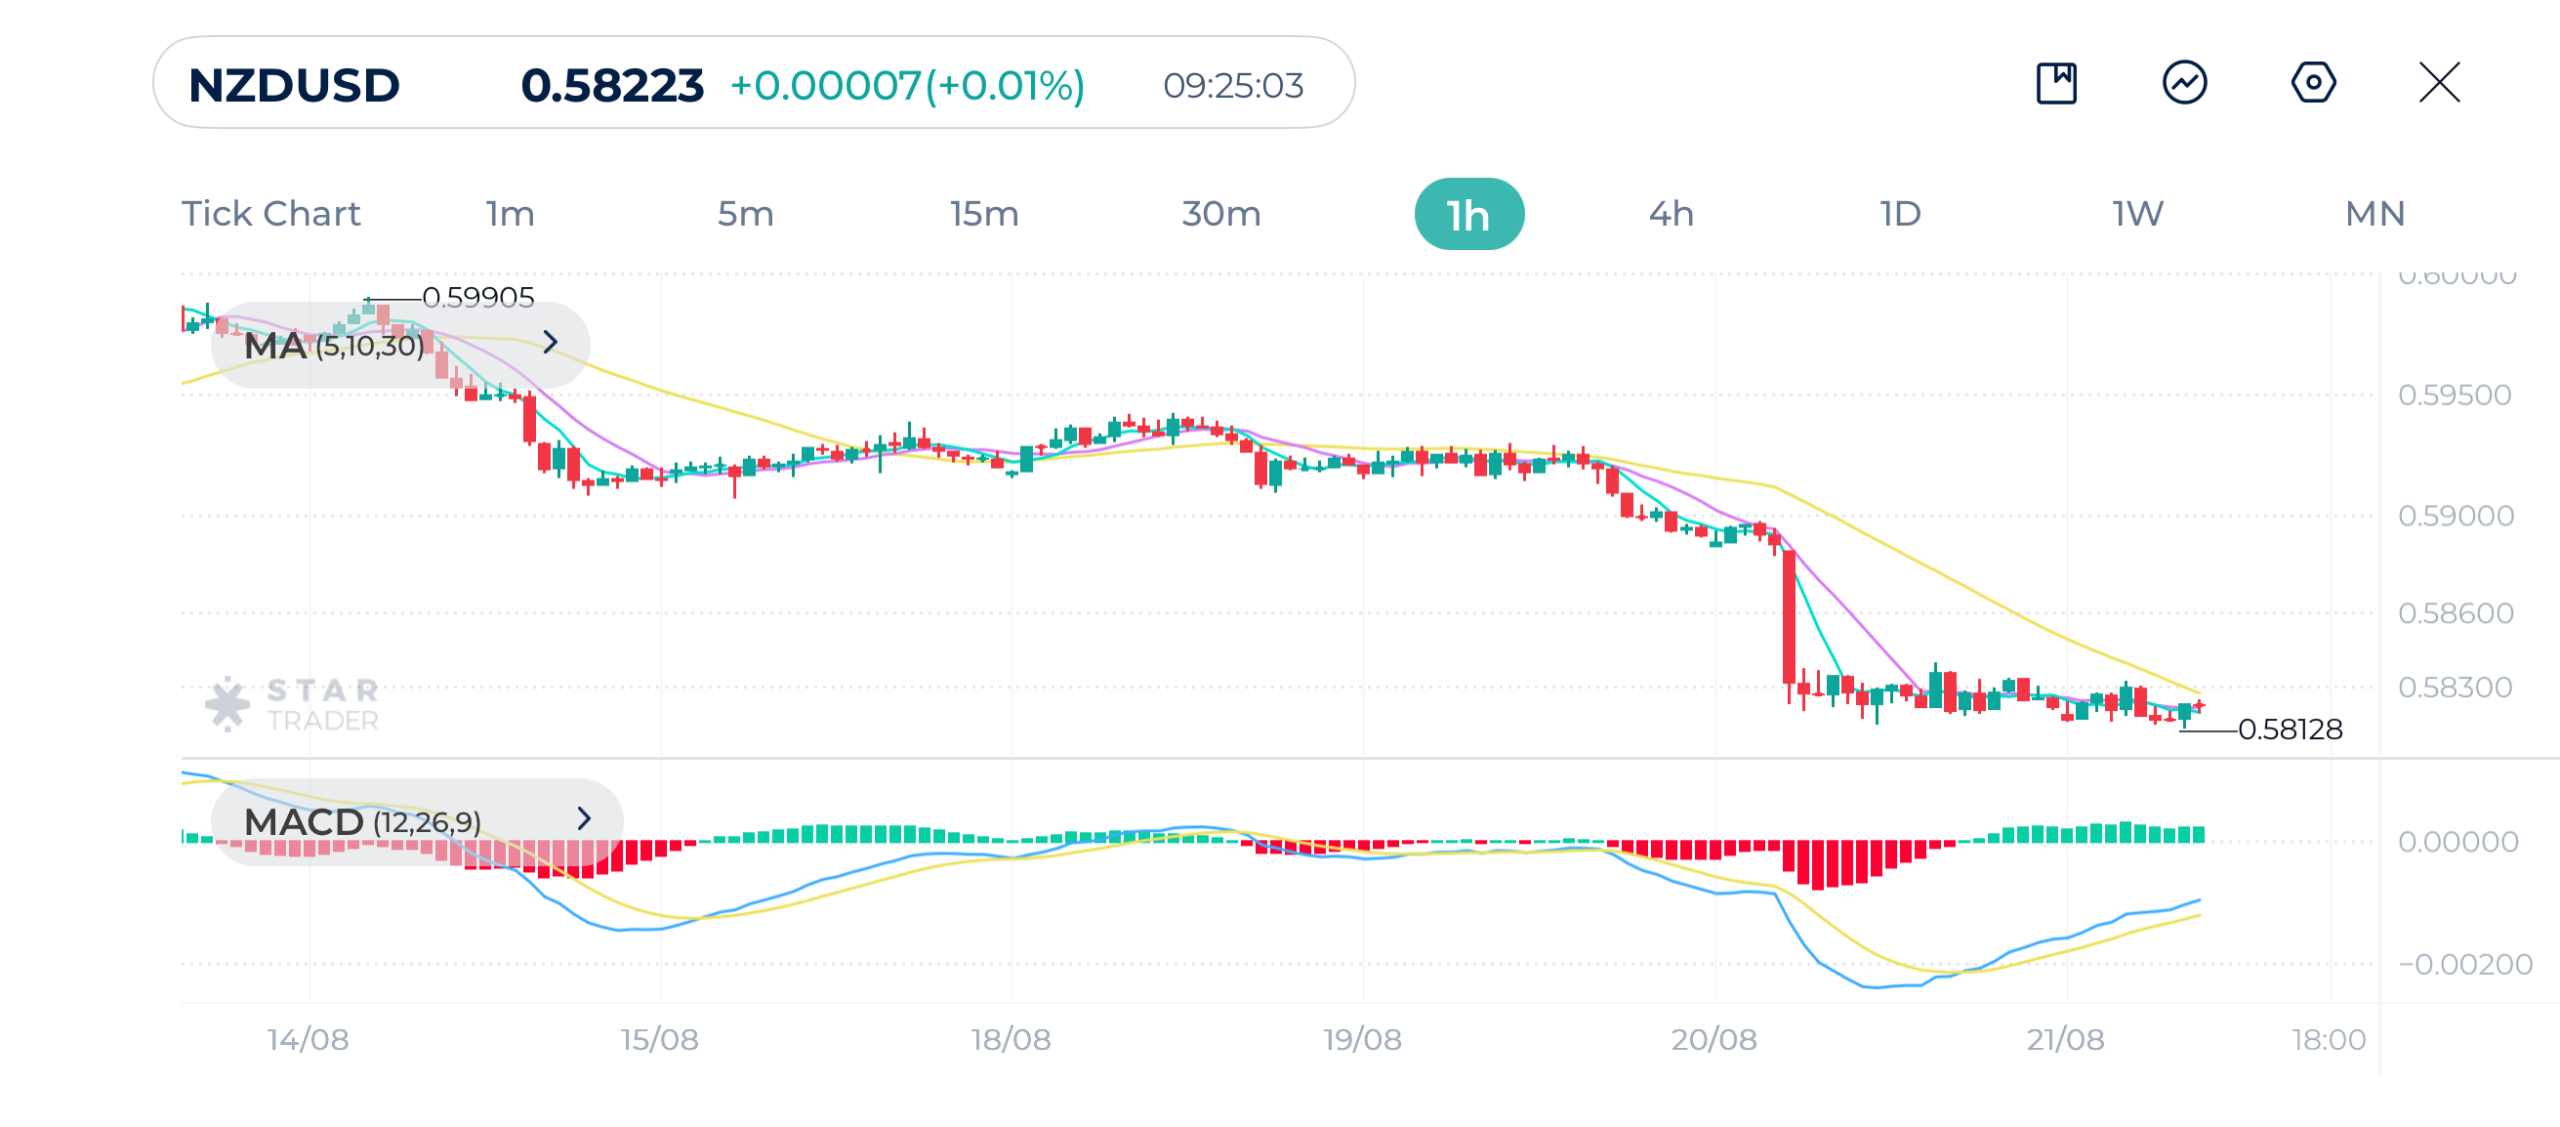
| Resistance | 0.5840 | 0.5897 | 0.5964 |
| Support | 0.5813 | 0.5767 | 0.5723 |
Bitcoin Technical Analysis
Bitcoin is showing a short-term sideways to slightly bearish structure following the steep decline during the week. The 5- and 10-period moving averages recently crossed below the 30-MA, which highlights near-term selling pressure.
MACD has been positive but is now flattening, and showing an early sign of weakening bullish momentum. Support appears near $112,800, while resistance lies around $116,000–$118,000.
Unless bitcoin price can hold above its support and reclaim the short-term averages, a further downside toward $110,000 psychological support level is possible.
BTCUSD 1H Chart
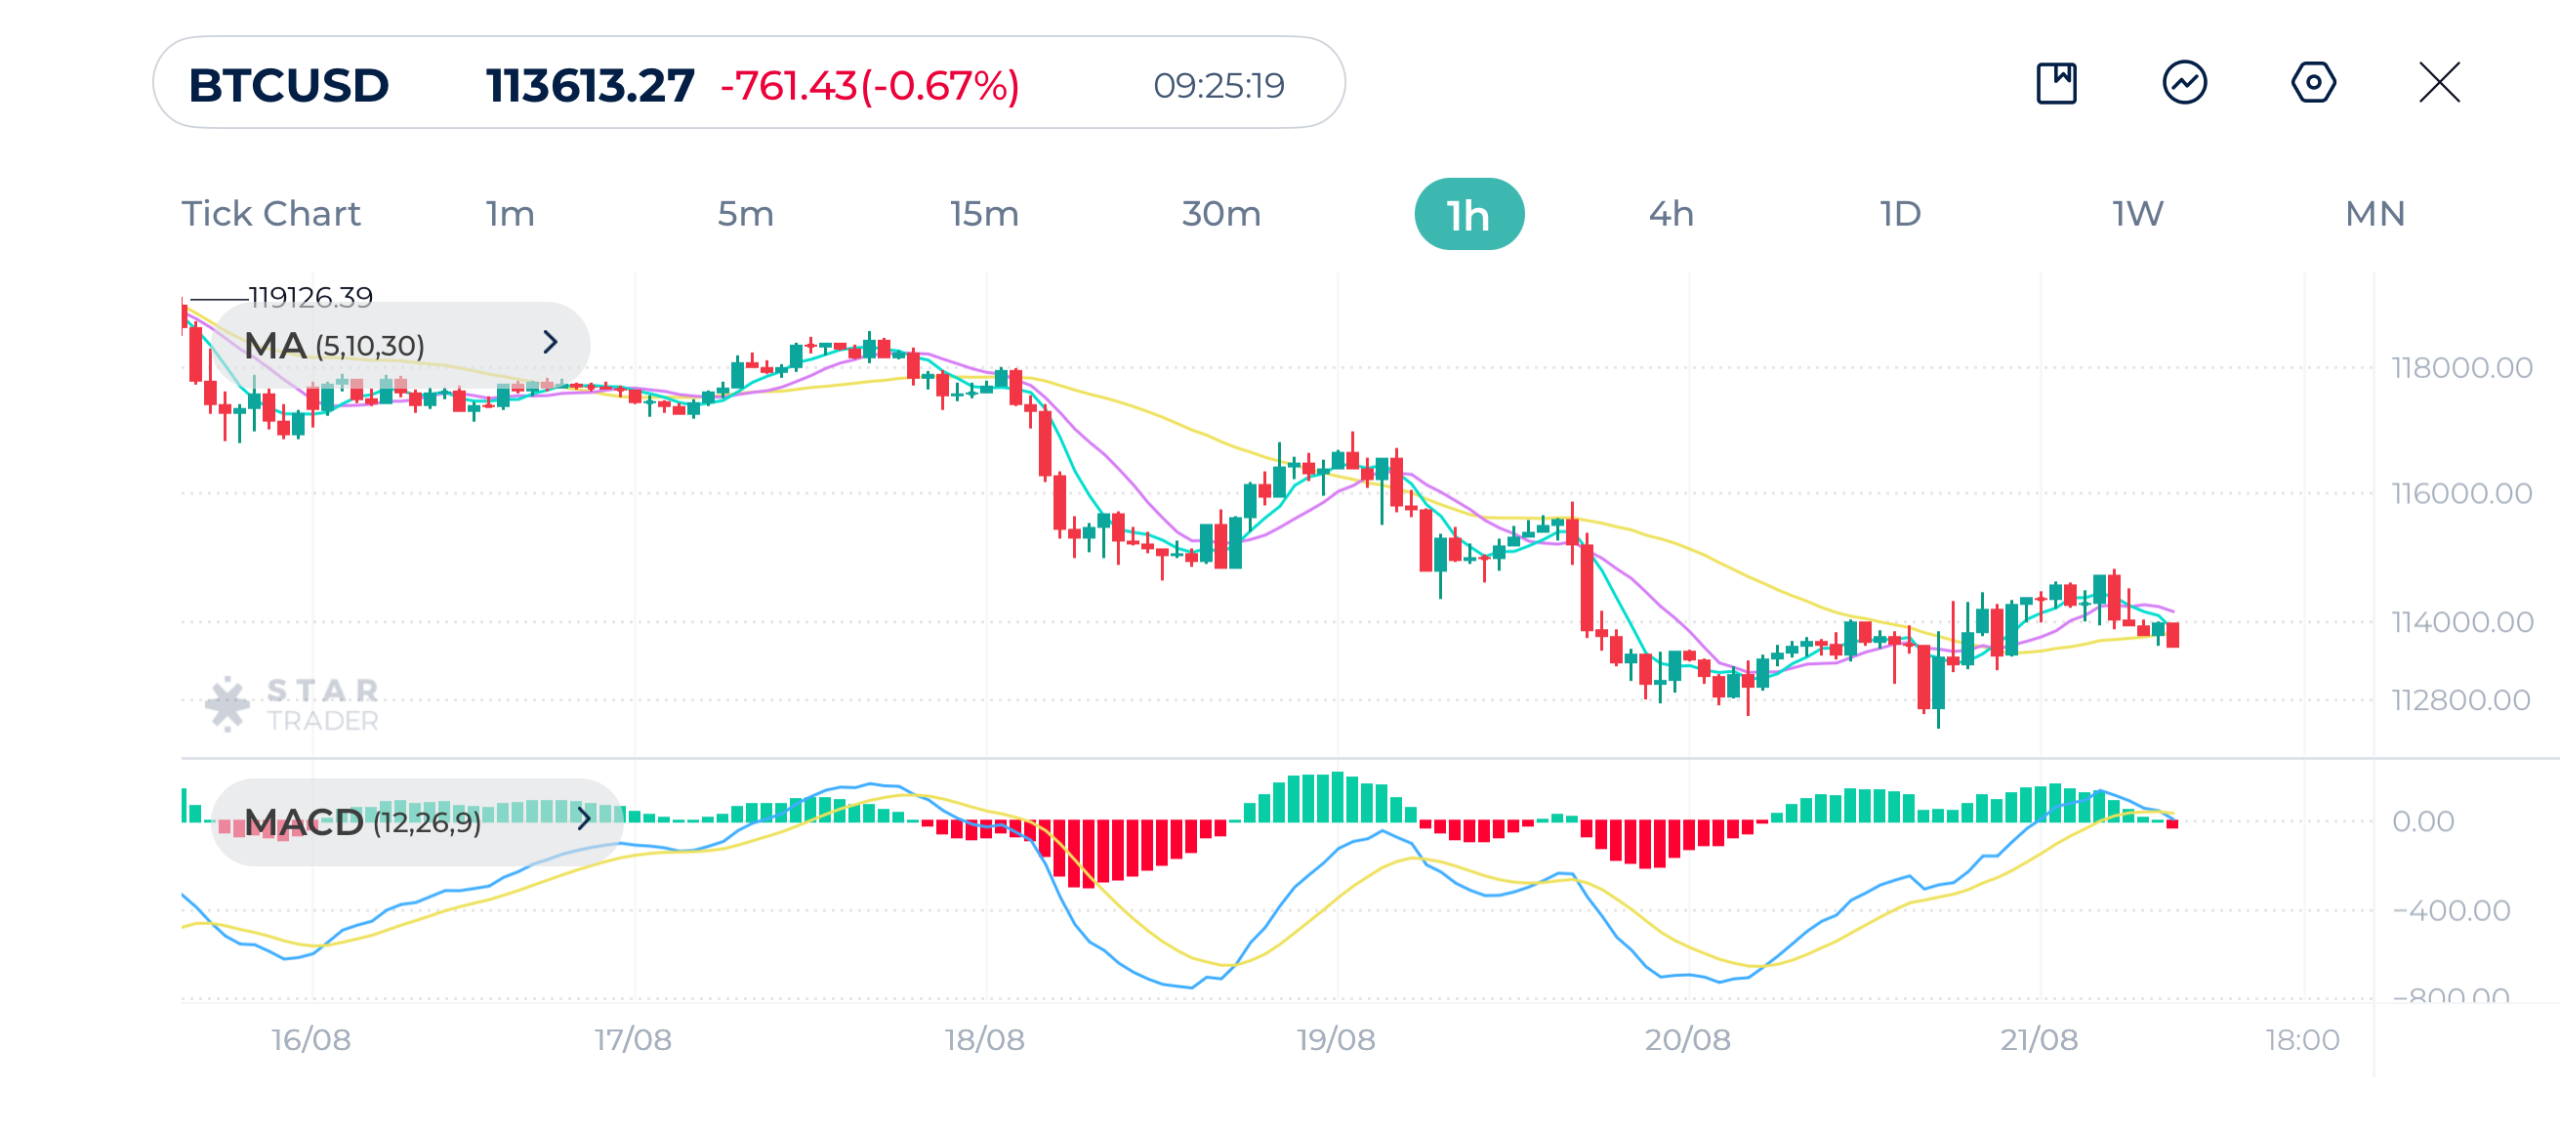
| Resistance | $114,808 | $115,913 | $117,029 |
| Support | $112,387 | $111,614 | $109,872 |
Tags
Open Live Account
Please enter a valid country
No results found
No results found
Please enter a valid email
Please enter a valid verification code
1. 8-16 characters + numbers (0-9) 2. blend of letters (A-Z, a-z) 3. special characters (e.g, !a#S%^&)
Please enter the correct format
Please tick the checkbox to proceed
Please tick the checkbox to proceed
Important Notice
STARTRADER does not accept any applications from Australian residents.
To comply with regulatory requirements, clicking the button will redirect you to the STARTRADER website operated by STARTRADER PRIME GLOBAL PTY LTD (ABN 65 156 005 668), an authorized Australian Financial Services Licence holder (AFSL no. 421210) regulated by the Australian Securities and Investments Commission.
CONTINUEImportant Notice for Residents of the United Arab Emirates
In alignment with local regulatory requirements, individuals residing in the United Arab Emirates are requested to proceed via our dedicated regional platform at startrader.ae, which is operated by STARTRADER Global Financial Consultation & Financial Analysis L.L.C.. This entity is licensed by the UAE Capital Market Authority (CMA) under License No. 20200000241, and is authorised to introduce financial services and promote financial products in the UAE.
Please click the "Continue" button below to be redirected.
CONTINUEError! Please try again.

