








 Web Trader MT5













Dow Jones Technical Analysis
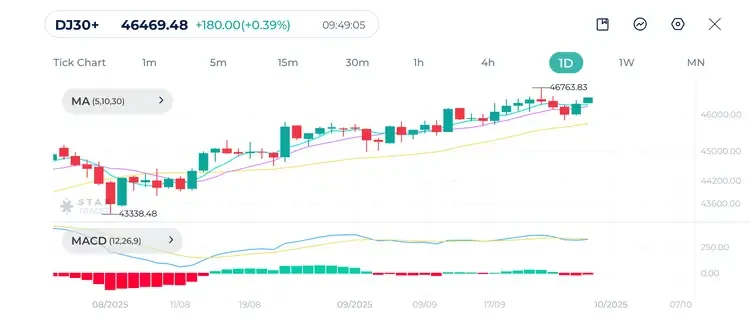
Dow Jones has been in a steady uptrend since rebounding from the 43,338 level in August. Price is consistently holding above the short-term moving averages MA(5) and MA(10) and medium-term moving average MA(30), confirming bullish momentum.
The 5-day moving average is above the 10-day and 30-day moving averages, indicating bullish alignment.
As long as price remains above the 30-day moving average, the uptrend remains intact.
MACD is currently positive, but signaling a possible short-term consolidation before further upside.
Bullish bias remains strong on the index. A daily close above 46,763 could trigger another leg higher. However, breakdown below 45,600 risks correction to 44,800.
Dow Jones Daily Chart
| Resistance | 46,457 | 46,544 | 46,720 |
| Support | 46,300 | 46,200 | 46,047 |
EURUSD Technical Analysis
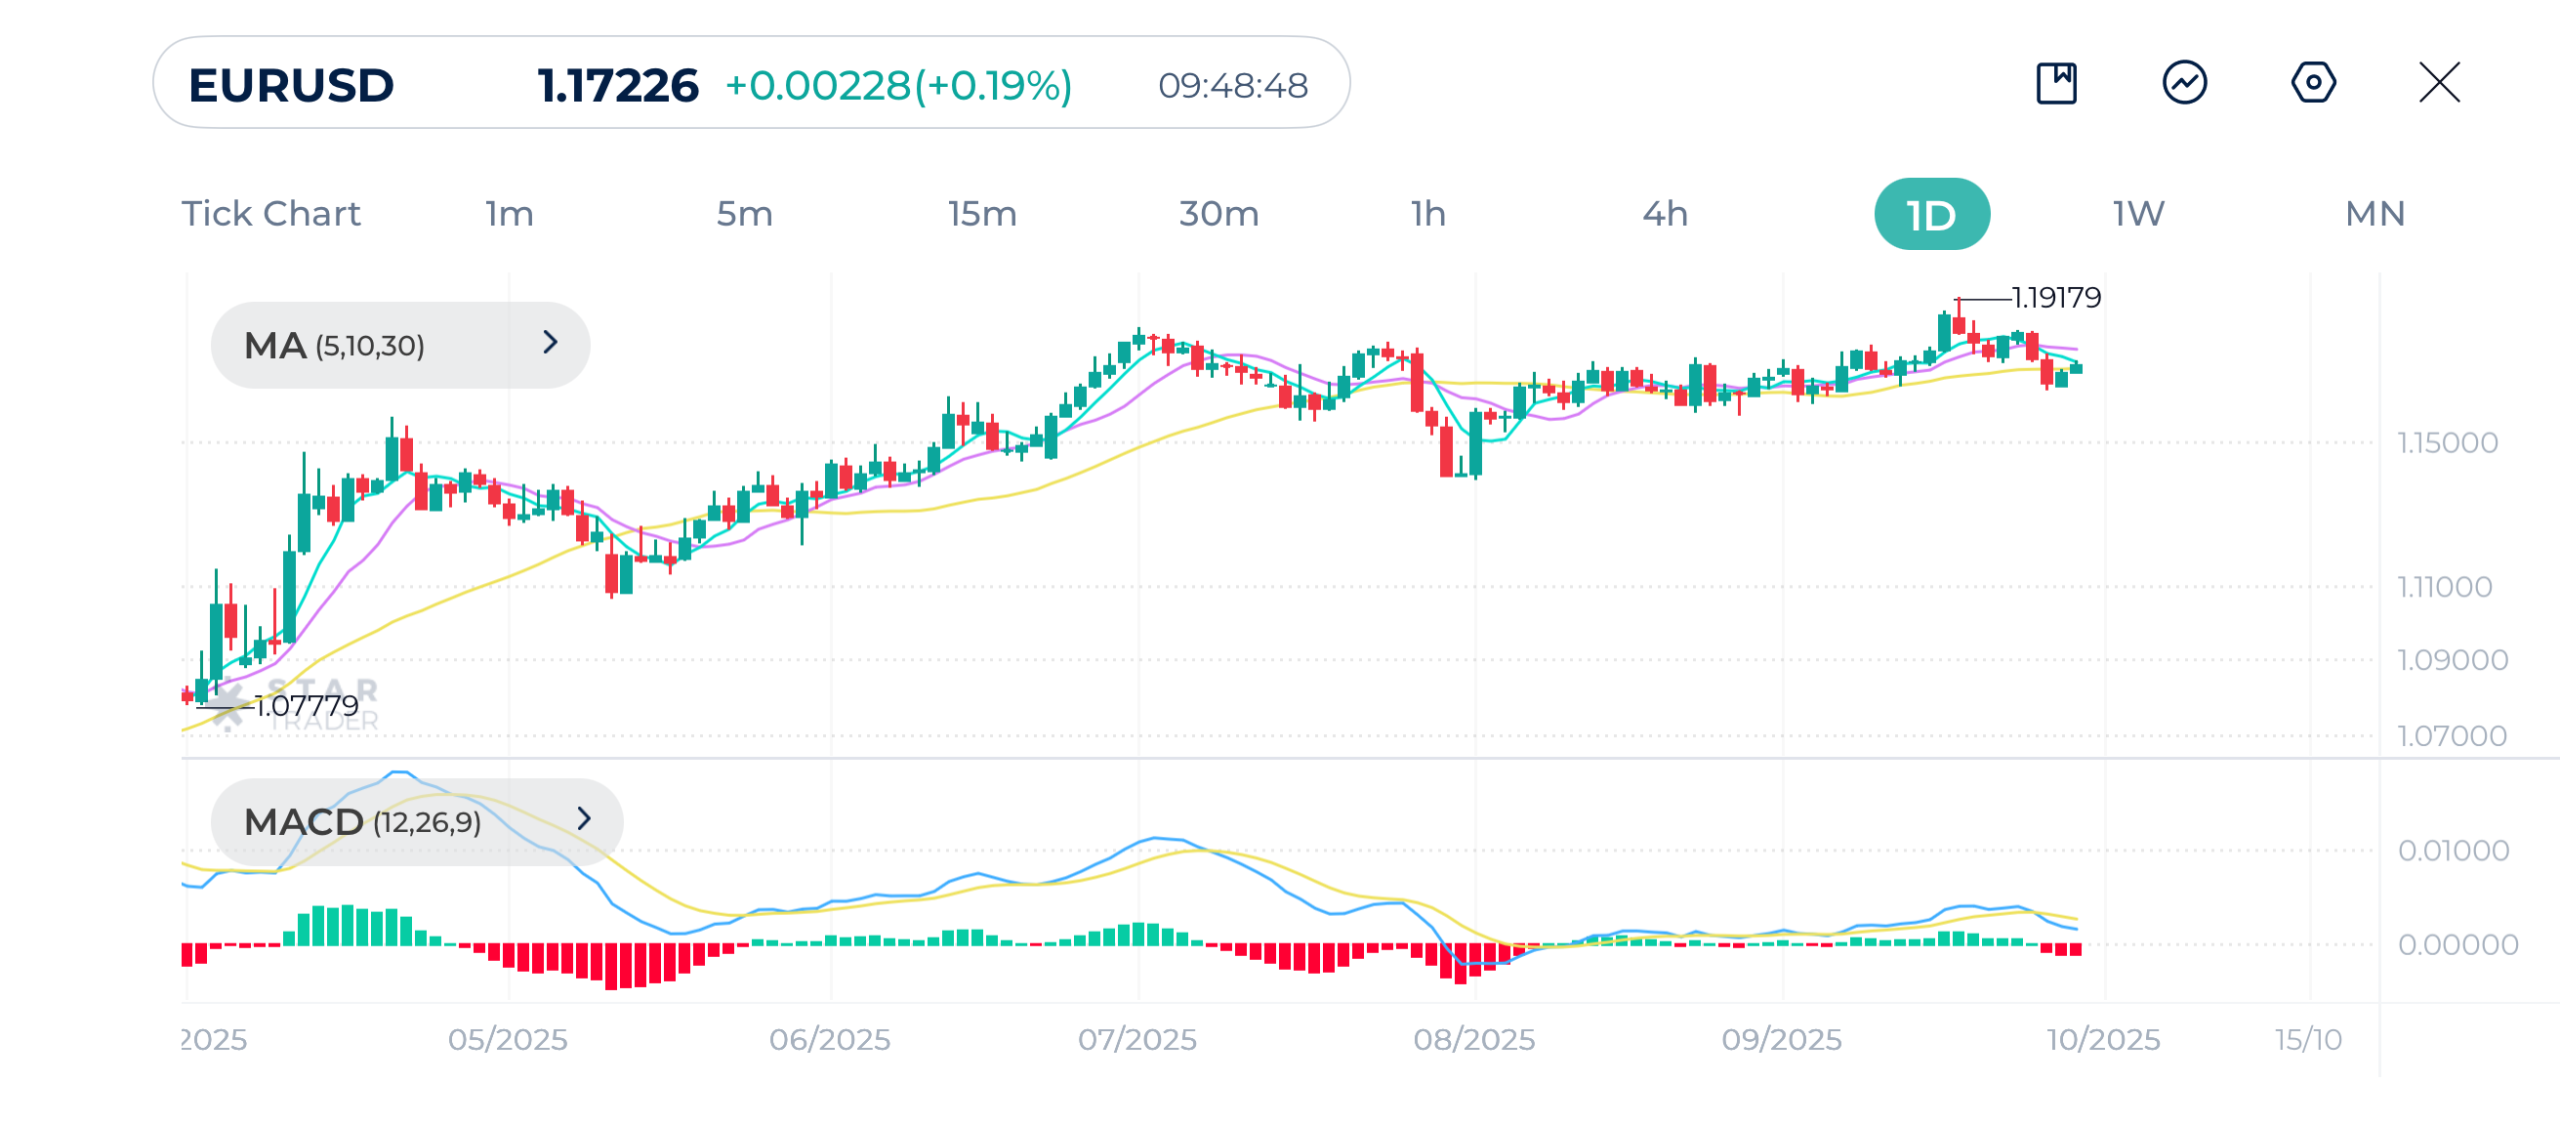
EURUSD continues its uptrend since the beginning of the year, but is currently facing consolidation after failing to sustain above 1.1918
Price is testing the 30-day moving average around 1.1680. The 5 and 10-day moving averages are turning sideways, showing loss of momentum.
MACD shows bearish crossover forming, with histogram in negative territory, indicating short-term downside pressure.
The pair is consolidating in a sideways channel (1.1680 – 1.1918). Long wicks indicate indecision and rejection near resistance.
Short-term bias is neutral to bearish unless 1.1800 is reclaimed. A break below 1.1680 opens the way to 1.1500.
EURUSD Daily Chart
| Resistance | 1.1730 | 1.1756 | 1.1800 |
| Support | 1.1700 | 1.1662 | 1.1640 |
Gold Technical Analysis
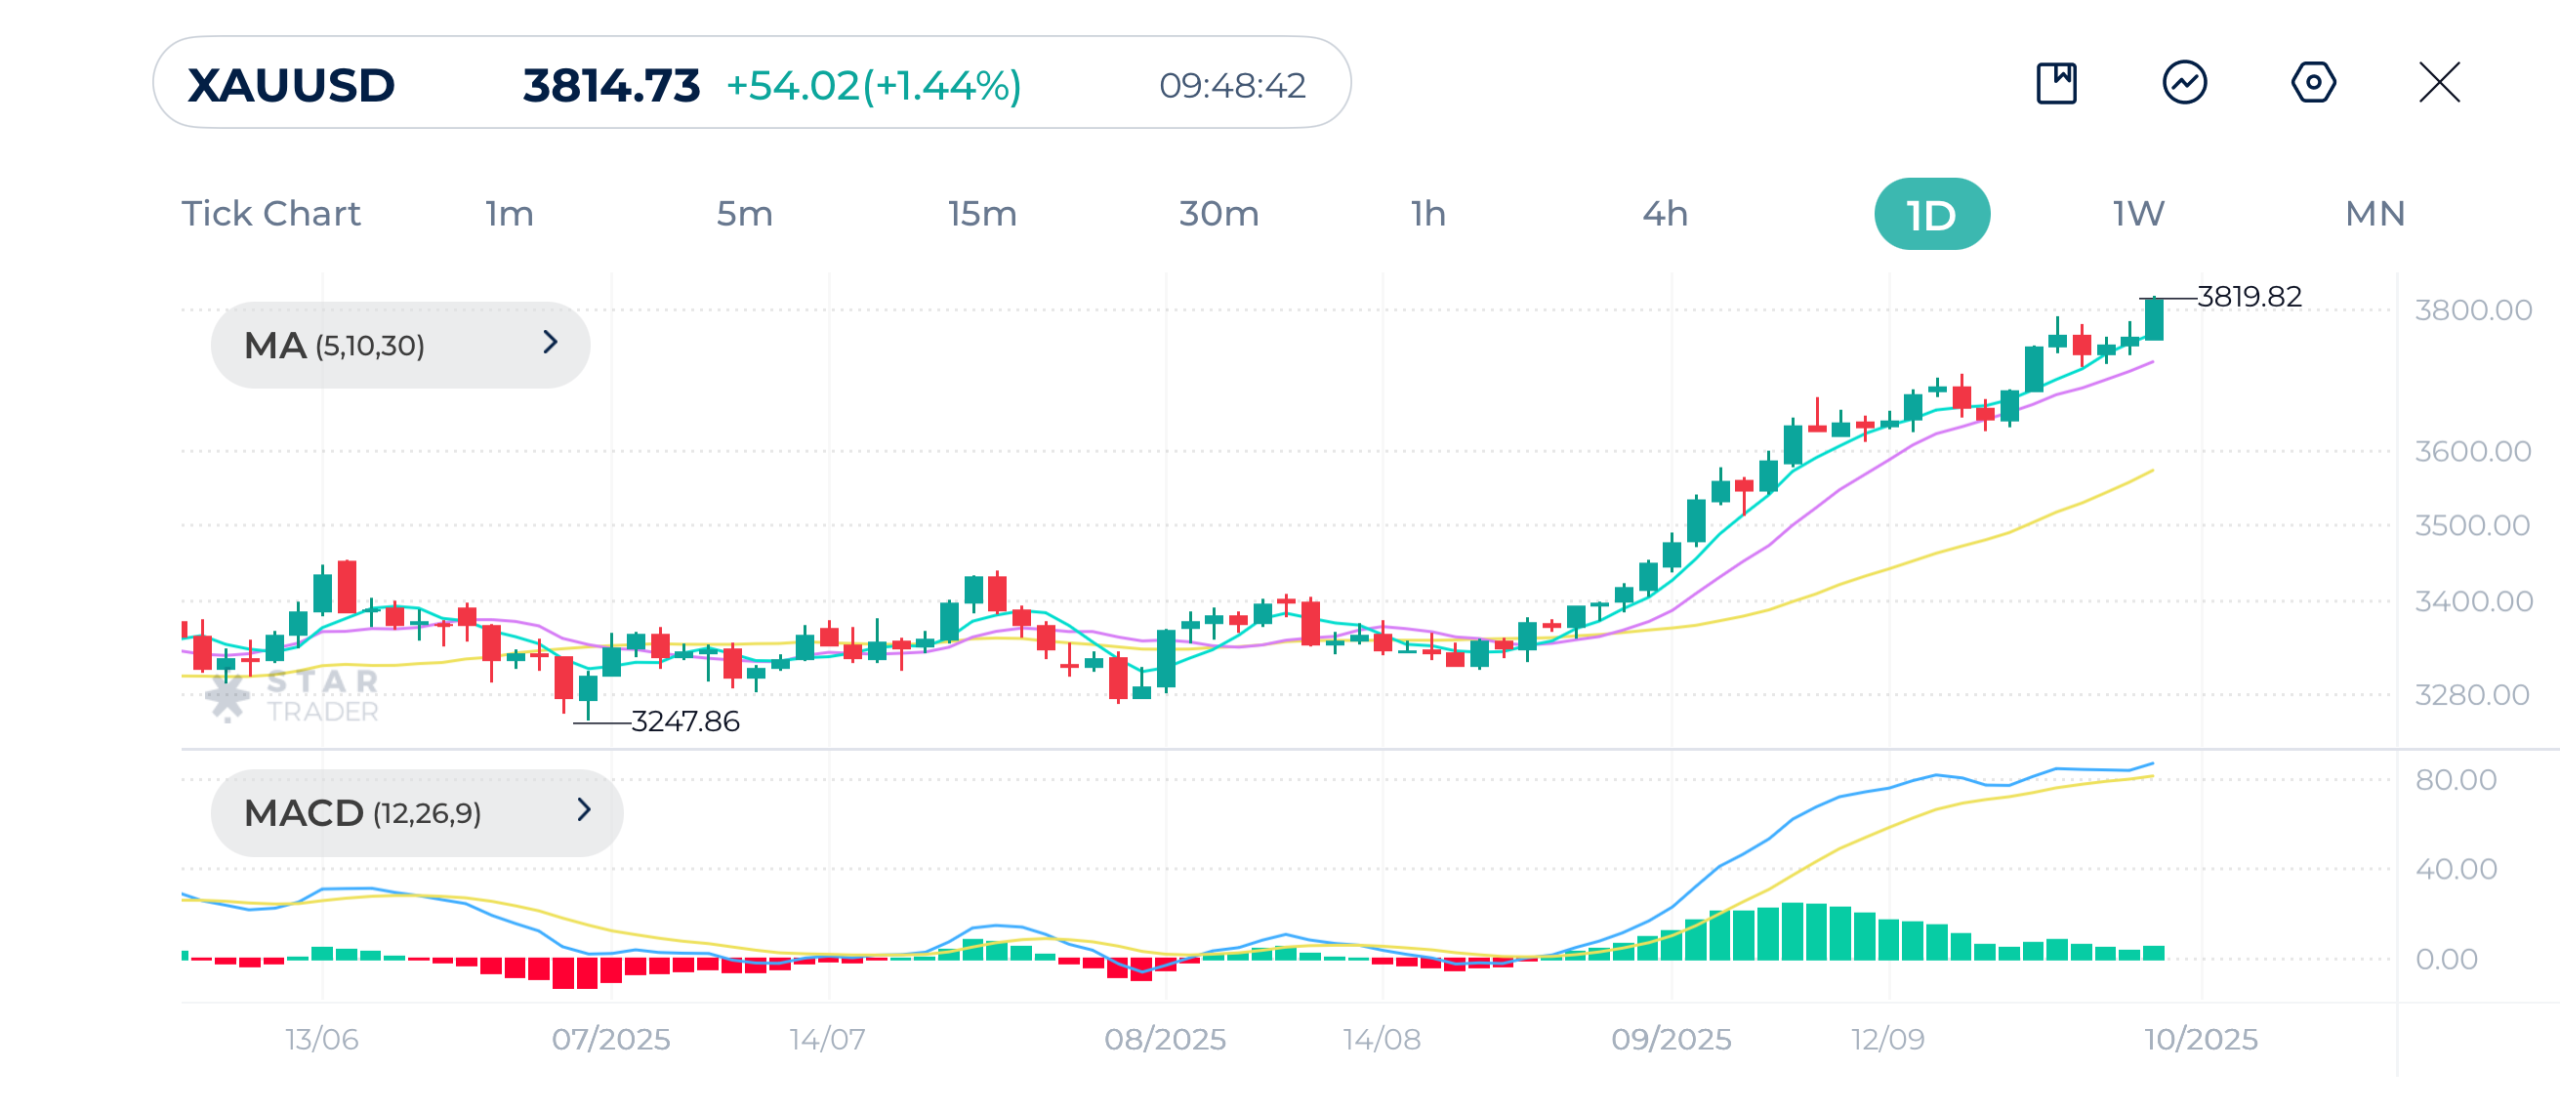
The daily chart of gold shows a strong bullish trend since July. Price is making higher highs and higher lows, sitting near all-time highs at 3,819
5-day moving average is above 10 and 30-day MAs, showing strong momentum. All moving averages are trending upwards, confirming bullish trend strength.
MACD shows very strong momentum, both signal and MACD lines are elevated. Histogram shows a minor slowdown but remains positive.
Recent candles are large-bodied and bullish, showing strong demand. No major reversal signs yet, though overbought conditions may cause a pullback.
Bullish trend continuation is likely if 3,820 breaks. Pullbacks toward 3,750–3,680 could offer strong buying opportunities.
Gold (XAUUSD) Daily Chart
| Resistance | $3,825 | $3,850 | $3,875 |
| Support | $3,800 | $3,764 | $3,750 |
Tags


Open Live Account
 Email Address
 Phone Number
Important Notice
STARTRADER does not accept any applications from Australian residents.
To comply with regulatory requirements, clicking the button will redirect you to the STARTRADER website operated by STARTRADER PRIME GLOBAL PTY LTD (ABN 65 156 005 668), an authorized Australian Financial Services Licence holder (AFSL no. 421210) regulated by the Australian Securities and Investments Commission.
Important Notice for Residents of the United Arab Emirates
In alignment with local regulatory requirements, individuals residing in the United Arab Emirates are requested to proceed via our dedicated regional platform at startrader.ae, which is operated by STARTRADER Global Financial Consultation & Financial Analysis L.L.C.. This entity is licensed by the UAE Capital Market Authority (CMA) under License No. 20200000241, and is authorised to introduce financial services and promote financial products in the UAE.
Please click the "Continue" button below to be redirected.


