


Gold Technical Analysis
Gold continues to display strong bullish dominance on the 1-hour chart, trading above $5,090 after recently printing highs near the $5,110 area. The broader structure remains bullish, with higher highs and higher lows clearly intact following the breakout above the $4,950–$5,000 zone. The recent pullback from highs has been shallow and controlled. However, silver experienced a stronger correction yesterday of 13%, bringing prices down to the $101.00 level. The precious metal has since reclaimed the $113 level.
The moving averages strongly support the bullish bias as seen on the hourly chart.
MACD has crossed below the signal line, indicating a temporary loss of bullish momentum after the strong impulse. However, the MACD is still well above the zero line, which suggests that the underlying trend remains bullish. As long as gold holds above the $5,030–$5,050 support zone, the current consolidation is likely to resolve to the upside.
Gold 1H Chart
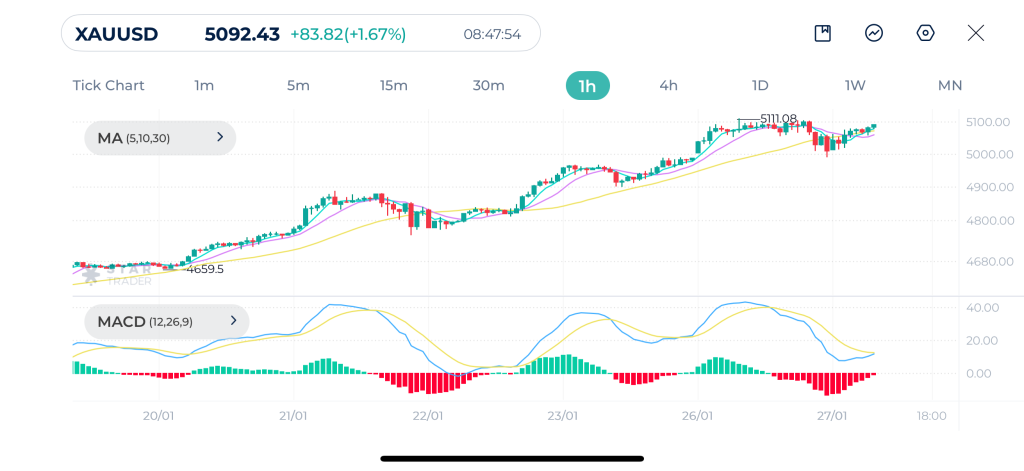
| Resistance | $5,111 | $5,125 | $5,150 |
| Support | $5,077 | $5,032 | $4,990 |
GBPUSD Technical Analysis
GBPUSD is trading near the 1.3700 area after a strong impulsive rally that started last week. This move broke a prior consolidation phase and shifted short-term market structure to bullish.
Price is trading above all three moving averages, all of which are sloping upward. As long as GBPUSD holds above the 1.3650–1.3660 area, the bullish structure remains intact.
Momentum, however, shows early signs of cooling. MACD has turned negative after a strong bullish expansion, and the MACD line is rolling below the signal line. This reflects short-term momentum loss, within a bullish trend. GBPUSD is in a healthy consolidation within an uptrend, and continuation toward new highs remains favored unless price breaks below the rising moving average structure.
GBPUSD 1H Chart
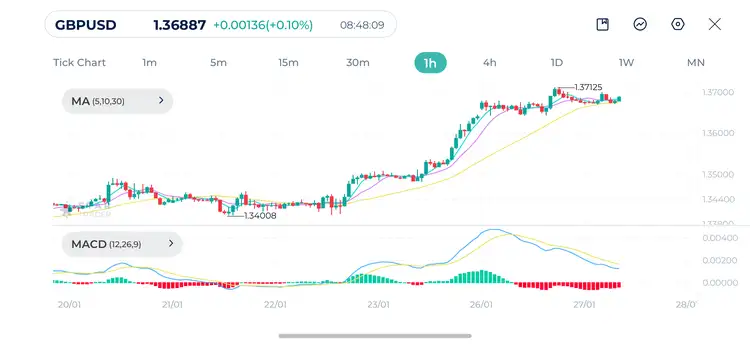
| Resistance | 1.3700 | 1.3730 | 1.3750 |
| Support | 1.3652 | 1.3607 | 1.3579 |
Nasdaq Technical Analysis
Nasdaq-100 is trading near 25,900, inching closer to its previous record high, effectively reclaiming prior resistance and shifting short-term structure back to bullish. The impulsive move higher was supported by strong momentum.
Price is moving above all three moving averages MA(5), MA(10), and MA(30). The moving averages are bullishly aligned, with the short term averages providing immediate support.
Momentum remains constructive. MACD is above the zero line, showing sustained bullish momentum even as price consolidates. While momentum is not accelerating aggressively, there are no signs of bearish divergence. Technically, a clean break above 25,950 would open the door for further upside extension, while pullbacks toward the rising moving averages are likely to be viewed as corrective within a bullish structure.
Nasdaq 1H Chart
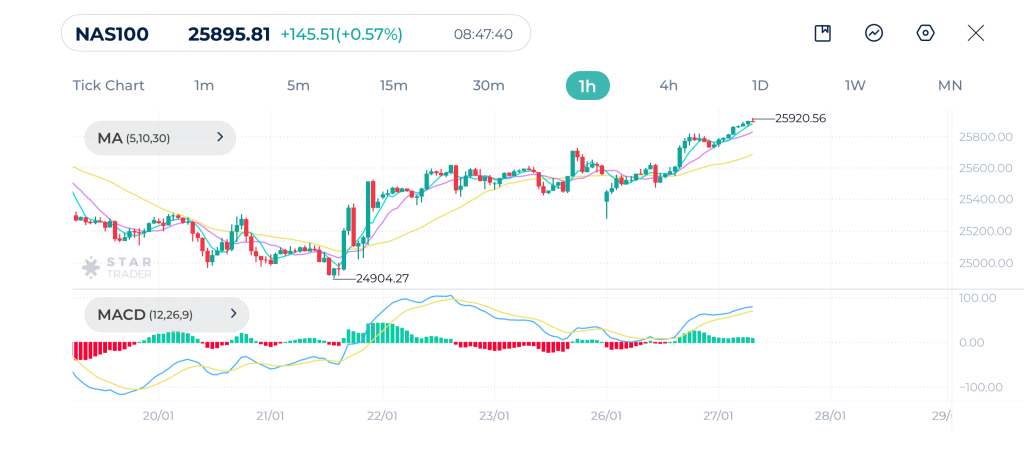
| Resistance | 25,924 | 26,000 | 26,120 |
| Support | 25,798 | 25,704 | 25,598 |
Tags
Open Live Account
Please enter a valid country
No results found
No results found
Please enter a valid email
Please enter a valid verification code
1. 8-16 characters + numbers (0-9) 2. blend of letters (A-Z, a-z) 3. special characters (e.g, !a#S%^&)
Please enter the correct format
Please tick the checkbox to proceed
Please tick the checkbox to proceed
Important Notice
STARTRADER does not accept any applications from Australian residents.
To comply with regulatory requirements, clicking the button will redirect you to the STARTRADER website operated by STARTRADER PRIME GLOBAL PTY LTD (ABN 65 156 005 668), an authorized Australian Financial Services Licence holder (AFSL no. 421210) regulated by the Australian Securities and Investments Commission.
CONTINUEImportant Notice for Residents of the United Arab Emirates
In alignment with local regulatory requirements, individuals residing in the United Arab Emirates are requested to proceed via our dedicated regional platform at startrader.ae, which is operated by STARTRADER Global Financial Consultation & Financial Analysis L.L.C.. This entity is licensed by the UAE Capital Market Authority (CMA) under License No. 20200000241, and is authorised to introduce financial services and promote financial products in the UAE.
Please click the "Continue" button below to be redirected.
CONTINUEError! Please try again.

