


Gold Technical Analysis
Gold broke to a new record high above $4,690 today. Price continues to create higher highs and higher lows, which confirms that the prevailing trend remains firmly bullish.
Moving averages strongly support this view, as price is trading above the moving averages MA(5), MA(10), MA(30), all of which are positively aligned and sloping upward. The 5-period moving average is currently acting as immediate dynamic support, reinforcing trend strength.
MACD shows a strong bullish crossover. This reflects increasing bullish momentum. Resistance is currently concentrated around the $4,690–$4,700 region, which represents the recent high and a psychological level, while support lies near the breakout zone around $4,630, followed by the more significant structural support near $4,600. As long as gold holds above these support levels, the bullish trend is likely to continue.
Gold 1H Chart
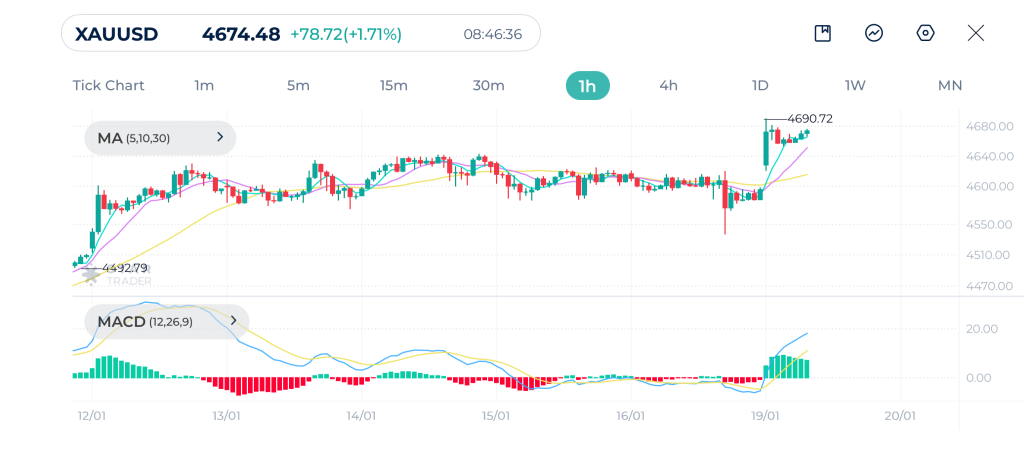
| Resistance | $4,691 | $4,700 | $4,720 |
| Support | $4,654 | $4,640 | $4,620 |
EURUSD Technical Analysis
EURUSD is showing a short-term rebound following a clear intraday downtrend that dominated price action from January 13 to January 16. During that period, the pair printed a sequence of lower highs and lower lows, confirming bearish market structure.
Price has managed to reclaim the short term moving averages MA(5) and MA(10), indicating improving short-term momentum. However, the 30-period moving average remains slightly above current price and relatively flat, acting as dynamic resistance.
Momentum indicators support the idea of a recovery, as the MACD has crossed above its signal line. Technically, resistance is located around the 1.1645–1.1660 zone, which aligns with prior consolidation and the 30-period moving average, while immediate support lies near 1.1590 and the recent low at 1.1575.
As long as price holds above 1.1600, a test of higher resistance remains possible, but rejection near the 30-period average would likely lead to another pullback. Overall, EURUSD is best described as being in a corrective rebound within a broader bearish structure.
EURUSD 1H Chart
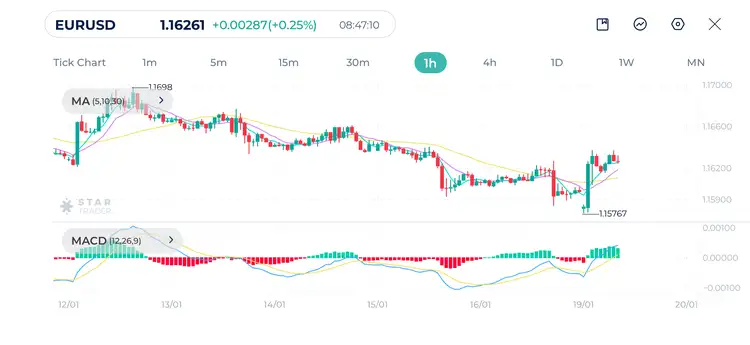
| Resistance | 1.1647 | 1.1677 | 1.1700 |
| Support | 1.1605 | 1.1584 | 1.1535 |
Bitcoin Technical Analysis
Bitcoin’s hourly chart shows a suddent shift in structure following a sharp bearish breakdown from a tight consolidation range.
Technically, price is now trading well below the moving averages, MA(5), MA(10), and MA(30), with the short-term averages sharply sloping lower. This alignment confirms strong downside momentum in the short term. Any recovery toward this moving average cluster is likely to attract selling interest unless price reclaims it with strength.
MACD indicates that downside momentum is accelerating, and there are currently no visible signs of bullish divergence.
The $93,800–$94,200 zone represents key resistance as it aligns with the broken consolidation range and moving average resistance. On the downside, $91,800 is acting as the immediate reaction low, with the next major support located near the psychological $90,500 area. Unless Bitcoin manages to reclaim the $94,000–$95,000 region, the short term overview is bearish.
Bitcoin 1H Chart
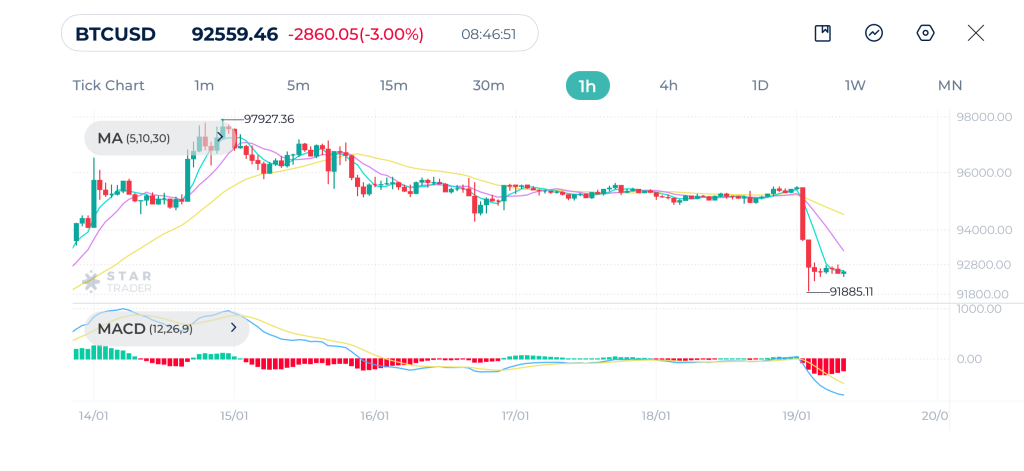
| Resistance | $93,114 | $94,020 | $94,581 |
| Support | $92,000 | $90,837 | $89,645 |
Tags
Open Live Account
Please enter a valid country
No results found
No results found
Please enter a valid email
Please enter a valid verification code
1. 8-16 characters + numbers (0-9) 2. blend of letters (A-Z, a-z) 3. special characters (e.g, !a#S%^&)
Please enter the correct format
Please tick the checkbox to proceed
Please tick the checkbox to proceed
Important Notice
STARTRADER does not accept any applications from Australian residents.
To comply with regulatory requirements, clicking the button will redirect you to the STARTRADER website operated by STARTRADER PRIME GLOBAL PTY LTD (ABN 65 156 005 668), an authorized Australian Financial Services Licence holder (AFSL no. 421210) regulated by the Australian Securities and Investments Commission.
CONTINUEImportant Notice for Residents of the United Arab Emirates
In alignment with local regulatory requirements, individuals residing in the United Arab Emirates are requested to proceed via our dedicated regional platform at startrader.ae, which is operated by STARTRADER Global Financial Consultation & Financial Analysis L.L.C.. This entity is licensed by the UAE Capital Market Authority (CMA) under License No. 20200000241, and is authorised to introduce financial services and promote financial products in the UAE.
Please click the "Continue" button below to be redirected.
CONTINUEError! Please try again.

