








 Web Trader MT5













Gold Technical Analysis
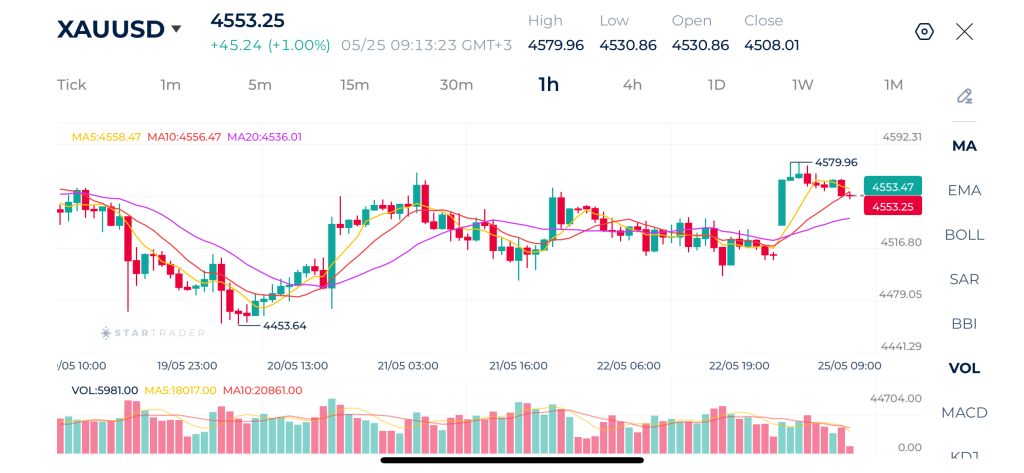
Gold is showing renewed bullish momentum on the 1-hour timeframe after rebounding strongly from the $4,453 support zone last week. Price recently reached a local high near $4,579 before entering a mild pullback phase.
The moving averages are currently aligned in a constructive manner, with the MA5 and MA10 hovering above or near the MA20, suggesting that bullish momentum remains intact on the short-term structure. As long as gold continues holding above the $4,530-$4,535 support zone, buyers may attempt another move toward $4,580 and potentially the psychological $4,600 region. A confirmed breakout above $4,580 would strengthen bullish continuation signals and could trigger additional upside momentum.
On the downside, failure to hold above the MA20 could weaken the bullish structure and expose the market to a deeper correction toward $4,515 and possibly $4,480. However, the broader short-term structure still favors buyers for now, particularly after the strong bullish impulse seen during the latest breakout leg.
Gold 1H Chart
| Resistance | $4,580 | $4,612 | $4,664 |
| Support | $4,534 | $4,91 | $4,466 |
Brent Technical Analysis
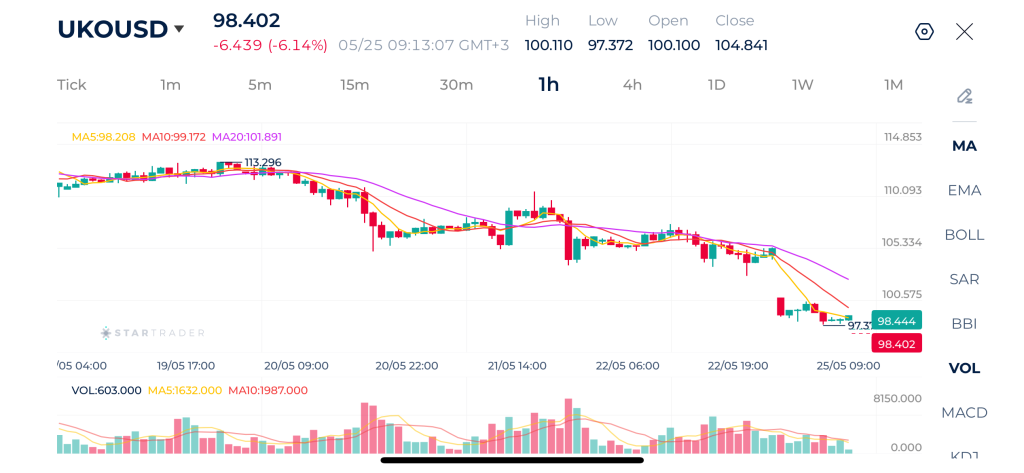
Crude oil is experiencing strong bearish momentum on the 1-hour timeframe, with the chart showing a clear sequence of lower highs and lower lows. The latest breakdown below the psychological $100 level confirms continued selling pressure, with price now trading near $98.40 after a steep decline. The moving averages are fully aligned bearishly, with the MA5 below the MA10 and both significantly below the MA20, reflecting strong downside momentum.
The area around $97.30 currently acts as immediate support after the recent low, but if this level breaks decisively, the market may continue falling toward $95.00 and potentially lower levels depending on broader market sentiment and geopolitical developments.
The first important recovery zone sits near $100.00-$101.90, where the MA20 is currently positioned. Any short-term rebound into that area may continue attracting selling pressure unless buyers can reclaim and sustain price above the MA20. Until that happens, the prevailing trend remains strongly bearish.
Brent 1H Chart
| Resistance | $100.00 | $101.90 | $103.27 |
| Support | $97.30 | $95.00 | $93.53 |
EURUSD Technical Analysis
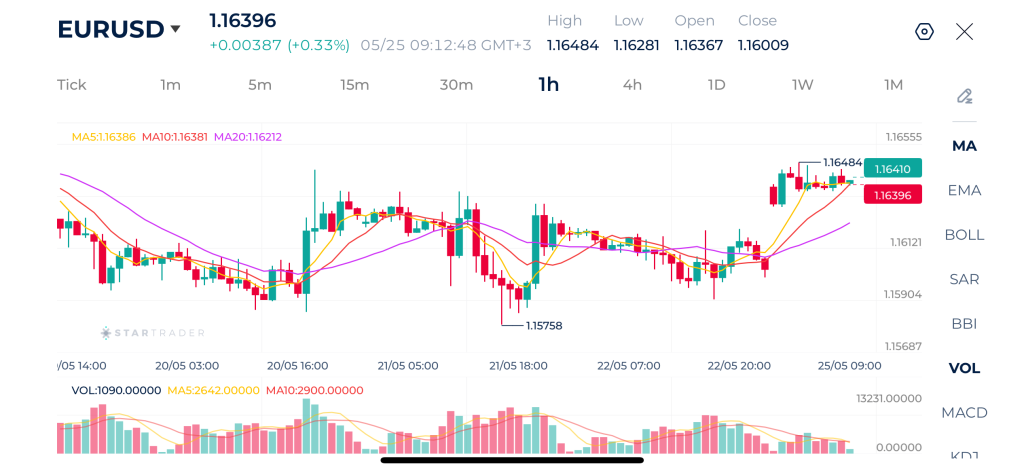
EURUSD is currently experiencing a short-term bullish reversal following a period of consolidation. After hitting a low of 1.1575, the price established a steady higher low structure and successfully broke out to the upside, reaching a recent high of 1.1648. The price action is currently stabilizing near the top of this recent expansion.
The short-term moving averages MA5 and MA10 have crossed above the longer-term MA20, signaling a classic moving average crossover that typically indicates a sustained upward trend.
For the bullish momentum to continue, the pair needs to clear the immediate resistance at 1.1648, which would open the door for a test of higher psychological levels around 1.1655. Conversely, if sellers pressure the pair back below the moving average cluster, the key support level to monitor is the prior consolidation zone near 1.1612 to prevent a total reversal of the current uptrend.
EURUSD 1H Chart
| Resistance | 1.1650 | 1.1675 | 1.1700 |
| Support | 1.1630 | 1.1600 | 1.1576 |
Risk Disclaimer: This material is provided for informational purposes only and does not constitute a recommendation or investment advice. Trading financial instruments on margin involves substantial risk and may not be appropriate for all investors.
Tags


Open Live Account
 Email Address
 Phone Number
Important Notice
STARTRADER does not accept any applications from Australian residents.
To comply with regulatory requirements, clicking the button will redirect you to the STARTRADER website operated by STARTRADER PRIME GLOBAL PTY LTD (ABN 65 156 005 668), an authorized Australian Financial Services Licence holder (AFSL no. 421210) regulated by the Australian Securities and Investments Commission.
Important Notice for Residents of the United Arab Emirates
In alignment with local regulatory requirements, individuals residing in the United Arab Emirates are requested to proceed via our dedicated regional platform at startrader.ae, which is operated by STARTRADER Global Financial Consultation & Financial Analysis L.L.C.. This entity is licensed by the UAE Capital Market Authority (CMA) under License No. 20200000241, and is authorised to introduce financial services and promote financial products in the UAE.
Please click the "Continue" button below to be redirected.


