








 Web Trader MT5













Gold Technical Analysis
Gold is currently in a bullish consolidation phase following a strong recovery from the $4,600–$4,650 support zone. After reaching the $5,090–$5,100 resistance area, price has shifted into consolidation.
The moving averages confirm that the bullish structure is still intact. Price remains above the 30-period moving average, which continues to slope upward and act as dynamic support. MA(5) and MA(10) have flattened and are converging with price, signaling consolidation. As long as gold holds above the $5,000–$4,980 zone, the bias remains bullish, with potential for another leg higher once momentum rebuilds.
MACD is hovering near the zero line, showing momentum compression. This setup often precedes a continuation move, and a bullish MACD turn would likely coincide with a renewed push toward recent highs.
Gold 1H Chart
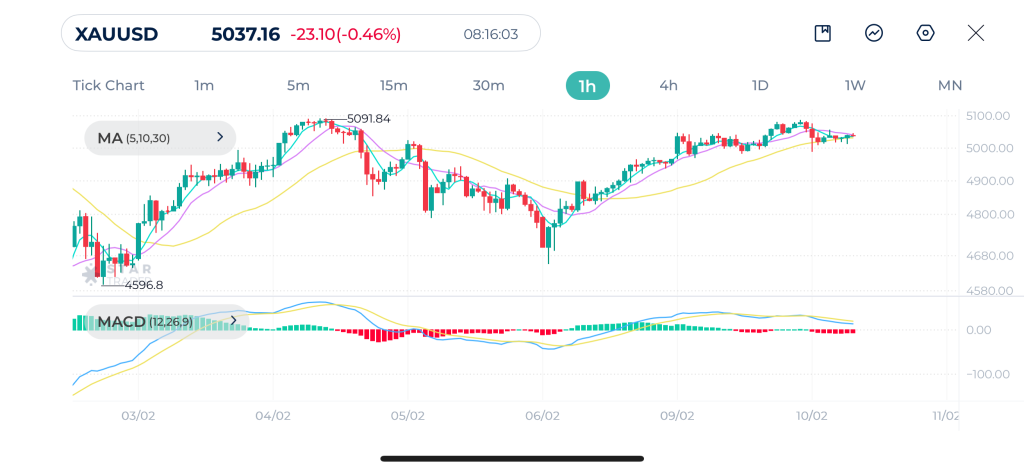
| Resistance | $5,055 | $5,100 | $5,305 |
| Support | $5,010 | $4,987 | $4,962 |
Dow Jones Technical Analysis
Dow Jones remains in a strong short-term uptrend, but price action near 50,300 suggests the market has entered a distribution or consolidation phase. The impulsive rally from 48,600 was decisive, yet recent candles show reduced range and overlapping bodies, signaling hesitation at elevated levels.
From a moving average perspective, the trend is still bullish but losing acceleration. Price is holding above the 30-period moving average, while MA(5) and MA(10) flattened and started to compress. A sustained hold above 49,900–50,000 keeps the bullish bias valid.
MACD has rolled over from its peak, and the histogram has slipped back into negative territory. This does not signal a trend reversal yet, but it does warn that upside momentum has faded, increasing the probability of either a deeper pullback or continued sideways movement before the next directional decision.
Dow Jones 1H Chart
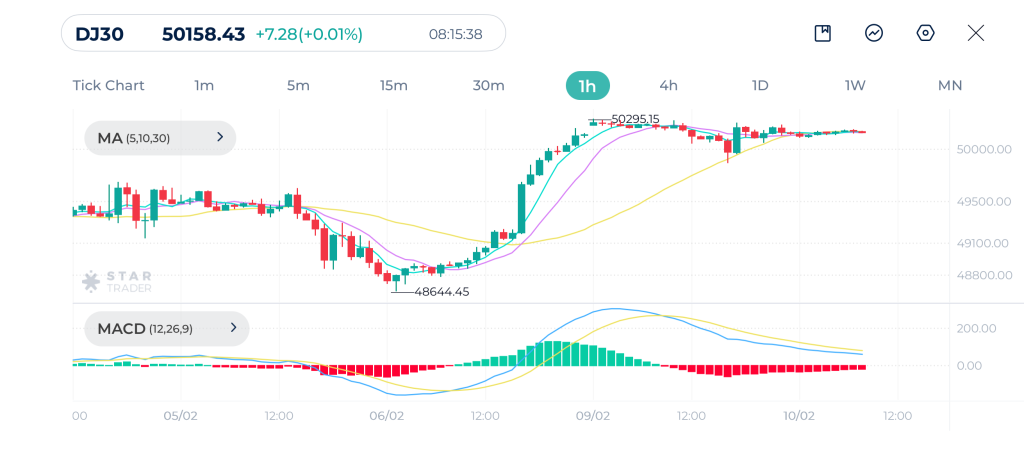
| Resistance | 50,215 | 50,252 | 50,300 |
| Support | 50,019 | 49,912 | 49,832 |
EURUSD Technical Analysis
EURUSD is maintaining a short-term bullish structure. The recent price action shows consolidation just below resistance level 1.1925, suggesting the market is absorbing supply.
The moving averages support this bullish bias. Price is trading above all three moving averages, with the 30-period moving average turning upward and acting as a solid base. MA(5) and MA(10) are slightly flattening, which is consistent with consolidation near resistance. As long as EURUSD remains above 1.1870–1.1850, the overall upward trend remains intact.
MACD has started to roll over. This indicates loss of upside momentum. A renewed MACD uptick would likely accompany a breakout above 1.1930, while a deeper MACD decline could open the door for a pullback toward the longer moving average MA(30)
EURUSD 1H Chart
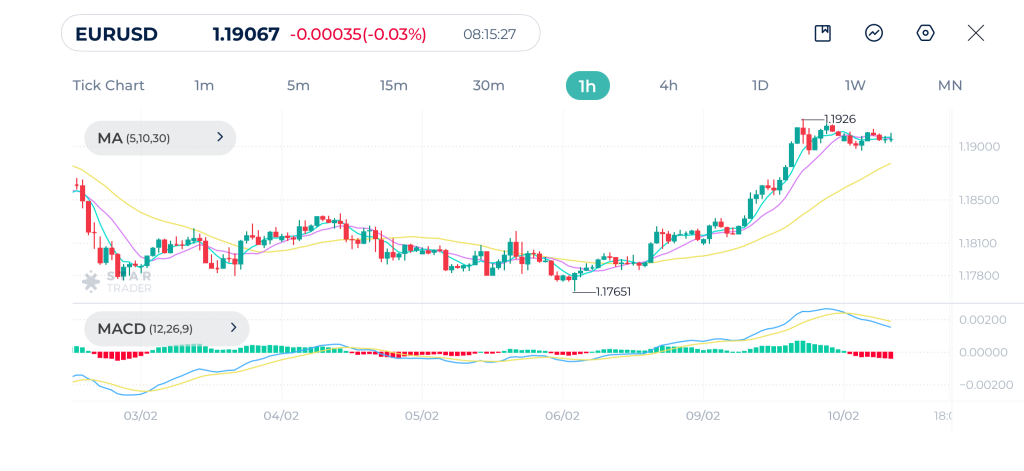
| Resistance | 1.1926 | 1.1956 | 1.2000 |
| Support | 1.1897 | 1.1867 | 1.1820 |
Tags


Open Live Account
 Email Address
 Phone Number
Important Notice
STARTRADER does not accept any applications from Australian residents.
To comply with regulatory requirements, clicking the button will redirect you to the STARTRADER website operated by STARTRADER PRIME GLOBAL PTY LTD (ABN 65 156 005 668), an authorized Australian Financial Services Licence holder (AFSL no. 421210) regulated by the Australian Securities and Investments Commission.
Important Notice for Residents of the United Arab Emirates
In alignment with local regulatory requirements, individuals residing in the United Arab Emirates are requested to proceed via our dedicated regional platform at startrader.ae, which is operated by STARTRADER Global Financial Consultation & Financial Analysis L.L.C.. This entity is licensed by the UAE Capital Market Authority (CMA) under License No. 20200000241, and is authorised to introduce financial services and promote financial products in the UAE.
Please click the "Continue" button below to be redirected.


