


Gold Technical Analysis
Gold remains largely under pressure with the latest candles suggest that selling pressure may be slowing after a steep decline.
From a moving average perspective, gold continues to trade below the 20-period moving average, while the shorter term averages remain beneath the longer term trend indicator. The recent recovery has allowed price to move above the 5-period and 10-period moving averages, but these remain well below the 20-period average.
Immediate resistance is located around $4,240–$4,260, followed by the key resistance zone near $4,340. Support remains at $4,172, and a break below this level could expose the next downside targets near $4,100 and potentially lower. While the latest bounce is encouraging for bulls, the overall outlook remains bearish until price can reclaim the 20-period moving average and begin forming higher highs.
Gold 1H Chart
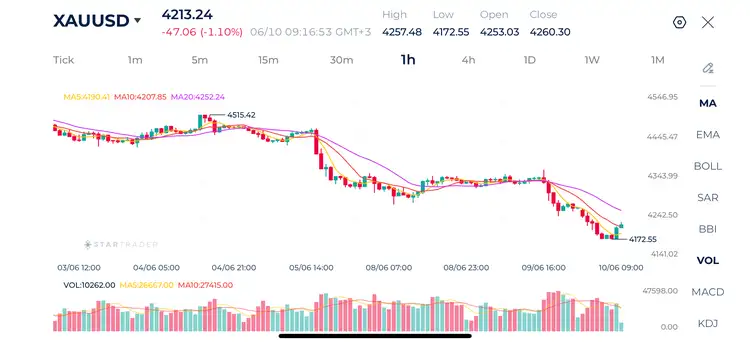
| Resistance | $4,242 | $4,300 | $4,356 |
| Support | $4,172 | $4,125 | $4,095 |
Brent Technical Analysis
Brent crude oil remains in a clear downtrend despite finding temporary support near $91.10. The latest bounce from the recent low failed to generate meaningful bullish momentum, and sellers have quickly regained control, pushing price back toward the lower end of the trading range.
The moving averages continue to reinforce the bearish outlook. Price is trading below the 5-period, 10-period, and 20-period moving averages, while the averages themselves are sloping downward.
Immediate support is located at $91.10, followed by the psychological $90.00 level. Resistance is found at $93.30, followed by $94.60 and then the more significant resistance zone near $96.00. Unless Brent can reclaim and hold above the 20-period moving average, rallies are likely to remain corrective. The short-term outlook remains bearish.
Brent 1H Chart
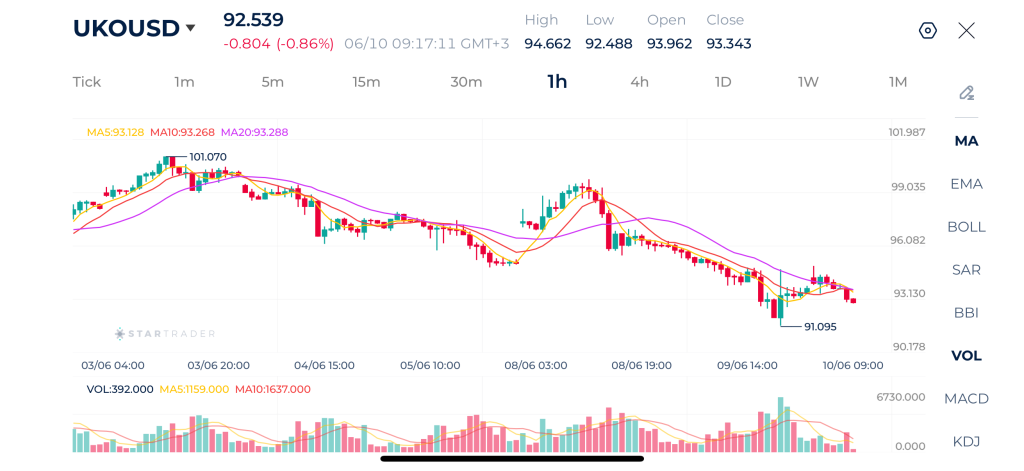
| Resistance | $94.80 | $96.00 | $97.20 |
| Support | $91.10 | $90.00 | $88.90 |
S&P 500 Technical Analysis
The S&P 500 remains under short term bearish pressure despite stabilizing after the sharp decline that pushed the index down to 7,249.
The moving averages continue to favor the sellers. Price is currently trading below the 20-period moving average at approximately 7,387, while the 5-period and 10-period moving averages remain clustered beneath the longer-term average.
Immediate resistance is located around 7,380–7,400, followed by 7,440 and then 7,550. Support remains at 7,326, followed by the major swing low at 7,249. As long as price remains below the 20-period moving average, the short-term outlook remains cautiously bearish, although the pace of the decline has slowed.
S&P 500 1H Chart
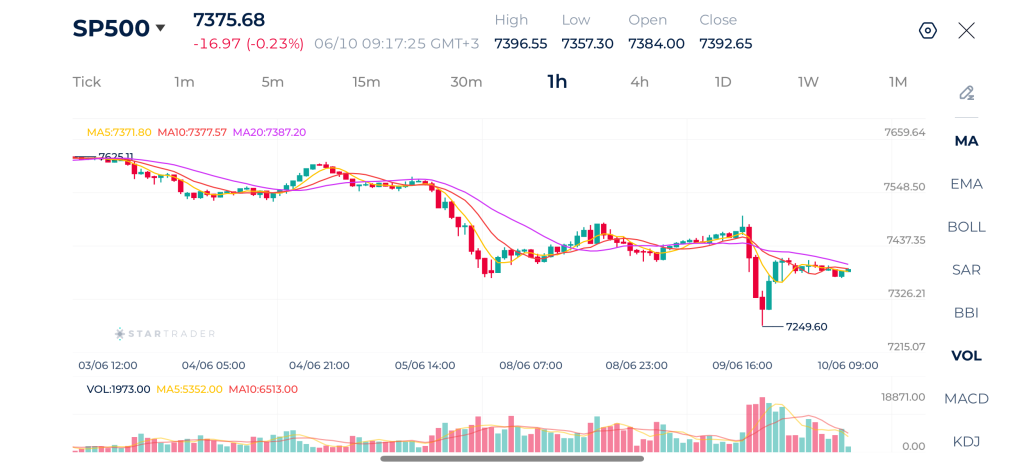
| Resistance | 7,440 | 7,500 | 7,550 |
| Support | 7,249 | 7,180 | 7,100 |
Risk Disclaimer: This material is provided for informational purposes only and does not constitute a recommendation or investment advice. Trading financial instruments on margin involves substantial risk and may not be appropriate for all investors.
Tags
Open Live Account
Please enter a valid country
No results found
No results found
Please enter a valid email
Please enter a valid verification code
1. 8-16 characters + numbers (0-9) 2. blend of letters (A-Z, a-z) 3. special characters (e.g, !a#S%^&)
Please enter the correct format
Please tick the checkbox to proceed
Please tick the checkbox to proceed
Important Notice
STARTRADER does not accept any applications from Australian residents.
To comply with regulatory requirements, clicking the button will redirect you to the STARTRADER website operated by STARTRADER PRIME GLOBAL PTY LTD (ABN 65 156 005 668), an authorized Australian Financial Services Licence holder (AFSL no. 421210) regulated by the Australian Securities and Investments Commission.
CONTINUEImportant Notice for Residents of the United Arab Emirates
In alignment with local regulatory requirements, individuals residing in the United Arab Emirates are requested to proceed via our dedicated regional platform at startrader.ae, which is operated by STARTRADER Global Financial Consultation & Financial Analysis L.L.C.. This entity is licensed by the UAE Capital Market Authority (CMA) under License No. 20200000241, and is authorised to introduce financial services and promote financial products in the UAE.
Please click the "Continue" button below to be redirected.
CONTINUEError! Please try again.

