


Gold Technical Analysis
Gold is currently showing a short-term recovery after the sharp sell-off that pushed price down to the $4,500 area. The rebound is evident through the formation of higher lows and a gradual climb back above the short-term moving averages (MA5 and MA10), indicating that buying pressure is returning.
However, the broader structure still leans bearish, as price remains below the MA20, which continues to slope downward. The consolidation forming just above $4,530 reflects accumulation, and a sustained break above the $4,555–$4,565 resistance zone could open the door for a stronger recovery toward $4,580. On the downside, failure to hold above $4,520 would signal weakness and increase the probability of a retest of the $4,500 low.
Gold 1H Chart
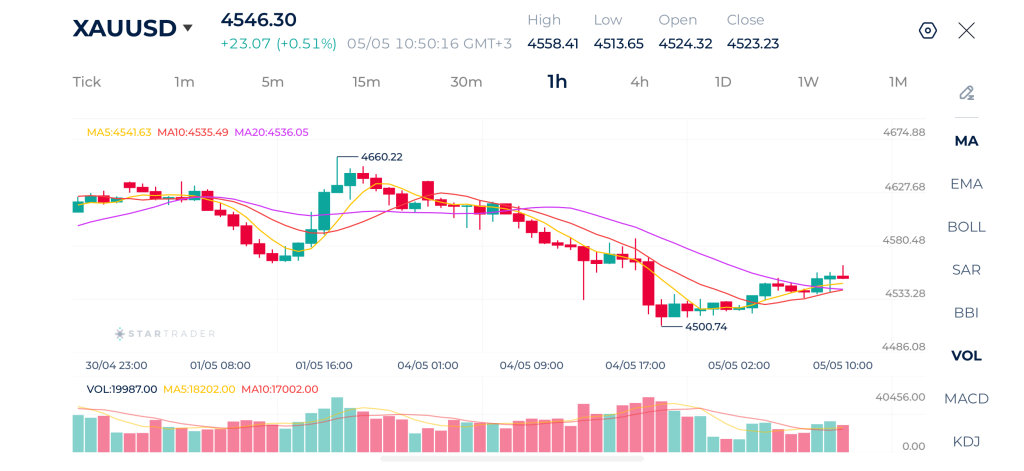
| Resistance | $4,568 | $4,600 | $4,630 |
| Support | $4,522 | $4,500 | $4,465 |
Nasdaq Technical Analysis
Nasdaq has been forming higher lows, indicating a shift in short-term sentiment back toward the upside. The market is now trading above the short-term moving averages (MA5 and MA10), with price also reclaiming the MA20, which is beginning to flatten.
The recent push toward the 27,860–27,880 area highlights a key resistance zone where price previously faced rejection. The current structure suggests the market is attempting to build enough momentum to challenge that level again.
As long as price holds above the 27,650–27,700 support zone, the bullish bias remains intact. This area aligns with the moving averages and recent consolidation. A successful break and close above 27,880 would likely trigger continuation toward 28,000 and higher, confirming a bullish continuation. On the other hand, failure to break resistance combined with a drop below 27,650 would invalidate the current recovery structure and shift the market back into a corrective or bearish phase.
Nasdaq 1H Chart
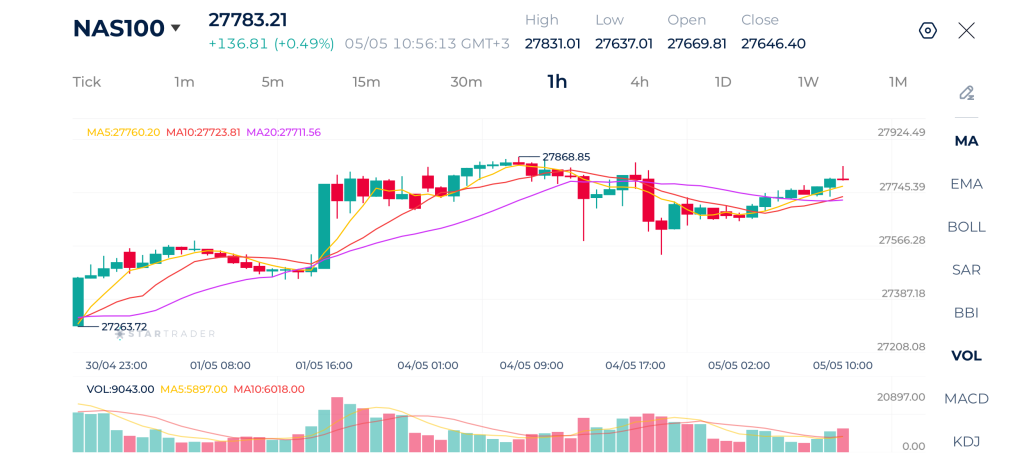
| Resistance | 27,848 | 28,000 | 28,250 |
| Support | 27,657 | 27,500 | 27,386 |
Brent Technical Analysis
Brent crude is trading in a relatively tight range after failing to sustain momentum above the $120.00 resistance level. The rejection from $120.03 marked a clear short-term top, followed by a pullback toward $110.40 and a subsequent recovery.
Currently, price is consolidating around the moving averages, which are flattening. However, the inability to push higher and the repeated rejections near the $118.00 zone suggest that bearish pressure is gradually building. The market appears to be forming a potential lower high, which could lead to a continuation lower if confirmed. A break below $116.70 would likely trigger further downside toward $115.20, while a strong breakout above $118.80 would invalidate this bearish bias and shift momentum back to the upside.
Brent 1H Chart
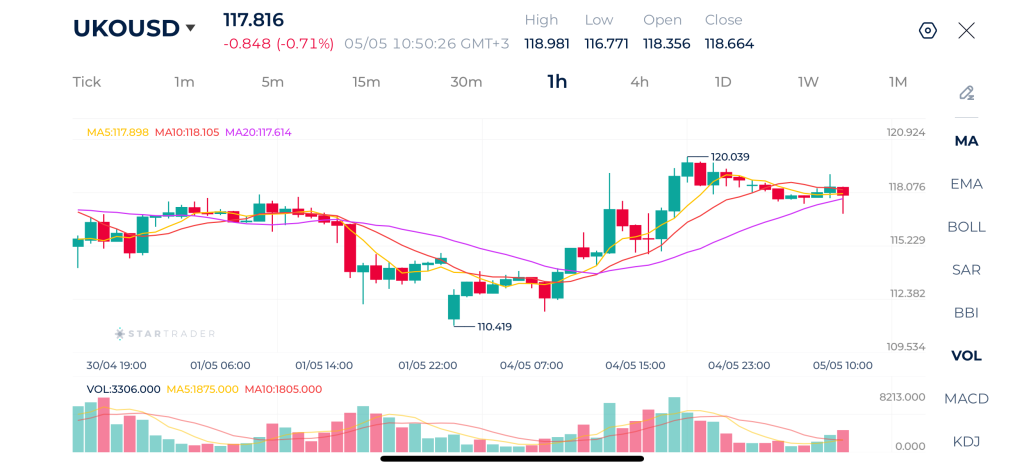
| Resistance | $120.00 | $124.00 | $125.00 |
| Support | $116.20 | $115.10 | $113.60 |
Risk Disclaimer: This material is provided for informational purposes only and does not constitute a recommendation or investment advice. Trading financial instruments on margin involves substantial risk and may not be appropriate for all investors.
Tags
Open Live Account
Please enter a valid country
No results found
No results found
Please enter a valid email
Please enter a valid verification code
1. 8-16 characters + numbers (0-9) 2. blend of letters (A-Z, a-z) 3. special characters (e.g, !a#S%^&)
Please enter the correct format
Please tick the checkbox to proceed
Please tick the checkbox to proceed
Important Notice
STARTRADER does not accept any applications from Australian residents.
To comply with regulatory requirements, clicking the button will redirect you to the STARTRADER website operated by STARTRADER PRIME GLOBAL PTY LTD (ABN 65 156 005 668), an authorized Australian Financial Services Licence holder (AFSL no. 421210) regulated by the Australian Securities and Investments Commission.
CONTINUEImportant Notice for Residents of the United Arab Emirates
In alignment with local regulatory requirements, individuals residing in the United Arab Emirates are requested to proceed via our dedicated regional platform at startrader.ae, which is operated by STARTRADER Global Financial Consultation & Financial Analysis L.L.C.. This entity is licensed by the UAE Capital Market Authority (CMA) under License No. 20200000241, and is authorised to introduce financial services and promote financial products in the UAE.
Please click the "Continue" button below to be redirected.
CONTINUEError! Please try again.

