


Gold Technical Analysis
Gold is trading near $4,586 after a sharp selloff from $4,730 and only a weak rebound from $4,555. Price shows bearish pressure remains intact despite short-term stabilization.
The recent candles show sideways movement, but the inability to reclaim the MA cluster suggests sellers are still defending higher levels.
As long as gold remains below $4,595–$4,600, downside risk remains elevated. A break below $4,576 could expose $4,555 again. Selling volume has cooled after the sharp decline, indicating pause or consolidation. Bias is generally bearish below $4,600, with consolidation before the next move.
Gold 1H Chart
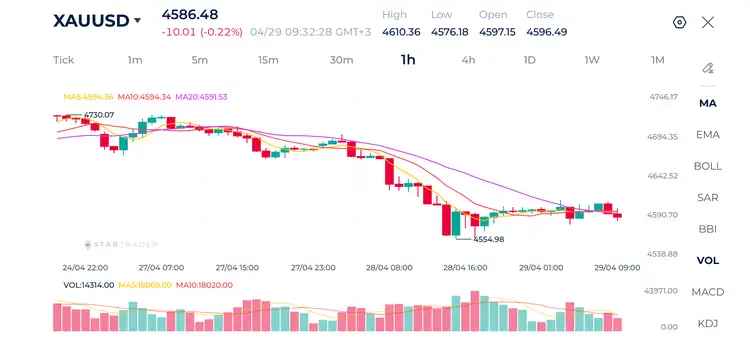
| Resistance | $4,642 | $4,694 | $4,730 |
| Support | $4,554 | $4,500 | $4,467 |
Brent Technical Analysis
Brent crude is trading near $109.71 after extending its rally and printing a recent high at $110.32. Price structure remains clearly bullish, with consistent higher highs and higher lows across the chart. The market is trading above all key moving averages MA5, MA10, and MA20, confirming strong upside momentum.
The moving averages are positively aligned, which is a classic trend continuation signal. Buyers continue to support dips, while sellers have struggled to create meaningful pullbacks.
If price holds above $108.70, the breakout remains valid. Losing that zone could trigger a pullback toward $108.10 before buyers re-enter. Momentum is strong but controlled. The latest push higher came after a period of consolidation, increasing the credibility of the breakout.
Brent 1H Chart
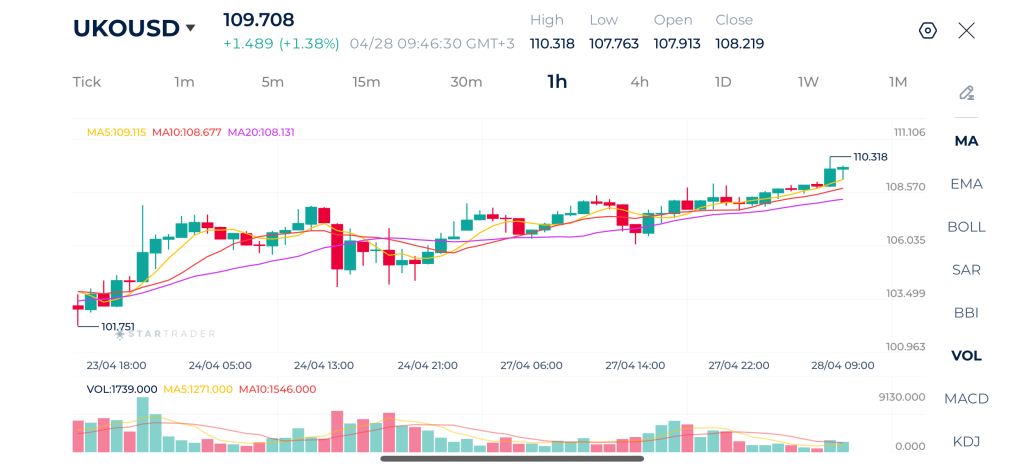
| Resistance | $111.24 | $113.61 | $115.00 |
| Support | $107.20 | $106.00 | $103.50 |
EURUSD Technical Analysis
EURUSD is trading near 1.1697 after failing to sustain the earlier rebound from 1.1678. Price remains trapped in a short-term sideways range, but recent candles show sellers regaining slight control. The pair is now trading just below the short-term moving averages: MA5, MA10, and near MA20, signaling weak momentum and lack of trend conviction.
The broader structure is still range-bound, but the latest rejection from the 1.1716 area suggests upside momentum is fading. If price remains below 1.1710, downside pressure may continue toward 1.1685 and 1.1678. A breakout above 1.1721 would improve bullish sentiment.
Volume is moderate and declining, which supports the idea of consolidation without a clear directional move.
EURUSD 1H Chart
| Resistance | 1.1720 | 1.1754 | 1.1800 |
| Support | 1.1677 | 1.1600 | 1.1545 |
Risk Disclaimer: This material is provided for informational purposes only and does not constitute a recommendation or investment advice. Trading financial instruments on margin involves substantial risk and may not be appropriate for all investors.
Tags
Open Live Account
Please enter a valid country
No results found
No results found
Please enter a valid email
Please enter a valid verification code
1. 8-16 characters + numbers (0-9) 2. blend of letters (A-Z, a-z) 3. special characters (e.g, !a#S%^&)
Please enter the correct format
Please tick the checkbox to proceed
Please tick the checkbox to proceed
Important Notice
STARTRADER does not accept any applications from Australian residents.
To comply with regulatory requirements, clicking the button will redirect you to the STARTRADER website operated by STARTRADER PRIME GLOBAL PTY LTD (ABN 65 156 005 668), an authorized Australian Financial Services Licence holder (AFSL no. 421210) regulated by the Australian Securities and Investments Commission.
CONTINUEImportant Notice for Residents of the United Arab Emirates
In alignment with local regulatory requirements, individuals residing in the United Arab Emirates are requested to proceed via our dedicated regional platform at startrader.ae, which is operated by STARTRADER Global Financial Consultation & Financial Analysis L.L.C.. This entity is licensed by the UAE Capital Market Authority (CMA) under License No. 20200000241, and is authorised to introduce financial services and promote financial products in the UAE.
Please click the "Continue" button below to be redirected.
CONTINUEError! Please try again.

