


Gold Technical Analysis
Following the strong gains in gold prices in the past few months, the precious metal has been in a recent downtrend since the high of $4,381, bottoming out around $3886 yesterday.
The price is below the longer-term moving average MA(30), confirming the recent bearish momentum. However, the price is currently crossing back above the shorter-term moving averages MA(5) and MA(10), which could signal a short-term rebound or a consolidation phase.
MACD lines have recently performed a bullish crossover. This is a strong indication of building bullish momentum and suggests the recent drop may be over, at least for the short term.
Gold 1H Chart
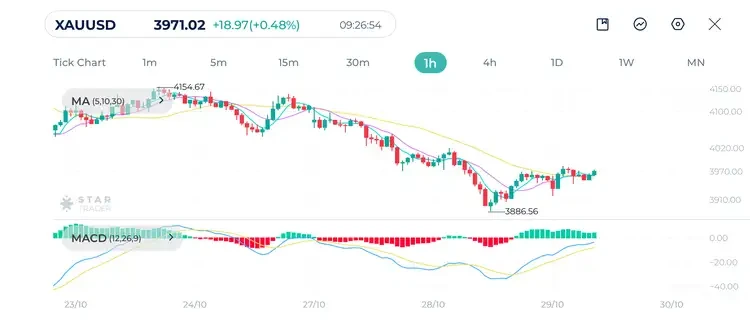
| Resistance | $3,982 | $4,019 | $4,051 |
| Support | $3,943 | $3,905 | $3,884 |
Apple Technical Analysis
Apple stock is in a clear strong uptrend since the low of $244.46 on October 13th. The price is currently trading near its all-time high of $269.75.
The price is trading above all the short and long-term moving averages, which are all positively aligned and sloping upwards. This strongly confirms the powerful bullish momentum.
MACD lines remain well above the zero line, indicating sustained bullish strength., signaling that the momentum is still accelerating.
The technicals are overall bullish. The stock shows strong, sustained buying pressure. The 30-period moving average is likely to act as dynamic support for price.
Apple 1H Chart
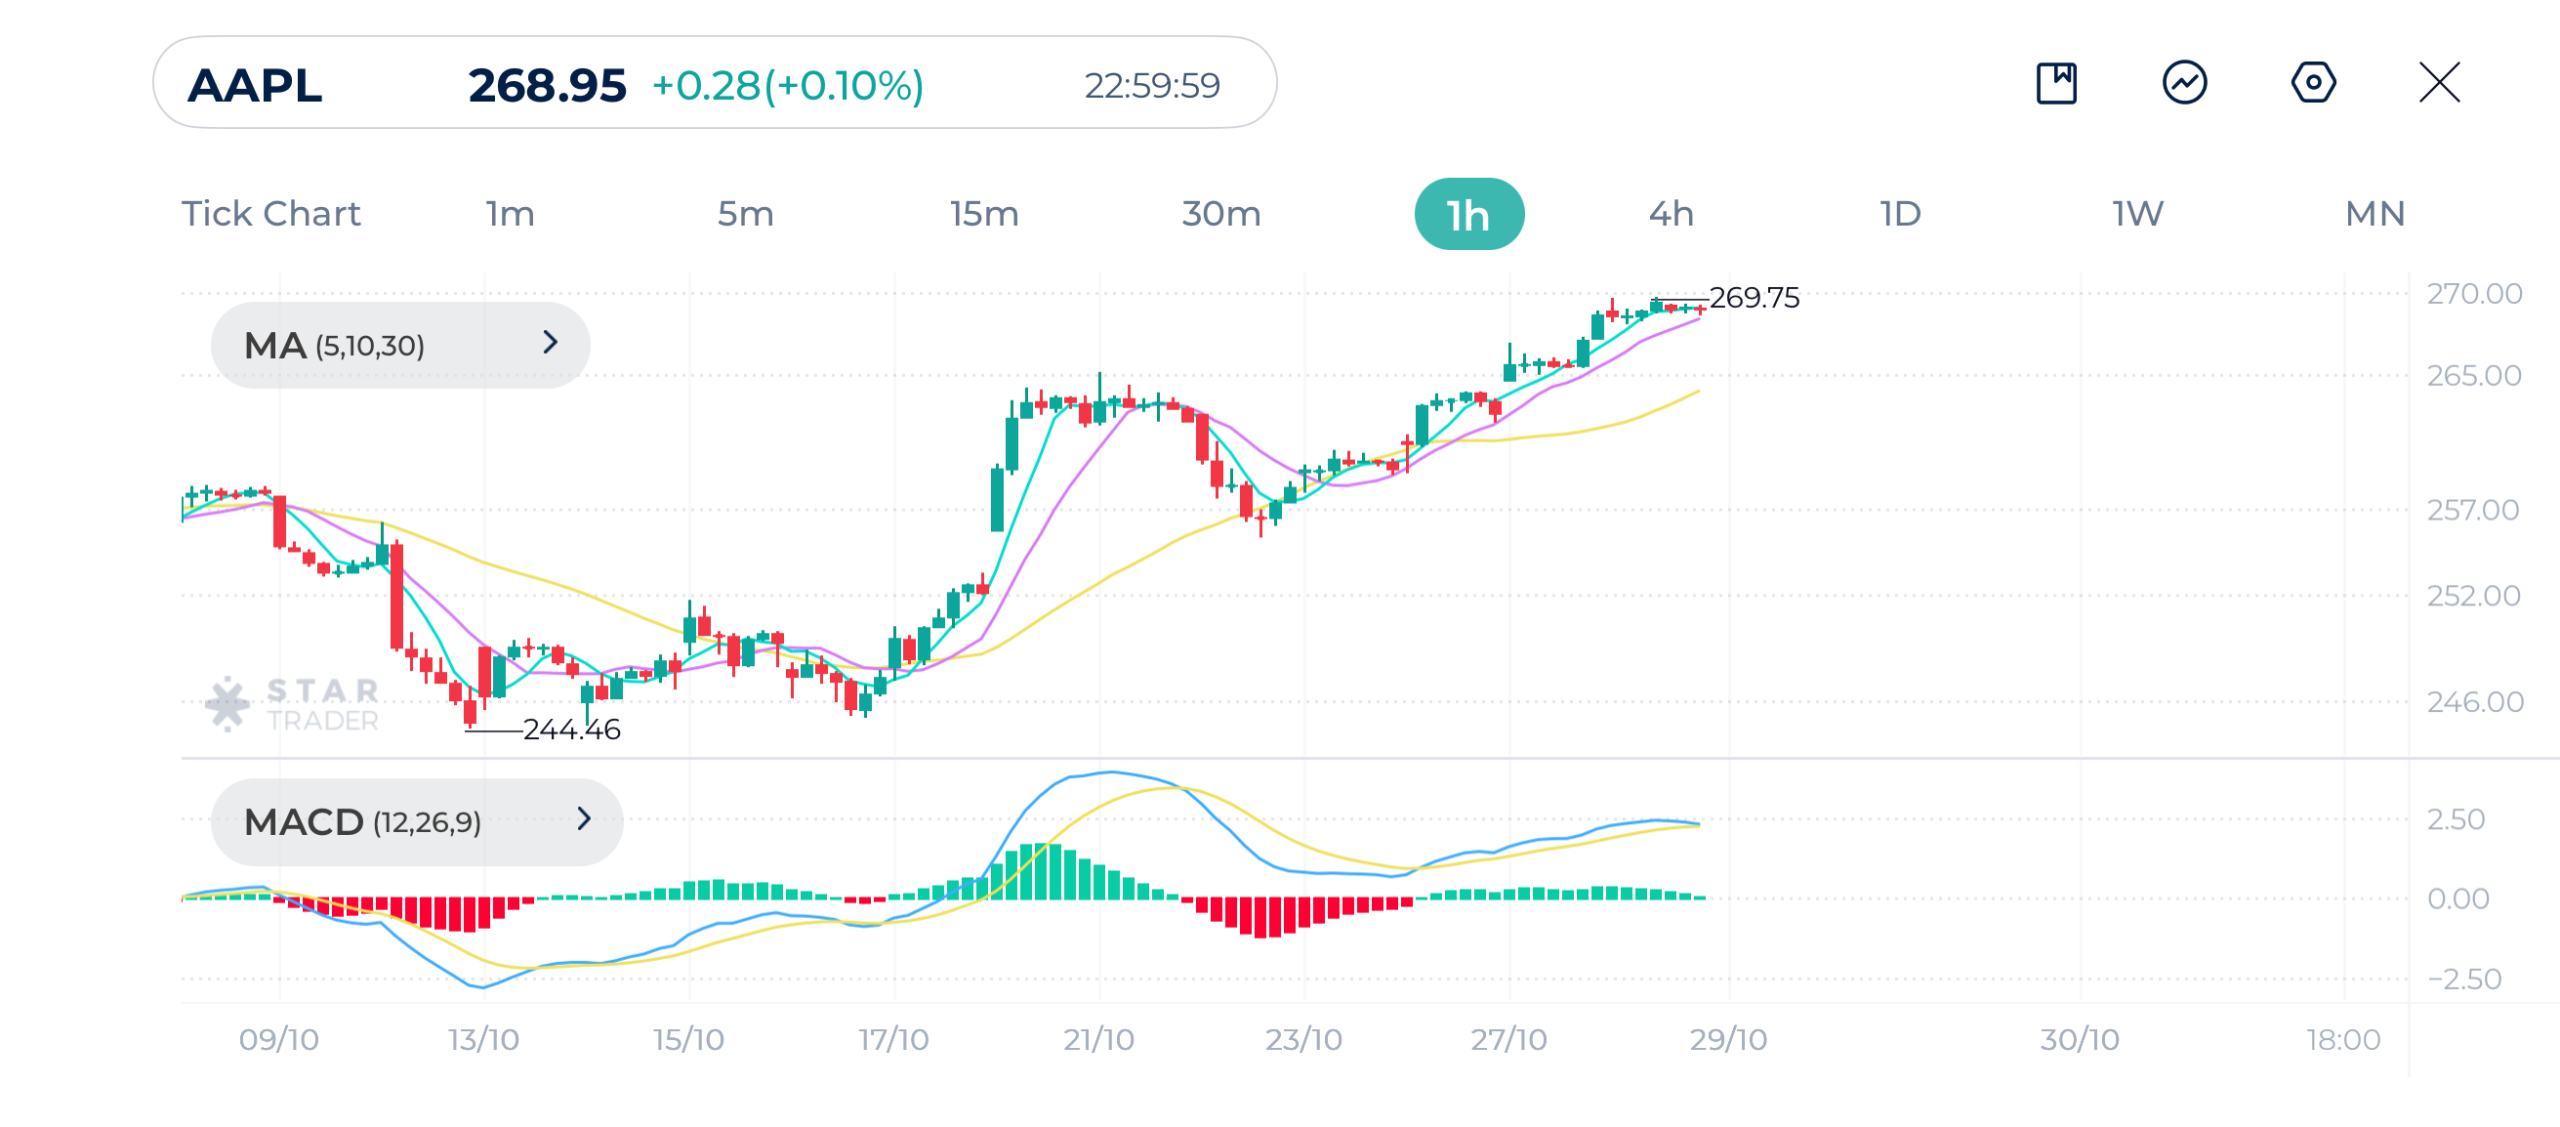
| Resistance | $269.95 | $270.50 | $271.25 |
| Support | $267.07 | $264.12 | $262.16 |
USDJPY Technical Analysis
USDJPY had a brief period of consolidation and experienced a pullback after peaking at $153.25. It has now started to move back up, indicating a reversal back into the longer-term bullish trend that preceded this pullback.
The price has recently crossed above the short-term moving averages and is approaching the longer-term MA(30). A clear break above the long-term moving average would confirm a stronger push higher.
MACD is showing a bullish crossover from below the zero line. This gives an indication that selling pressure has exhausted and bullish momentum is taking over.
The technical overview is turning bullish again after a brief dip. The bullish MACD crossover and the price moving back above the short-term moving averages suggest the pair is likely to retest the recent high of $153.25 soon.
USDJPY 1H Chart
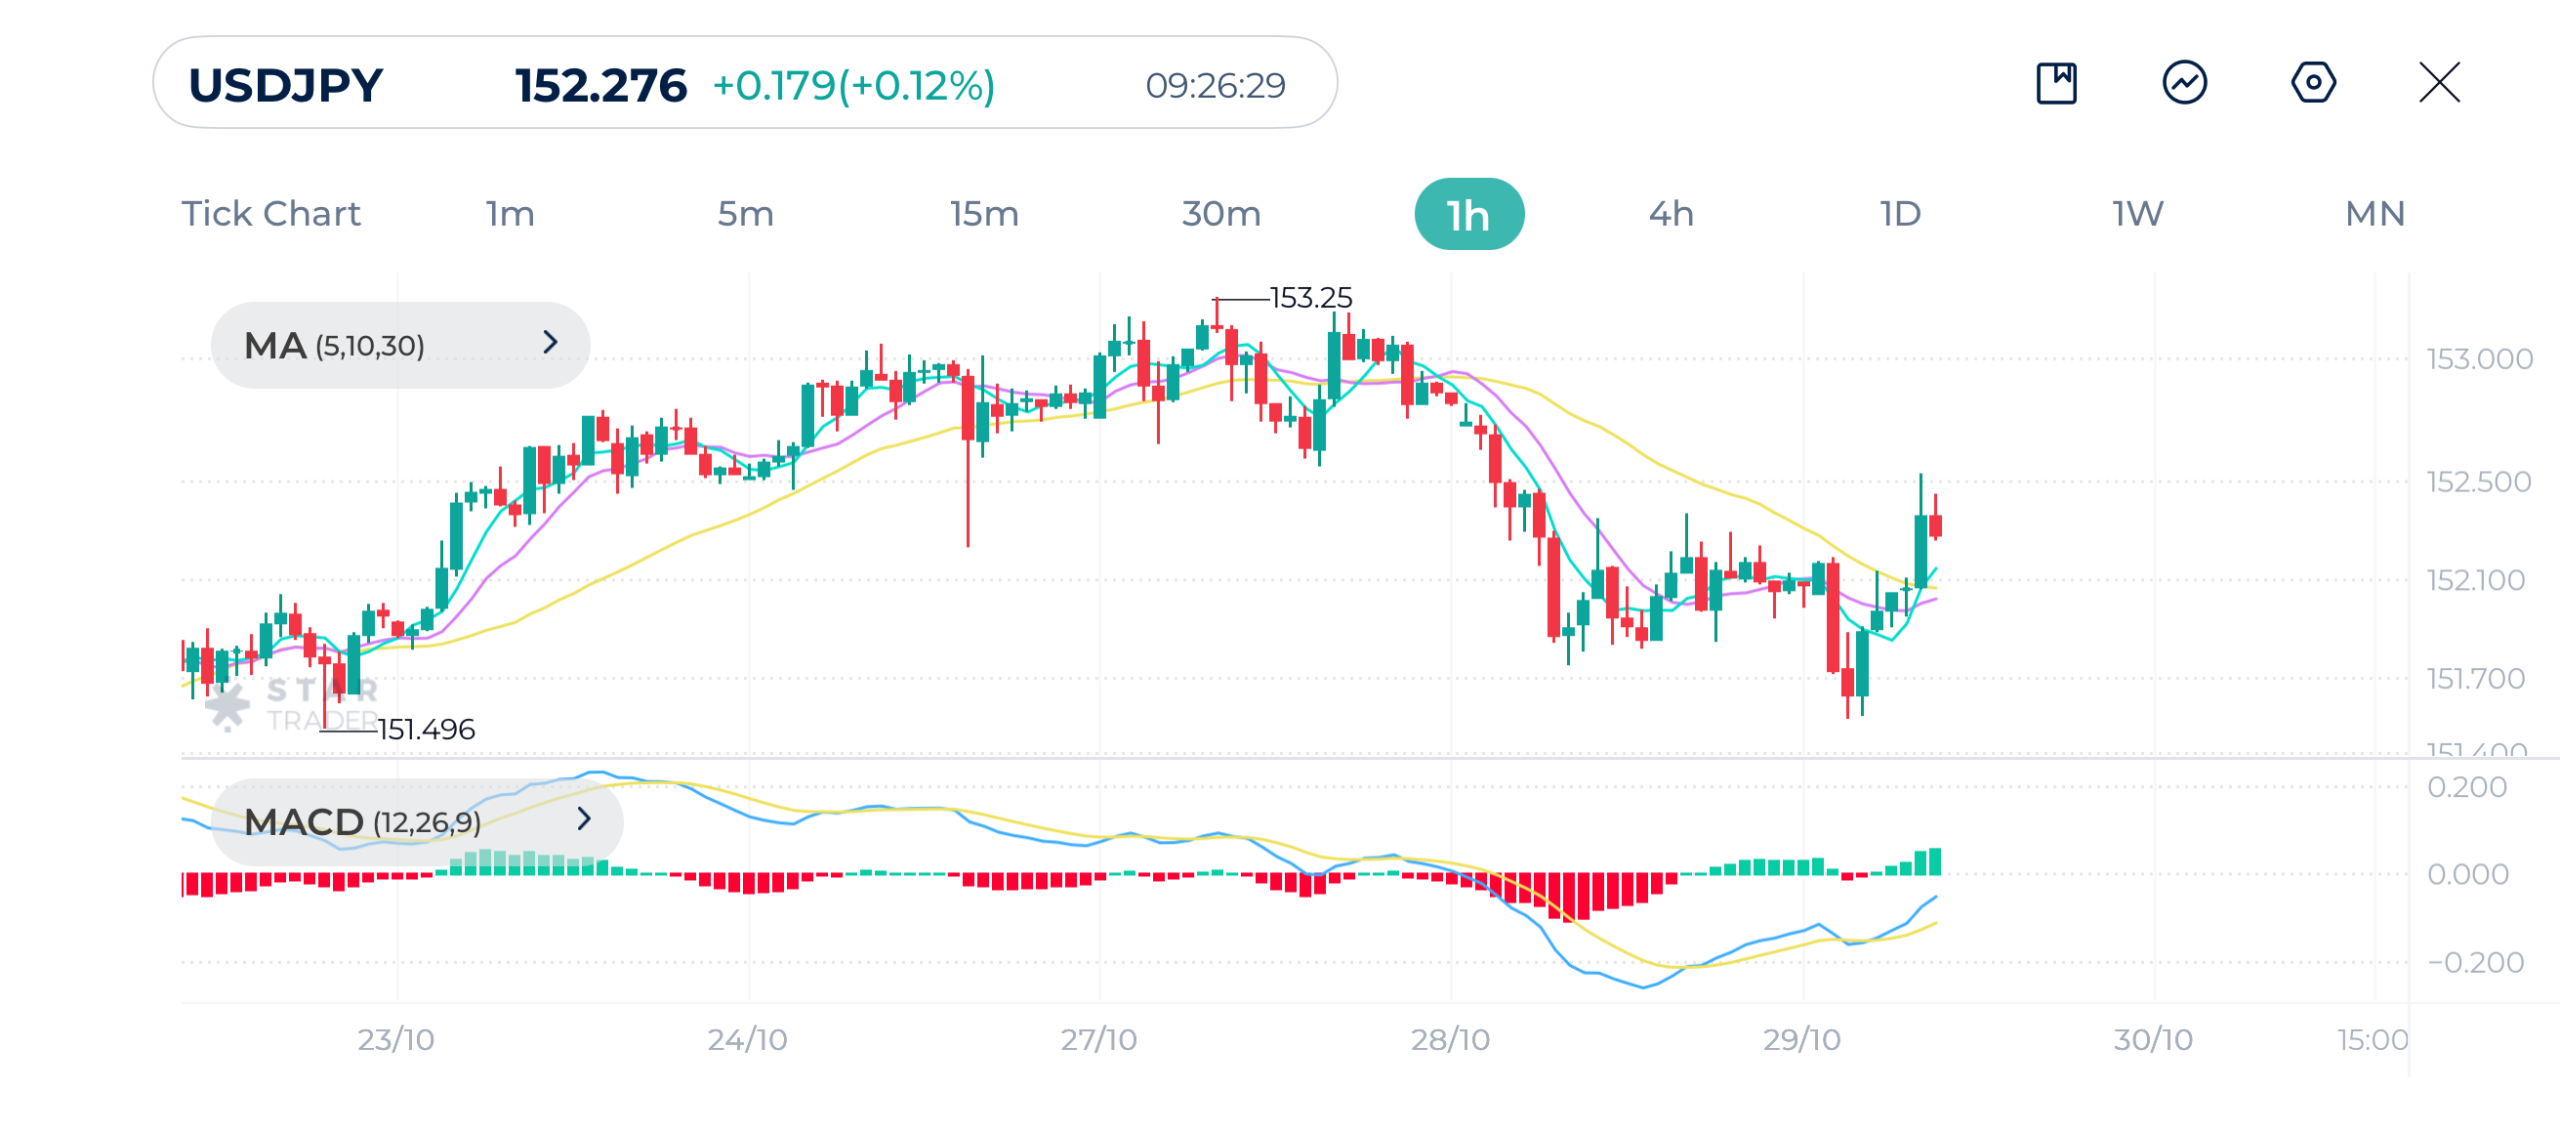
| Resistance | 152.54 | 152.78 | 153.25 |
| Support | 151.76 | 151.19 | 150.75 |
Tags
Open Live Account
Please enter a valid country
No results found
No results found
Please enter a valid email
Please enter a valid verification code
1. 8-16 characters + numbers (0-9) 2. blend of letters (A-Z, a-z) 3. special characters (e.g, !a#S%^&)
Please enter the correct format
Please tick the checkbox to proceed
Please tick the checkbox to proceed
Important Notice
STARTRADER does not accept any applications from Australian residents.
To comply with regulatory requirements, clicking the button will redirect you to the STARTRADER website operated by STARTRADER PRIME GLOBAL PTY LTD (ABN 65 156 005 668), an authorized Australian Financial Services Licence holder (AFSL no. 421210) regulated by the Australian Securities and Investments Commission.
CONTINUEImportant Notice for Residents of the United Arab Emirates
In alignment with local regulatory requirements, individuals residing in the United Arab Emirates are requested to proceed via our dedicated regional platform at startrader.ae, which is operated by STARTRADER Global Financial Consultation & Financial Analysis L.L.C.. This entity is licensed by the UAE Capital Market Authority (CMA) under License No. 20200000241, and is authorised to introduce financial services and promote financial products in the UAE.
Please click the "Continue" button below to be redirected.
CONTINUEError! Please try again.

