








 Web Trader MT5













Gold Technical Analysis
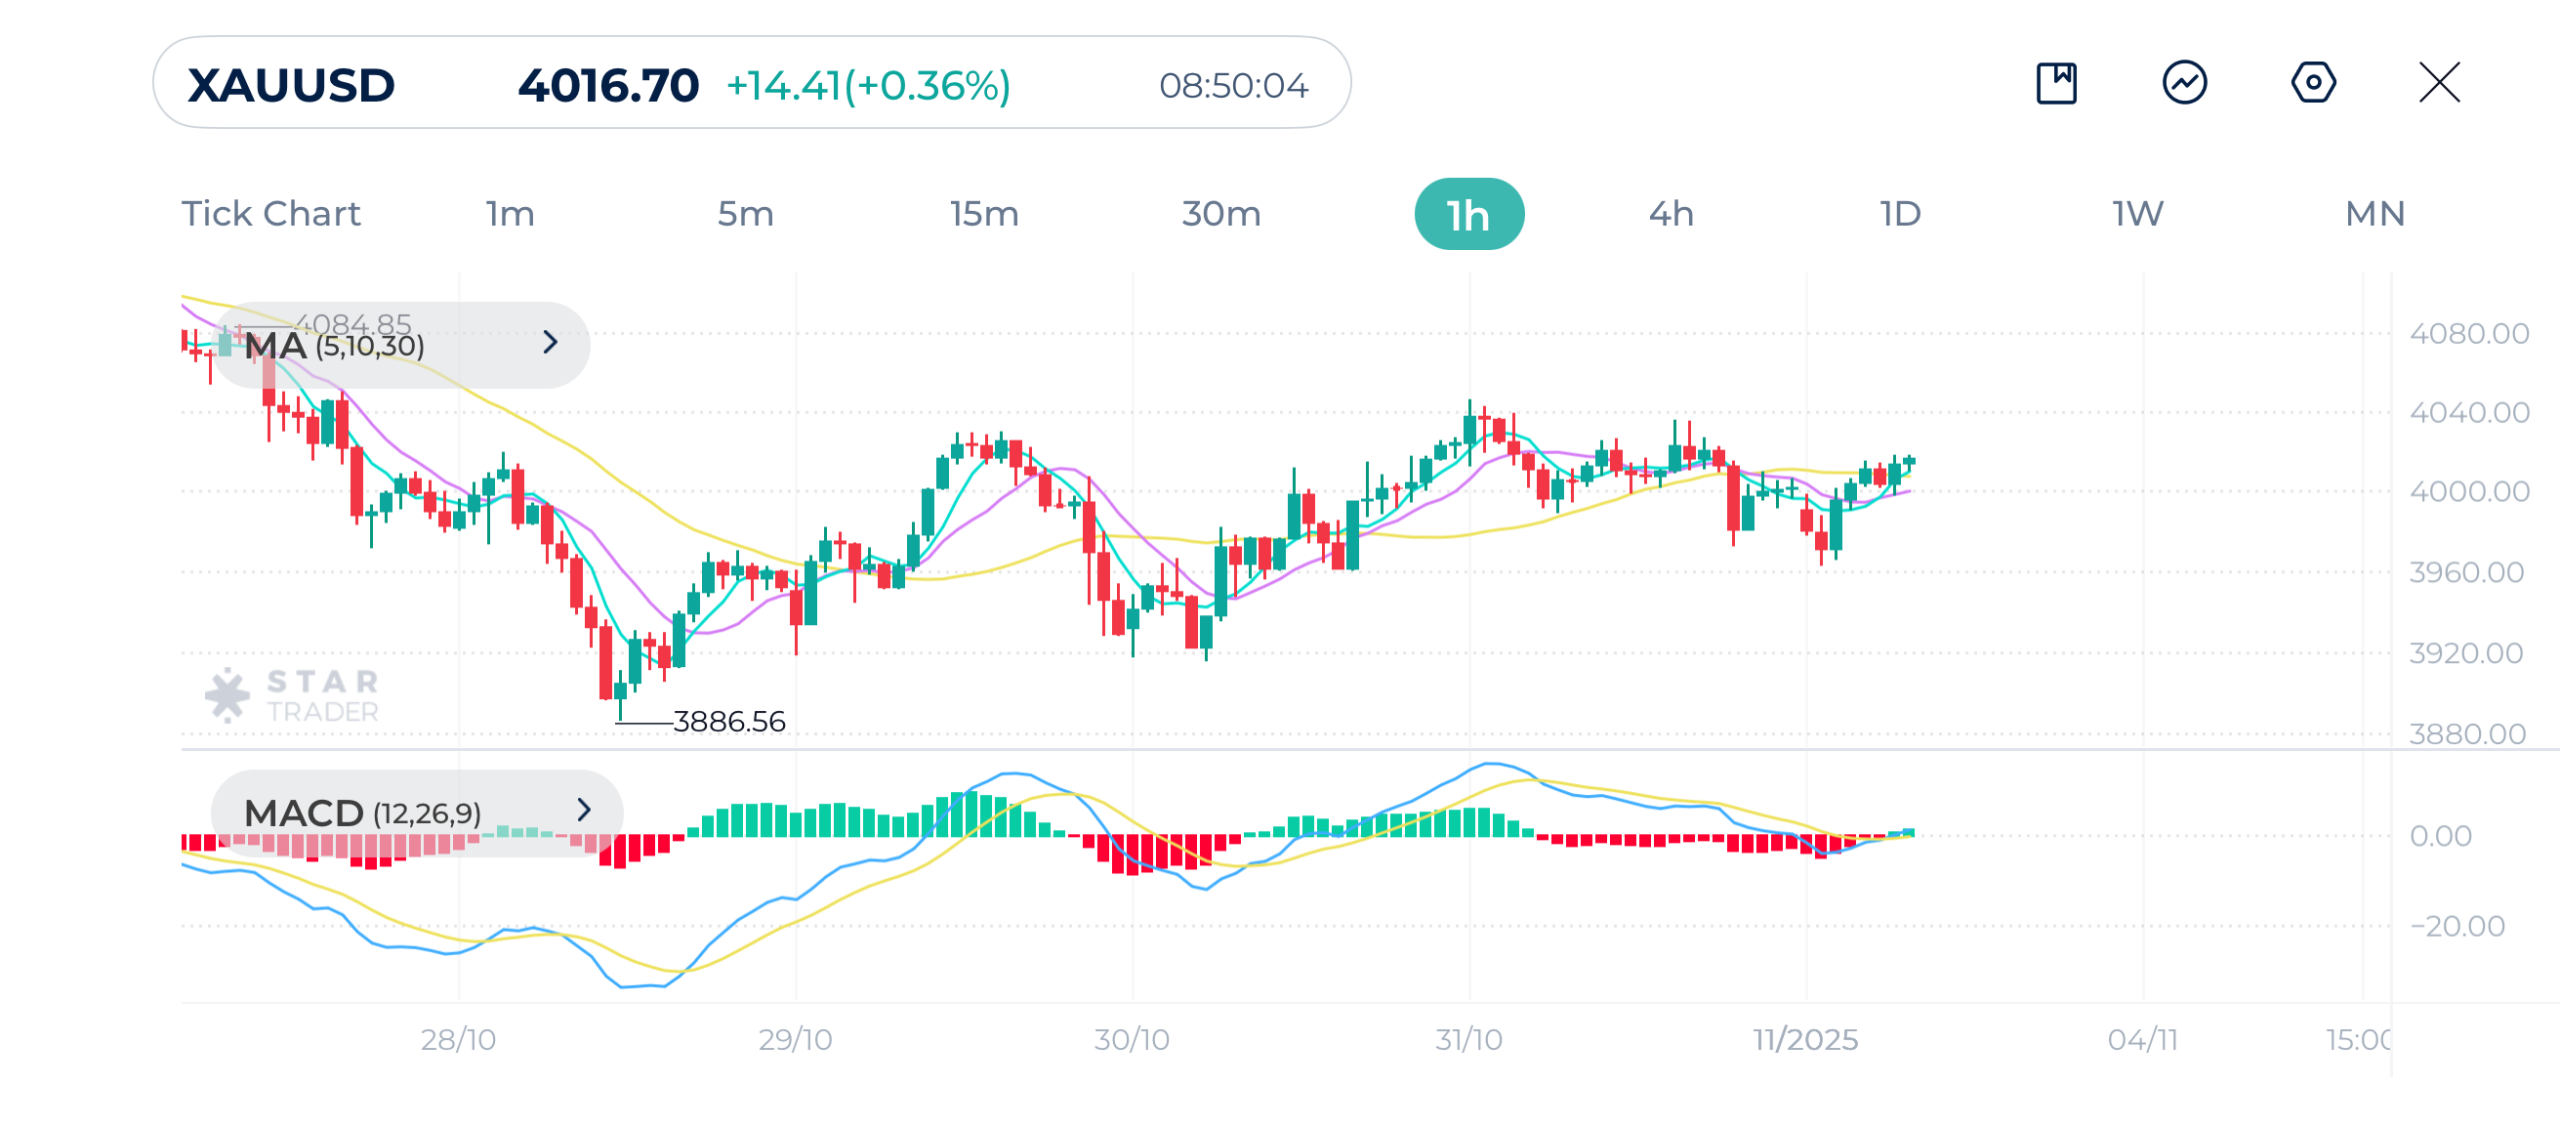
Gold prices have rebounded after finding support near $3,886 and recovering steadily to trade around $4,016. The hourly chart reveals that the 5- and 10-period moving averages have crossed above the 30-period MA, signaling a potential bullish reversal.
MACD confirms this shift, with the lines turning positive, indicating growing bullish momentum. If this upward momentum sustains, gold could retest resistance at $4,040 and possibly $4,080.
On the downside, support is seen near $3,960 a level that needs to hold to maintain the current bullish bias. The overall price action suggests that buyers are regaining control after the recent correction, though the next move will depend on the strength of bulish momentum above $4,040.
Gold 1H Chart
| Resistance | $4,046 | $4,085 | $4,138 |
| Support | $3,962 | $3,915 | $3,885 |
Brent Technical Analysis
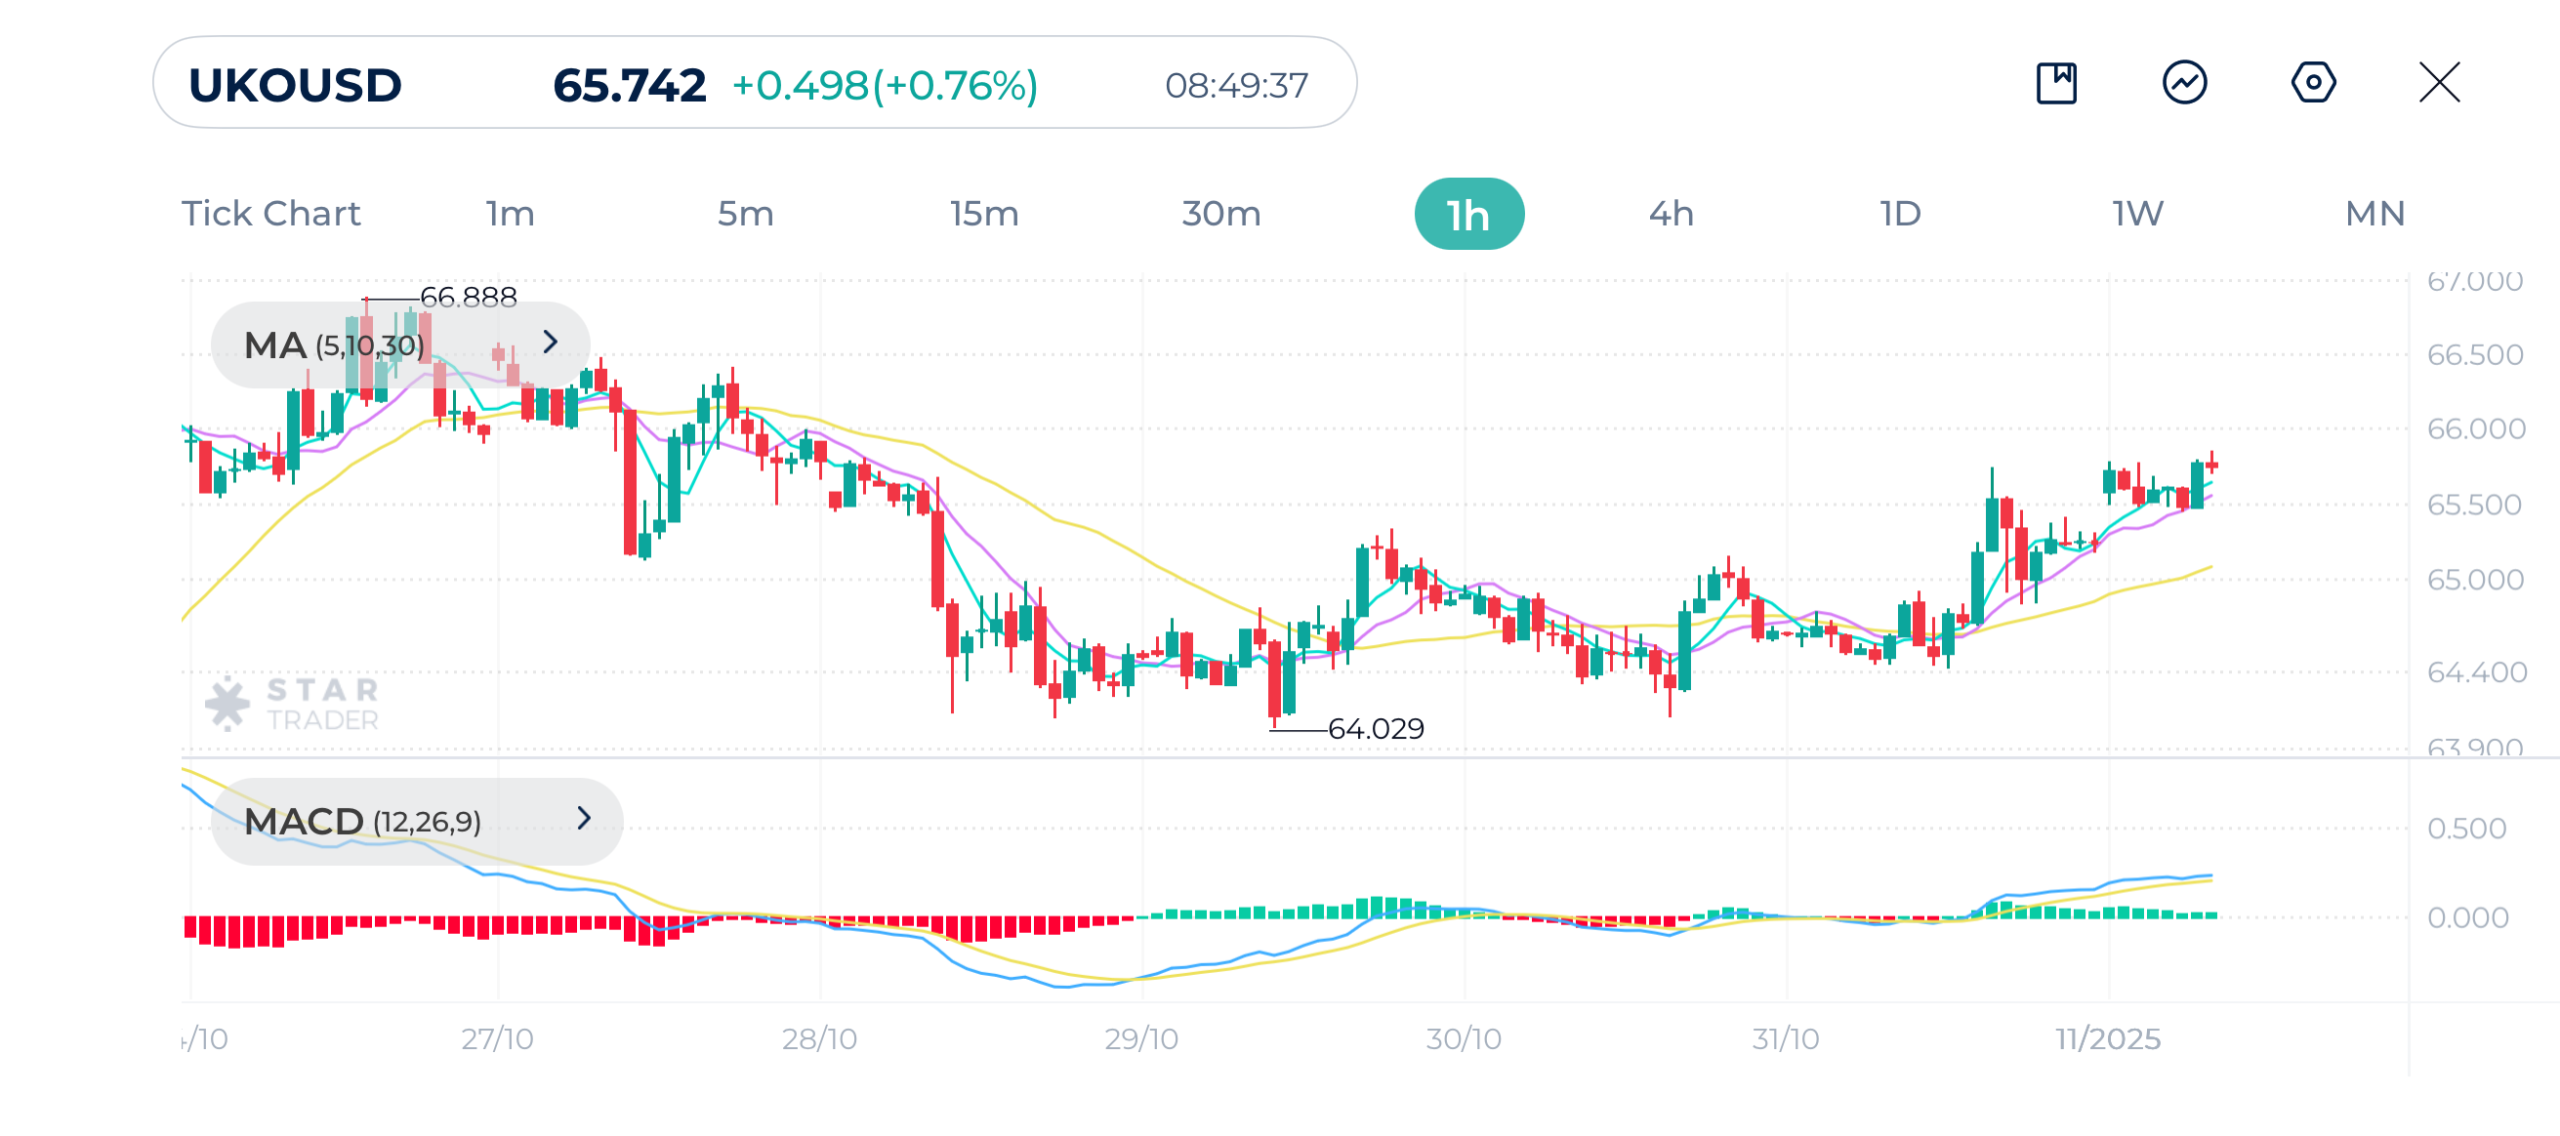
Brent crude has bounced back from its recent low near $64.02, with prices now trading around $65.74. The shorter moving averages (5 and 10) have turned upward and are attempting to cross above the 30-period moving average, hinting at a short-term bullish shift.
MACD supports this view as well as the MACD line has moved above the signal line, confirming a recovery in buying momentum. Immediate resistance lies around $66.00, followed by $66.90, where sellers may reappear. If prices hold above $65.00, the bullish momentum could extend. However, a drop below that level would put the focus back on support at $64.00.
The overall picture suggests the potential for continued recovery, though momentum remains in its early stage.
Brent 1H Chart
| Resistance | $65.57 | $66.00 | $66.25 |
| Support | $64.70 | $64.25 | $63.97 |
EURUSD Technical Analysis
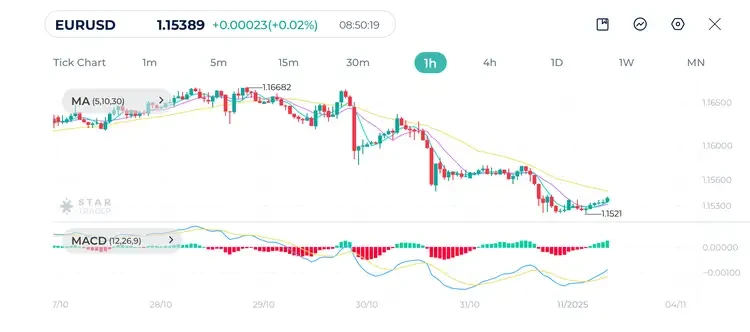
On the hourly chart, EURUSD has been trading in a clear downtrend. This trend has been continuing since mid September, indicating strong selling pressure on the pair.
The moving averages show a bearish alignment where shorter-term MA(5) and MA(10) below the longer-term 30-period moving average, reflecting continued downward pressure. However, MACD has started to turn green with the MACD line crossing above the signal line, suggesting that bearish momentum is weakening in the short term, which may indicate a nearing upward correction.
If the pair holds above 1.1520 and continues this short-term bullish crossover, a corrective move toward 1.1570–1.1600 could follow. A break below 1.1520, however, would indicate that sellers are regaining control, opening the way for a deeper decline toward 1.1480.
EURUSD 1H Chart
| Resistance | 1.1547 | 1.1578 | 1.1600 |
| Support | 1.1521 | 1.1482 | 1.1420 |
Tags


Open Live Account
 Email Address
 Phone Number
Important Notice
STARTRADER does not accept any applications from Australian residents.
To comply with regulatory requirements, clicking the button will redirect you to the STARTRADER website operated by STARTRADER PRIME GLOBAL PTY LTD (ABN 65 156 005 668), an authorized Australian Financial Services Licence holder (AFSL no. 421210) regulated by the Australian Securities and Investments Commission.
Important Notice for Residents of the United Arab Emirates
In alignment with local regulatory requirements, individuals residing in the United Arab Emirates are requested to proceed via our dedicated regional platform at startrader.ae, which is operated by STARTRADER Global Financial Consultation & Financial Analysis L.L.C.. This entity is licensed by the UAE Capital Market Authority (CMA) under License No. 20200000241, and is authorised to introduce financial services and promote financial products in the UAE.
Please click the "Continue" button below to be redirected.


