








 Web Trader MT5













Gold Technical Analysis
Gold is showing early signs of a short term trend reversal after an aggressive selloff from last week. The bounce from this level has been technically healthy, with price reclaiming the 5 and 10 moving averages.
The structure has shifted from lower lows to higher lows, which is often the first signal that bearish momentum is losing control. The MACD strongly supports this view, having formed a bullish divergence at the lows. This indicates that upside momentum is rebuilding.
As long as gold holds above the $4,700–$4,650 support zone, the recovery remains intact, with upside potential toward $5,050 and then $5,200 if the 30-period moving average is reclaimed. A failure back below $4,650 would invalidate the recovery and signal that sellers are regaining dominance.
Gold 1H Chart
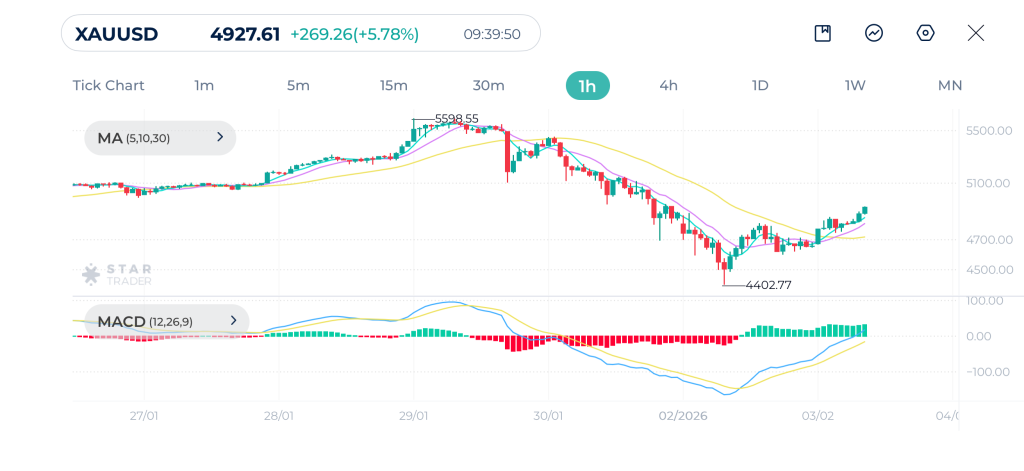
| Resistance | $4,947 | $5,000 | $5,060 |
| Support | $4,843 | $4,751 | $4,621 |
Brent Technical Analysis
Oil is currently in a corrective phase following a strong impulsive rally that peaked near above $71.00. The subsequent selloff was sharp and decisive, breaking below the 5, 10, and 30 moving averages and signaling a short term trend shift from bullish to neutral bearish. Price has now entered a sideways consolidation around the $66.30–$66.80 area, where selling pressure has clearly slowed.
On the MACD, bearish momentum is fading. As long as price holds above the $66.00 psychological level, a corrective rebound toward the $68.00–$69.00 zone remains possible. However, failure to reclaim the 30-period moving average keeps the broader short term bias cautious, and a break below $66.00 would expose the prior demand zone near $64.80.
Brent 1H Chart
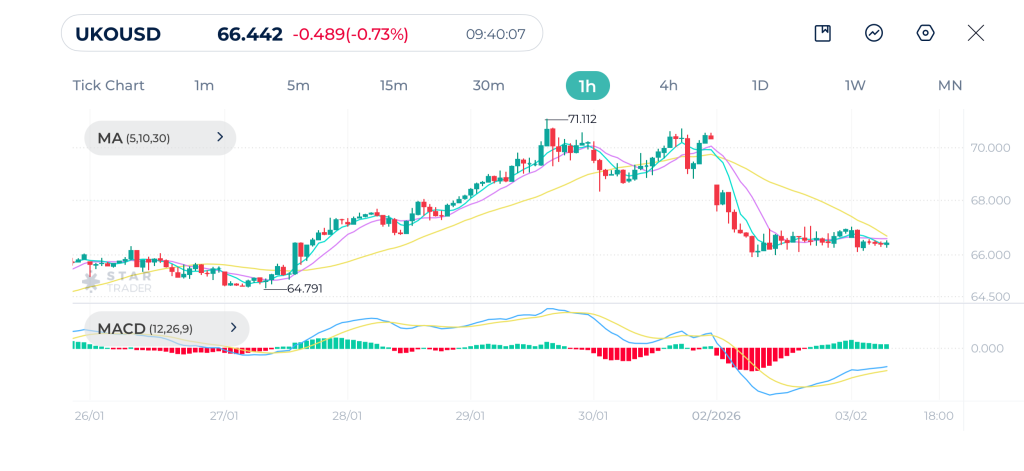
| Resistance | $66.44 | $67.07 | $67.32 |
| Support | $65.29 | $64.57 | $64.00 |
S&P 500 Technical Analysis
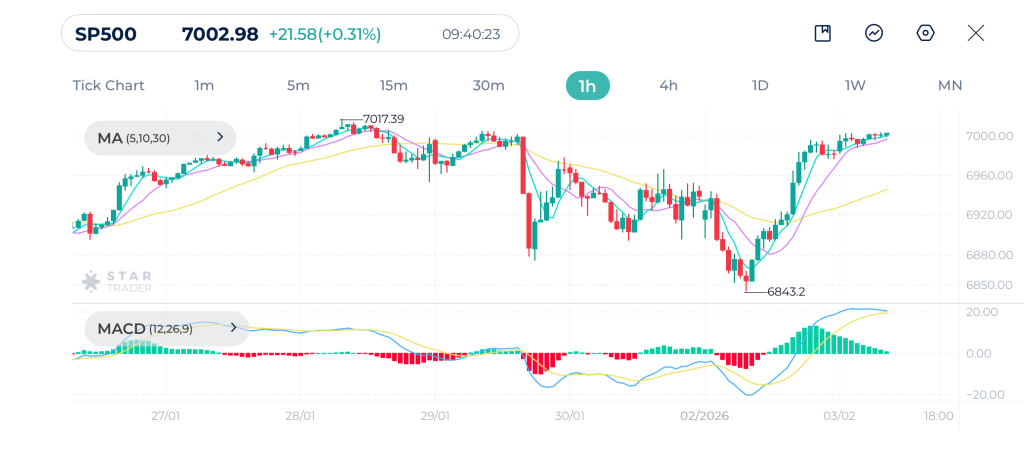
The S&P 500 remains bullish on the 1H chart after completing a sharp corrective move and a strong V-shaped recovery from the 6,843 area. Price has reclaimed all short-term moving averages, with the MA(5) and MA(10) leading higher and staying comfortably above the 30-period moving average, which has started to turn upward again.
On the momentum side, the MACD has crossed into positive territory, indicating strengthening bullish momentum. As long as price holds above the 6,950–6,920 support zone, declines are likely corrective. A clean hourly close above 7,020 would open the door for continuation toward fresh highs, while only a sustained move back below the 30-period moving average would weaken the bullish bias.
S&P 500 1H Chart
| Resistance | $4,990 | $5,112 | $5,136 |
| Support | $4,746 | $4,656 | $4,592 |
Tags


Open Live Account
 Email Address
 Phone Number
Important Notice
STARTRADER does not accept any applications from Australian residents.
To comply with regulatory requirements, clicking the button will redirect you to the STARTRADER website operated by STARTRADER PRIME GLOBAL PTY LTD (ABN 65 156 005 668), an authorized Australian Financial Services Licence holder (AFSL no. 421210) regulated by the Australian Securities and Investments Commission.
Important Notice for Residents of the United Arab Emirates
In alignment with local regulatory requirements, individuals residing in the United Arab Emirates are requested to proceed via our dedicated regional platform at startrader.ae, which is operated by STARTRADER Global Financial Consultation & Financial Analysis L.L.C.. This entity is licensed by the UAE Capital Market Authority (CMA) under License No. 20200000241, and is authorised to introduce financial services and promote financial products in the UAE.
Please click the "Continue" button below to be redirected.


