


S&P 500 Technical Analysis
The SP500 continues to display strong bullish structure on the hourly timeframe after rebounding sharply from the 7,346 low. Price has been respecting the short-term moving averages during minor pullbacks.
Despite the bullish structure, the market is now approaching a potential near-term exhaustion zone. The candles near the highs are becoming smaller, suggesting that momentum is slowing slightly as the index tests resistance.
If the SP500 breaks decisively above 7,475, the next upside extension could target the psychological 7,500 area and potentially higher. On the downside, initial support sits around 7,448-7,450.
A break below that zone could trigger a deeper retracement toward 7,410, though the broader hourly structure would remain bullish unless the market falls back below 7,346.
S&P 500 1H Chart
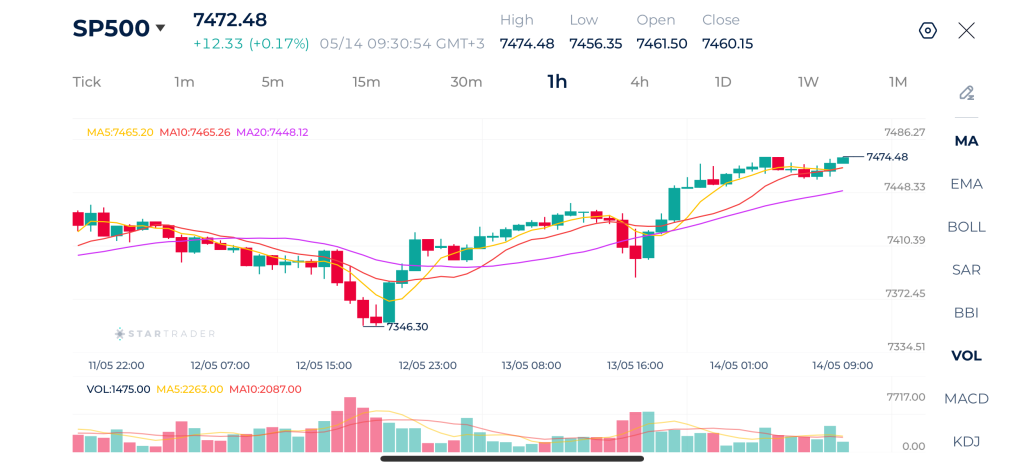
| Resistance | 7,470 | 7,500 | 7,520 |
| Support | 7,447 | 7,428 | 7,416 |
Gold Technical Analysis
Gold remains in a broad consolidation phase after the sharp rejection from the $4,773 resistance area. On the hourly chart, price action has transitioned from a strong impulsive rally into a sideways structure between roughly $4,665 and $4,710, showing that bullish momentum has cooled significantly in the short term.
Gold seems to be neutral in the immediate short term but still constructive on a slightly broader horizon as long as price remains above the $4,638 swing low.
If buyers manage to secure an hourly close above $4,712, momentum could quickly accelerate toward $4,745 and potentially retest $4,773. On the downside, a clean break below $4,665 would likely expose $4,638 again, and losing that level could trigger a deeper bearish correction toward the $4,600 psychological area.
Gold 1H Chart
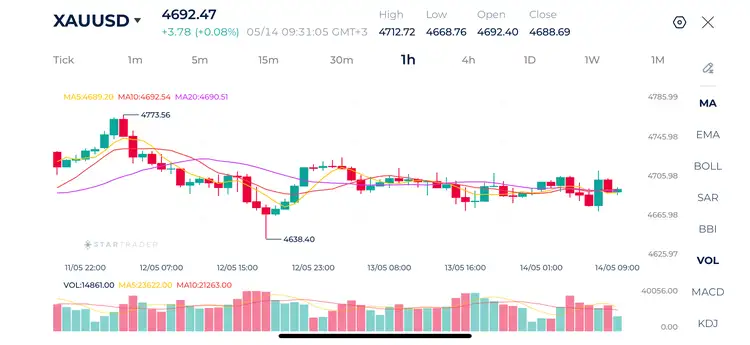
| Resistance | $4,715 | $4,736 | $4,773 |
| Support | $4,667 | $4,638 | $4,615 |
Brent Technical Analysis
Brent crude oil has shifted into a corrective bearish phase after failing to sustain momentum above the $111.40 region. Price is currently trading beneath the MA20, while the MA5 and MA10 are flattening around current levels.
The inability to reclaim the moving averages aggressively shows that buyers are still cautious. Volume has also faded during recent rebounds, another sign that bullish conviction is currently limited.
The key support zone remains around $107.15-$106.00. As long as price stays above that region, oil may still be forming a medium-term consolidation range. However, a break below those levels would likely accelerate downside pressure toward lower support regions.
On the upside, bulls need to reclaim and hold above $109.30 first to improve short-term sentiment. A stronger breakout above $110.30 would be needed to fully restore bullish momentum and reopen the path toward the previous $111.40 high.
Brent 1H Chart
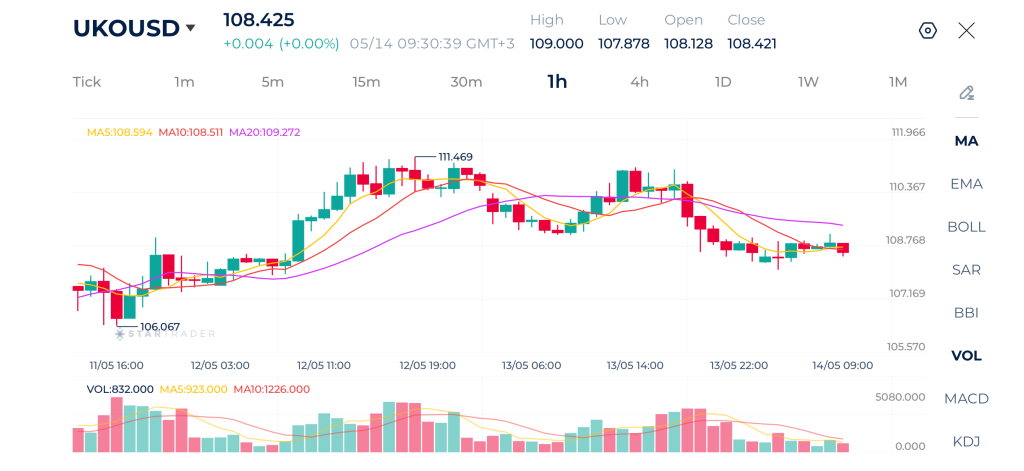
| Resistance | $109.30 | $110.40 | $112.00 |
| Support | $107.15 | $106.05 | $104.20 |
Risk Disclaimer: This material is provided for informational purposes only and does not constitute a recommendation or investment advice. Trading financial instruments on margin involves substantial risk and may not be appropriate for all investors.
Tags
Open Live Account
Please enter a valid country
No results found
No results found
Please enter a valid email
Please enter a valid verification code
1. 8-16 characters + numbers (0-9) 2. blend of letters (A-Z, a-z) 3. special characters (e.g, !a#S%^&)
Please enter the correct format
Please tick the checkbox to proceed
Please tick the checkbox to proceed
Important Notice
STARTRADER does not accept any applications from Australian residents.
To comply with regulatory requirements, clicking the button will redirect you to the STARTRADER website operated by STARTRADER PRIME GLOBAL PTY LTD (ABN 65 156 005 668), an authorized Australian Financial Services Licence holder (AFSL no. 421210) regulated by the Australian Securities and Investments Commission.
CONTINUEImportant Notice for Residents of the United Arab Emirates
In alignment with local regulatory requirements, individuals residing in the United Arab Emirates are requested to proceed via our dedicated regional platform at startrader.ae, which is operated by STARTRADER Global Financial Consultation & Financial Analysis L.L.C.. This entity is licensed by the UAE Capital Market Authority (CMA) under License No. 20200000241, and is authorised to introduce financial services and promote financial products in the UAE.
Please click the "Continue" button below to be redirected.
CONTINUEError! Please try again.

