








 Web Trader MT5









Gold Technical Analysis
Gold is currently trading around $4,365 after experiencing a notable pullback from the latest high of $4,435. The broader 1-hour structure remains bullish. However, the latest price action shows a clear loss of short-term momentum.
The moving averages are beginning to provide an early warning for the short-term trend. Price is currently below both of MA(5) and MA(10) indicating short-term bearish momentum. A successful rebound from the $4,350–$4,375 region would suggest that the current decline is simply a correction within the broader uptrend. Conversely, a sustained break below the 20-hour MA would increase the likelihood of a deeper retracement.
The key immediate support area is therefore $4,350–$4,375, followed by $4,300–$4,320. If gold falls below $4,300, the correction could extend toward $4,225–$4,250. On the upside, the first resistance is around $4,390–$4,400, followed by the recent high at $4,435. A break above $4,435 would restore strong bullish momentum and potentially expose the $4,470–$4,475 region.
Overall, the outlook is bullish on the broader timeframe but bearish-to-neutral in the immediate term, with $4,350–$4,375 being the critical area to watch.
Gold 1H Chart
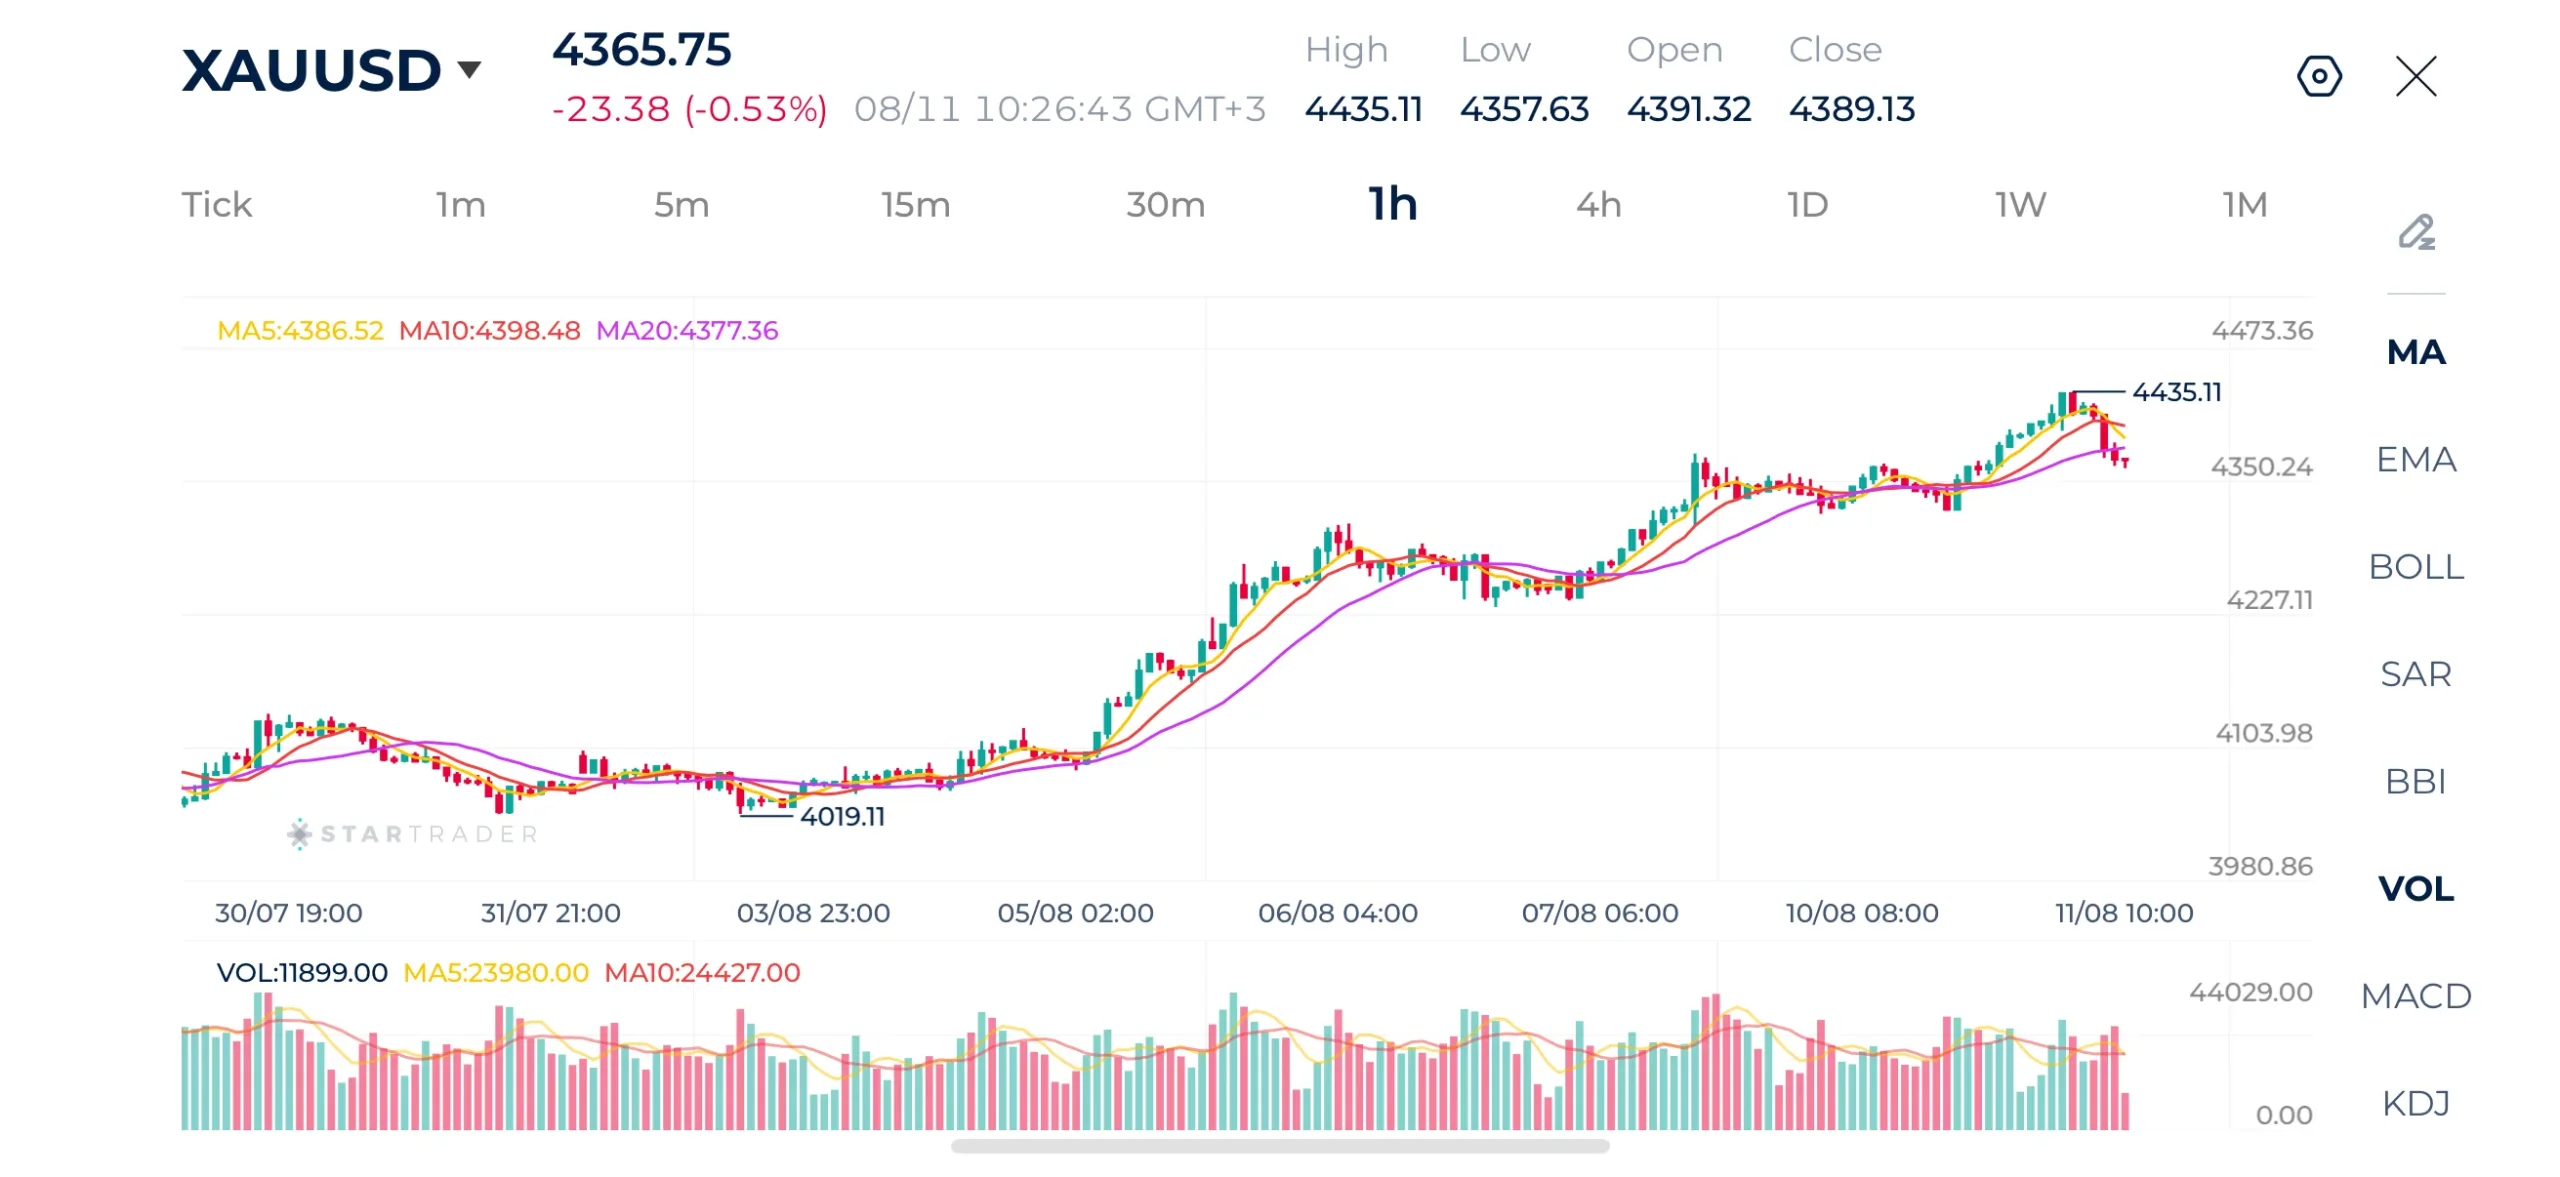
Source: STARTRADER app | Gold faces resistance after breaking above $4,400 for the first time since mid-June
| Resistance | $4,394 | $4,435 | $4,478 |
|---|---|---|---|
| Support | $4,318 | $4,303 | $4,277 |
Brent Technical Analysis
Brent crude is showing a strong technical picture. The 1-hour chart shows a clear sequence of higher highs and higher lows. Price has now moved above the previous consolidation area around $85–$86 and is approaching the psychologically important $90.00 level. The latest bullish candle has pushed the market above the recent range.
The moving averages strongly confirm the bullish structure. Price is comfortably above all three averages: MA(5), MA(10), and MA(20), while the shorter-term averages are positioned above the longer-term average. The next important resistance is around $90.70–$91.00, followed by the previous major high at $92.10. A decisive break above $92.10 would represent a significant technical development and could potentially expose the $93.00–$94.00 region.
The first support area is around $89.40–$89.60. Below that, $89.00–$89.20 becomes important, followed by the stronger support zone around $88.10–$88.20. Overall, the technical bias is strongly bullish above $88.20, with a move through $90.70 potentially reaching $92.10. A sustained break below $88.20, however, would significantly weaken the current bullish structure.
Brent 1H Chart
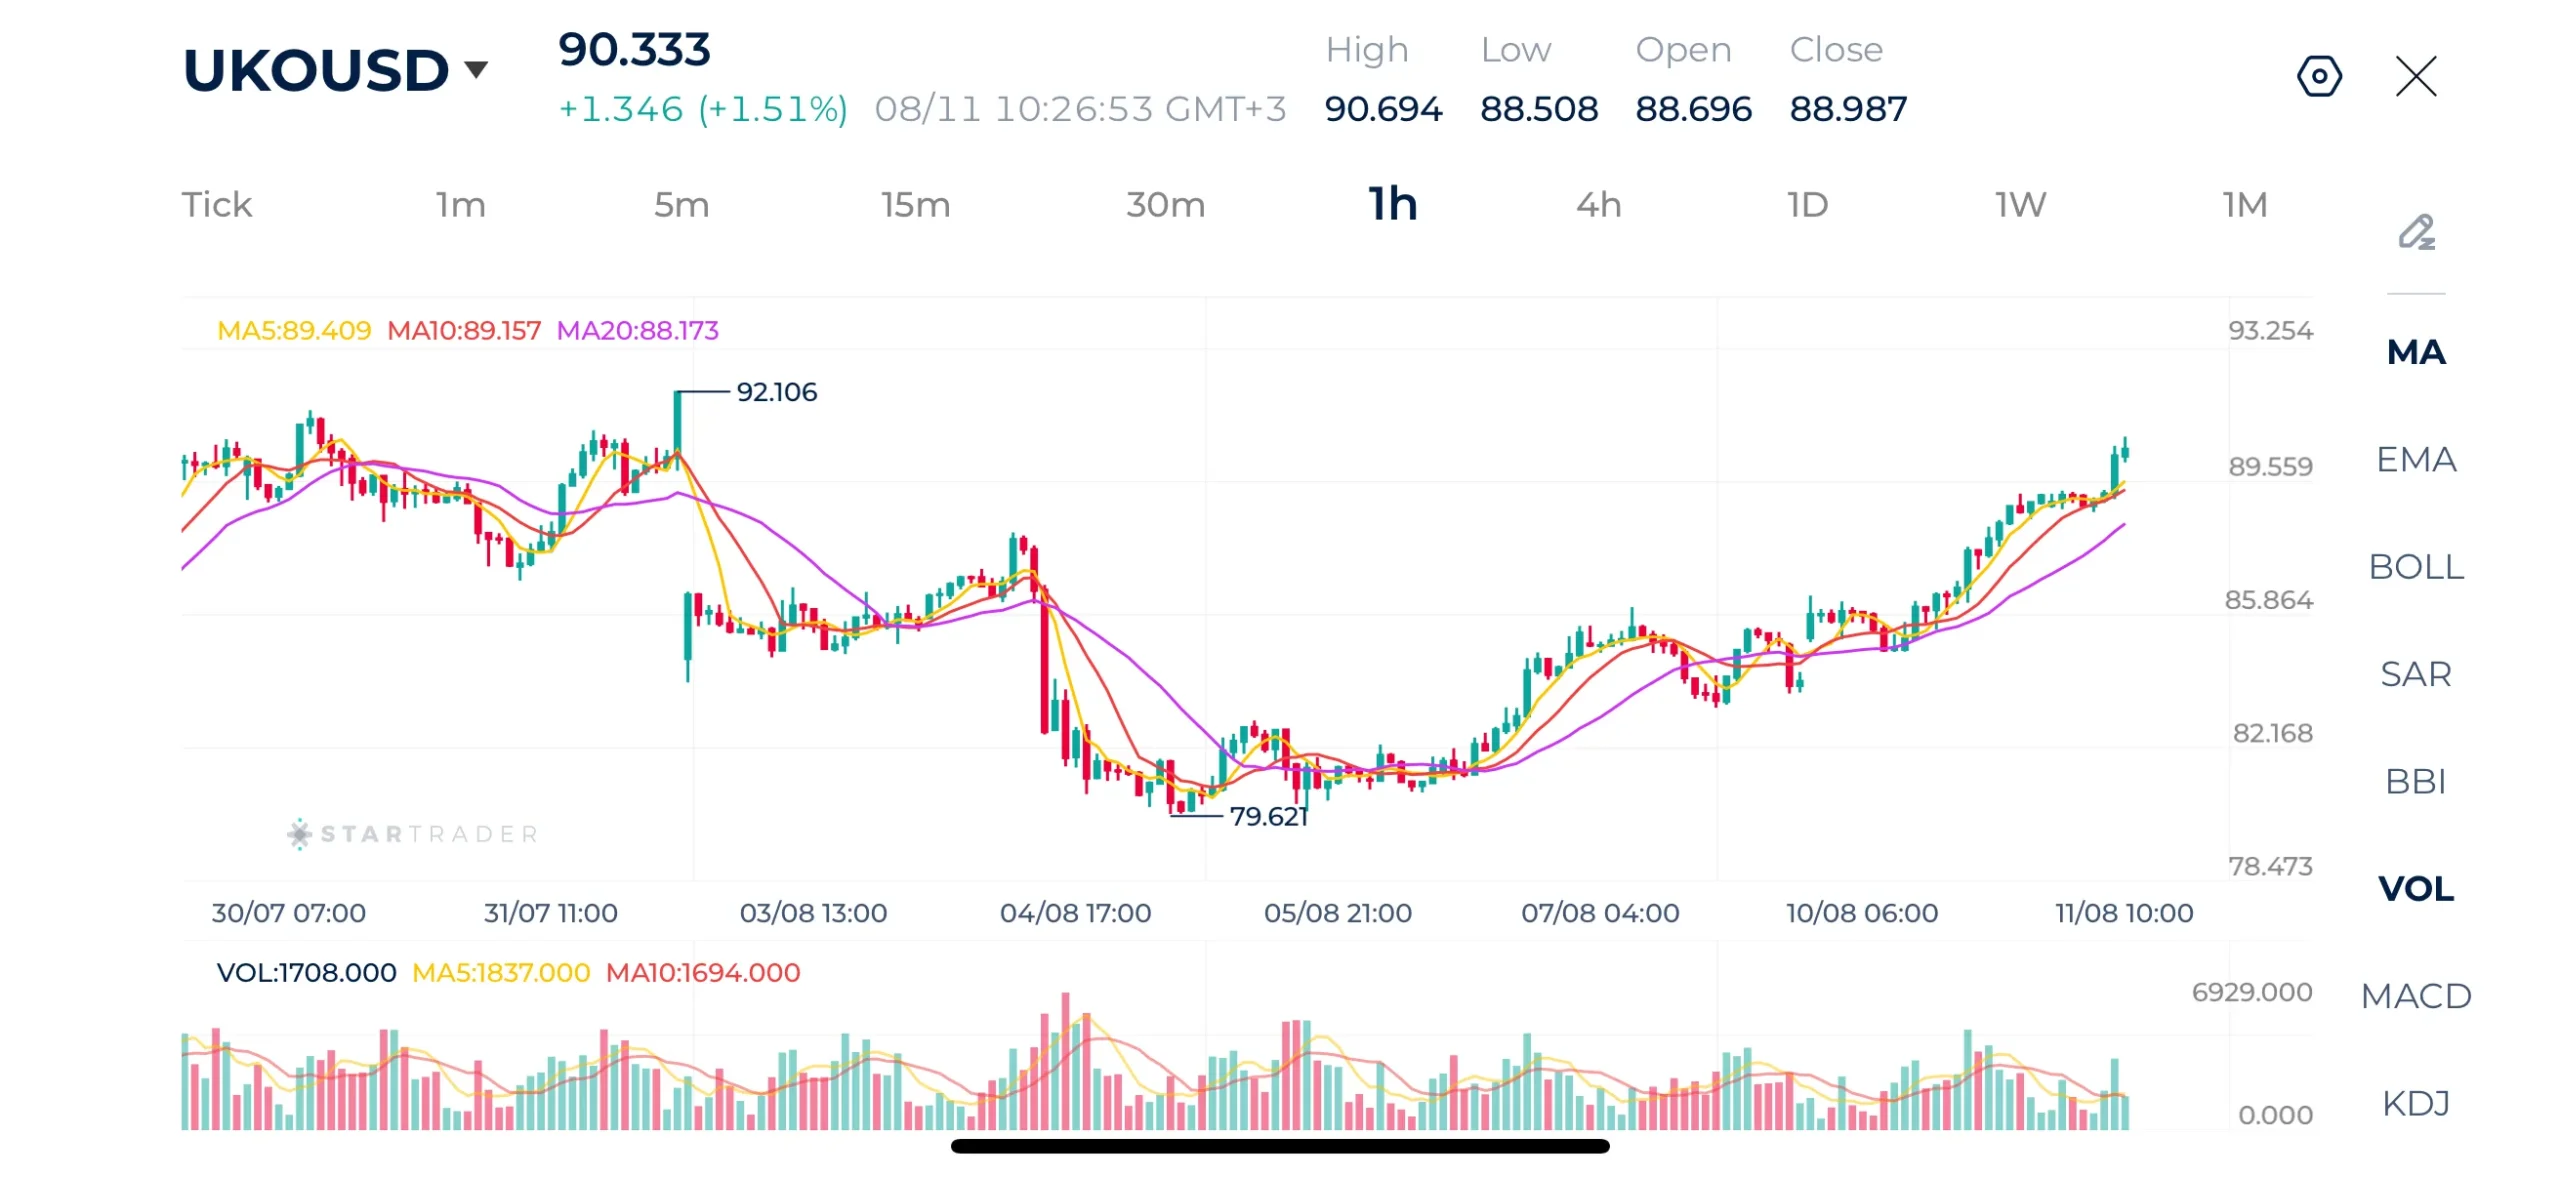
Source: STARTRADER app | Crude brent advances higher as it nears $90 level
| Resistance | $90.70 | $91.68 | $92.75 |
|---|---|---|---|
| Support | $89.40 | $88.10 | $87.34 |
Nasdaq-100 Technical Analysis
Nasdaq-100 is trading around 29,667 on the 1-hour chart, after failing to sustain the move toward the recent high of 29,970. The broader structure remains bullish, as the index has advanced strongly from the 28,208 area and continues to trade within a relatively elevated range. However, the latest price action has become more sideways-to-bearish, with several lower highs developing after the recent peak. The market is currently testing the lower part of the short-term consolidation range.
Price is currently below all three averages MA(5), MA(10), and MA(20). The first important resistance is around 29,700–29,775, followed by the recent high near 29,970–30,000. A sustained break above 30,000 would restore the stronger bullish momentum and potentially open the way toward 30,100–30,200.
On the downside, the immediate support is around 29,580–29,600. A break below this zone could expose 29,380–29,400. Below that, 29,090 becomes the next major technical support.
Overall, the short-term bias is neutral to mildly bearish below 29,700, while the broader trend remains bullish. A recovery above 29,775 would improve the outlook, whereas a break below 29,580 would increase the probability of a deeper correction.
Nasdaq-100 1H Chart
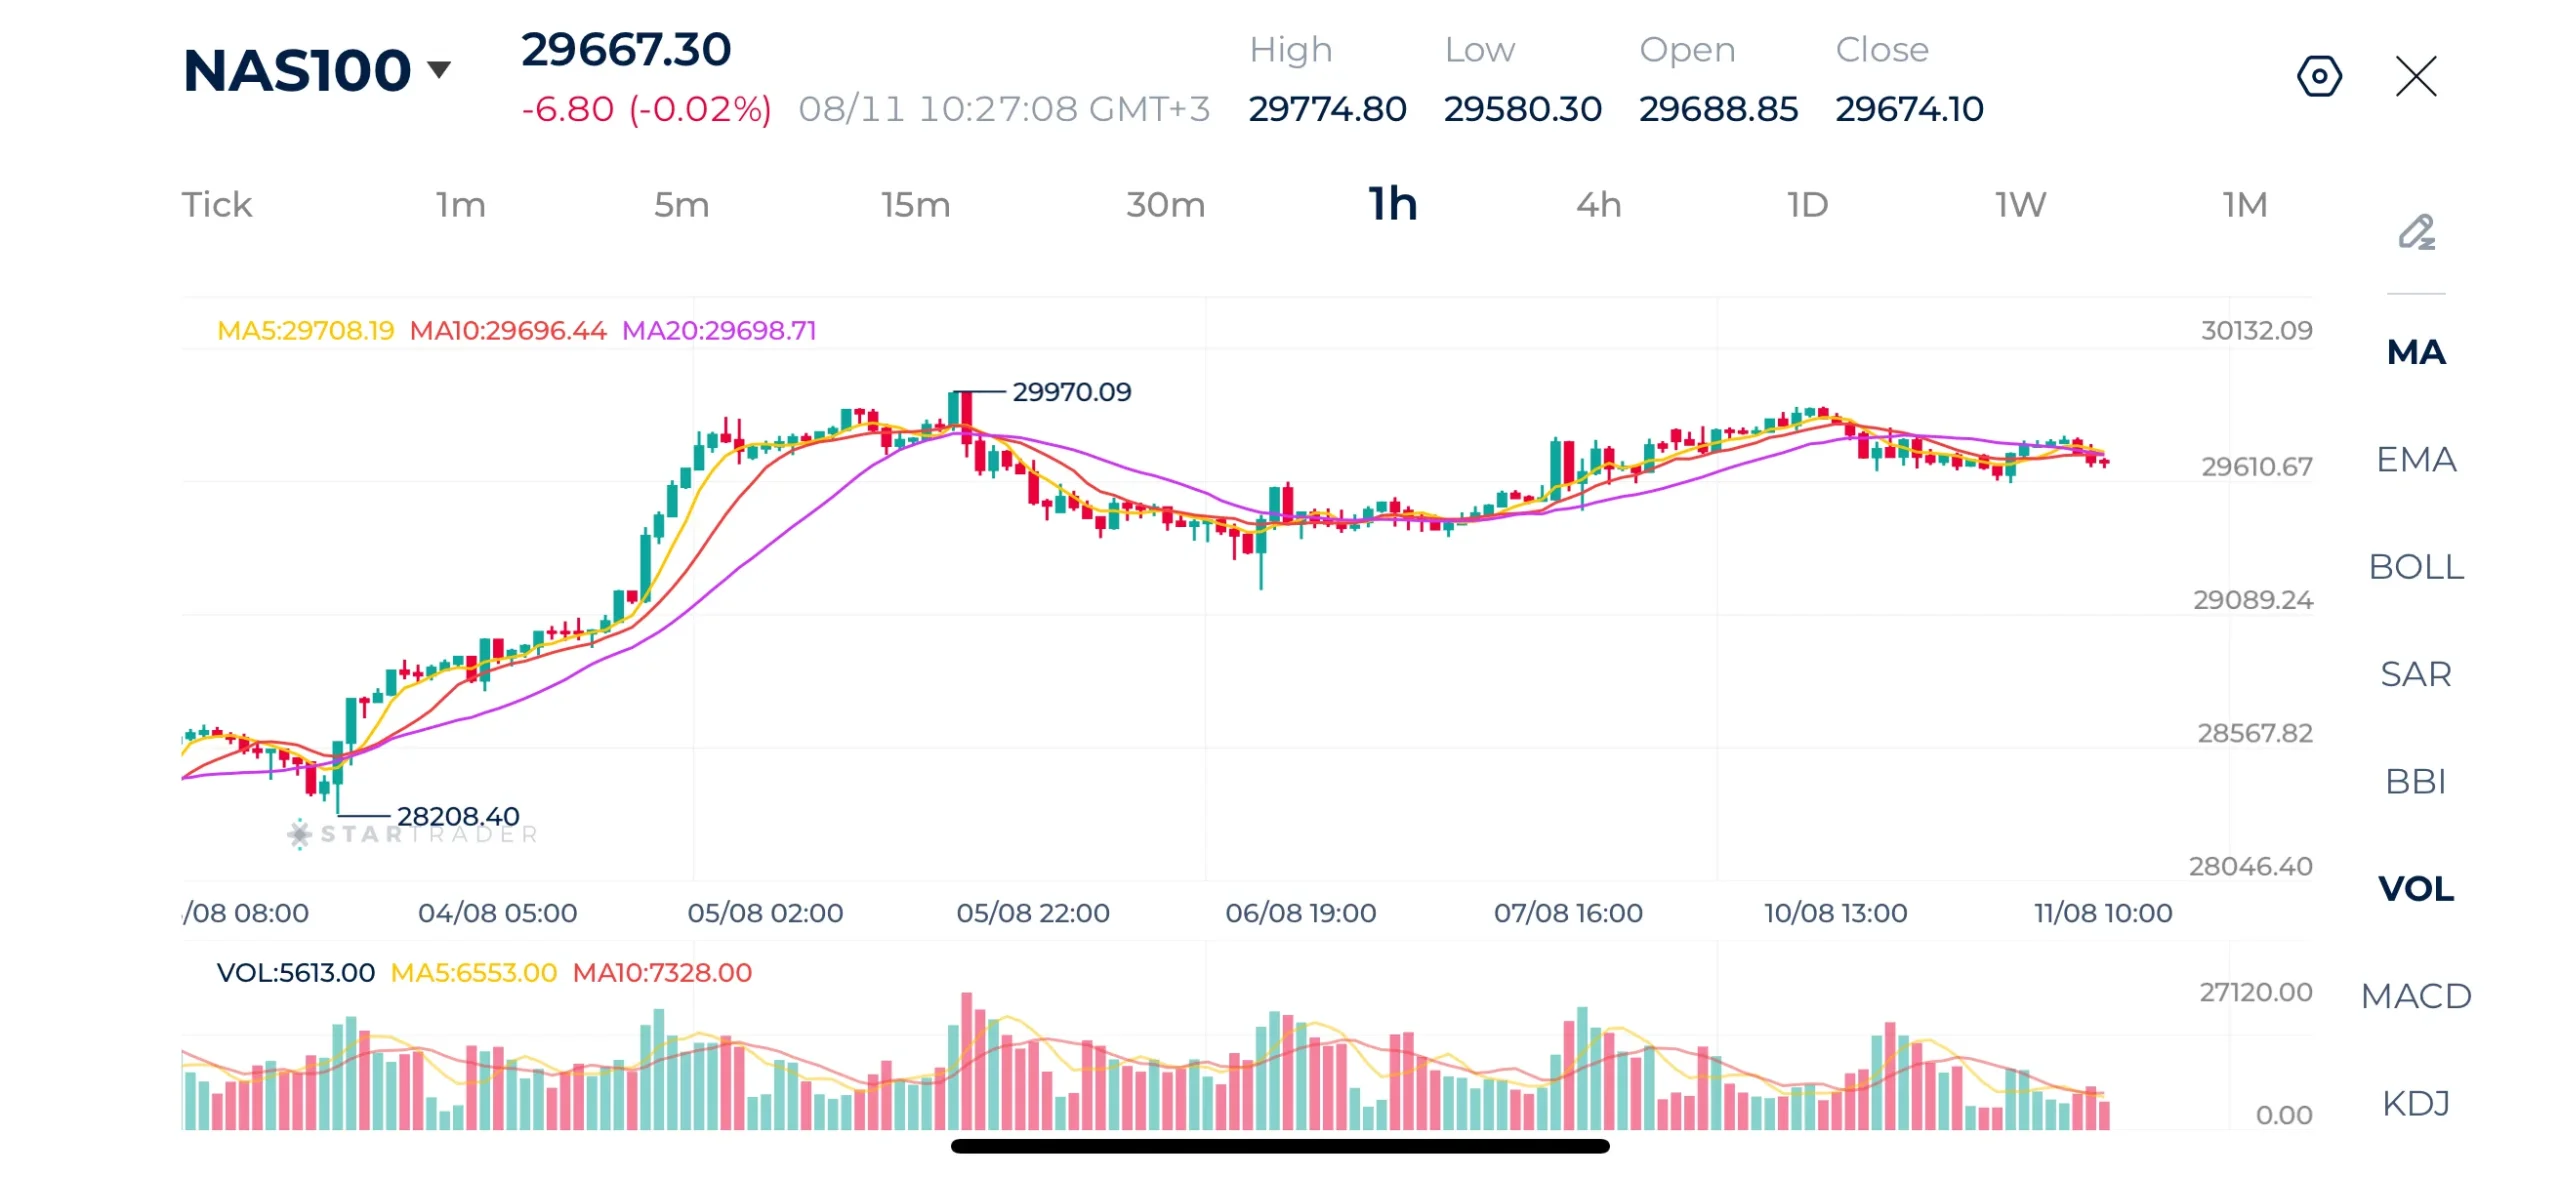
Source: STARTRADER app | Nasdaq-100 shows sideways movement near its record highs
| Resistance | 29,750 | 29,877 | 29,950 |
|---|---|---|---|
| Support | 29,580 | 29,380 | 29,400 |
Risk Disclaimer: This material is provided for informational purposes only and does not constitute a recommendation or investment advice. Trading financial instruments on margin involves substantial risk and may not be appropriate for all investors.
Tags


Open Live Account
 Email Address
 Phone Number
Important Notice
STARTRADER does not accept any applications from Australian residents.
To comply with regulatory requirements, clicking the button will redirect you to the STARTRADER website operated by STARTRADER PRIME GLOBAL PTY LTD (ABN 65 156 005 668), an authorized Australian Financial Services Licence holder (AFSL no. 421210) regulated by the Australian Securities and Investments Commission.
Important Notice for Residents of the United Arab Emirates
In alignment with local regulatory requirements, individuals residing in the United Arab Emirates are requested to proceed via our dedicated regional platform at startrader.ae, which is operated by STARTRADER Global Financial Consultation & Financial Analysis L.L.C.. This entity is licensed by the UAE Capital Market Authority (CMA) under License No. 20200000241, and is authorised to introduce financial services and promote financial products in the UAE.
Please click the "Continue" button below to be redirected.


