








 Web Trader MT5













Silver Technical Analysis
Silver has staged a strong rebound after falling to $75.40 yesterday, now trading near $78.55. The move has pushed price back above all three moving averages, with MA5 above MA10 and both above MA20, a constructive short-term bullish signal.
Immediate resistance is located at $78.95, followed by $79.50 and $81.06. If bulls clear $78.95, upside momentum could accelerate. Support sits at $78.20, then $77.60, with stronger support at $76.85. Bias is bullish while price remains above the MA20 and recent higher lows hold.
Gold exhibits similar price action as price faced a strong resistance around $4,900 before dropping sharply to $4,670 yesterday. Since then, the precious metal rebounded to $4,763.
Silver 1H Chart
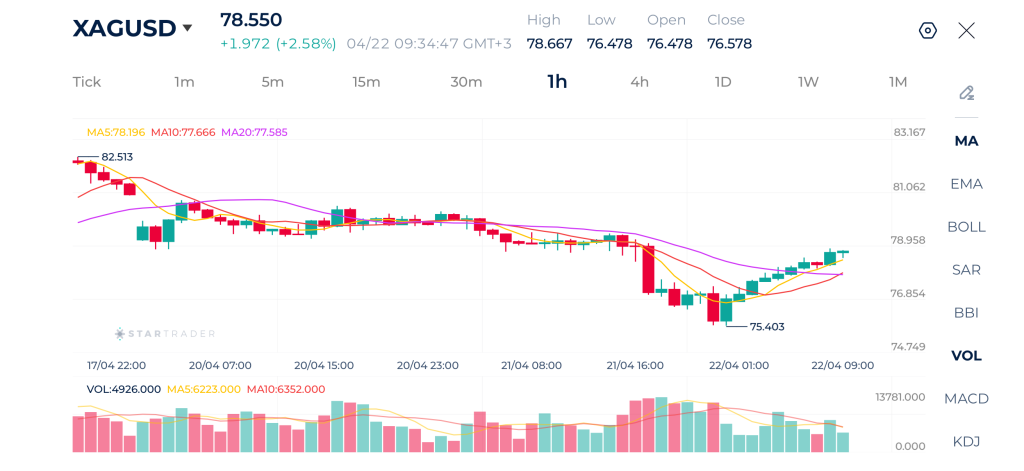
| Resistance | $78.95 | $79.50 | $81.06 |
| Support | $78.20 | $77.60 | $76.85 |
Brent Technical Analysis
Brent crude surged sharply to $101.84 before reversing lower and is now trading near $98.30, showing profit-taking after the risk-premium rally. Price remains above the moving average MA20, meaning the broader short-term structure is still constructive, but momentum has cooled as MA5 and MA10 roll lower.
Immediate support is seen at $98.00–$97.95 near the moving average MA20. If that zone breaks, sellers may target $97.10, then $94.60. On the upside, resistance sits at $98.90, followed by $100.00 and the recent high at $101.85. Bias is neutral-to-bullish while price holds above MA20, but short-term consolidation is underway.
Brent 1H Chart
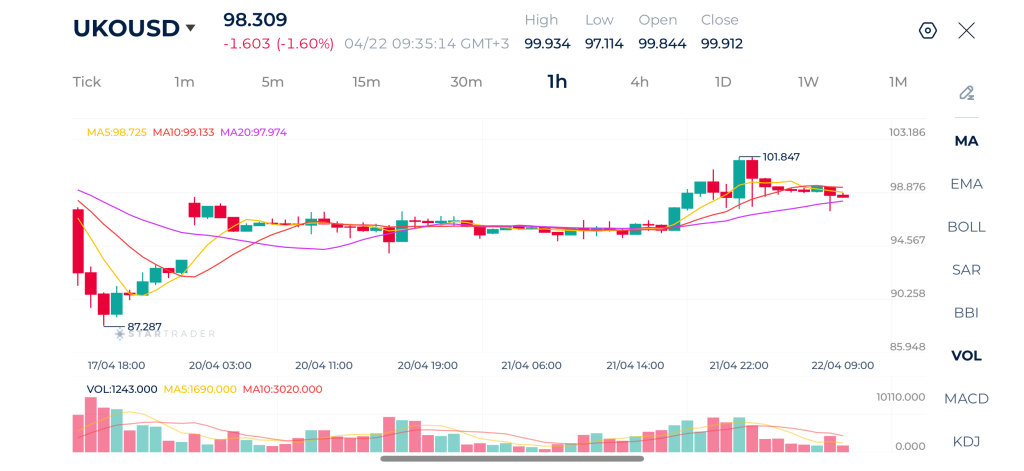
| Resistance | $98.90 | $100.00 | $101.85 |
| Support | $98.00 | $97.10 | $94.60 |
Dow Jones Technical Analysis
The Dow remains in recovery mode after dropping from 49,892 to the 49,113 area. Price has stabilized and rebounded toward 49,467, reclaiming the moving averages MA5 and MA10, while trading around the MA20. This suggests sellers have lost momentum and buyers are trying to regain control.
Immediate resistance stands at 49,500, then 49,690. A breakout above those levels could reopen the path toward 49,892. Support is found at 49,400, followed by 49,113. If price slips back below moving average MA20, recovery momentum may fade. Current bias is neutral with a slight bullish recovery tone.
Dow Jones 1H Chart
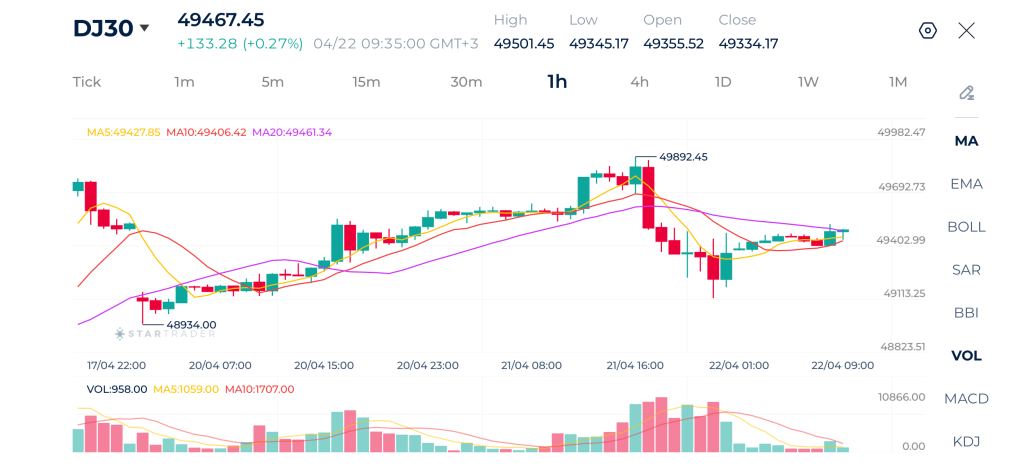
| Resistance | 49,500 | 49,690 | 49,892 |
| Support | 49,400 | 49,113 | 48,627 |
Risk Disclaimer: This material is provided for informational purposes only and does not constitute a recommendation or investment advice. Trading financial instruments on margin involves substantial risk and may not be appropriate for all investors.
Tags


Open Live Account
 Email Address
 Phone Number
Important Notice
STARTRADER does not accept any applications from Australian residents.
To comply with regulatory requirements, clicking the button will redirect you to the STARTRADER website operated by STARTRADER PRIME GLOBAL PTY LTD (ABN 65 156 005 668), an authorized Australian Financial Services Licence holder (AFSL no. 421210) regulated by the Australian Securities and Investments Commission.
Important Notice for Residents of the United Arab Emirates
In alignment with local regulatory requirements, individuals residing in the United Arab Emirates are requested to proceed via our dedicated regional platform at startrader.ae, which is operated by STARTRADER Global Financial Consultation & Financial Analysis L.L.C.. This entity is licensed by the UAE Capital Market Authority (CMA) under License No. 20200000241, and is authorised to introduce financial services and promote financial products in the UAE.
Please click the "Continue" button below to be redirected.


