


Gold Technical Analysis
Gold prices rallied from $3,312 to $3,399 but is now consolidating.
Price is still above the 30-period moving average, indicating that the medium-term uptrend is still intact.
Shorter moving averages MA(5) and MA(10) are flattening and slightly crossing downward, showing reduced momentum.
MACD line is above zero but the histogram has turned red, indicating that bullish momentum is fading.
Medium-term bias is still bullish on gold, but price is currently in consolidation phase.
Gold (XAUUSD) 1H Chart

| Resistance | $3,400 | $3,421 | $3,456 |
| Support | $3,384 | $3,373 | $3,361 |
S&P500 Technical Analysis
Price is consolidating near 6,480 levels after reaching a new record high yesterday. The overall bias is still bullish.
Moving averages MA(5) and MA(10) are moving close together and hovering above the 30-period moving average on the hourly chart, which suggests mild bullish momentum but losing strength.
Price is near resistance around 6,489
MACD shows weakening momentum and currently signal and MACD lines are converging, which means possible sideways or correction phase.
The outlook on the index is still bullish but with caution. Watch for breakout above 6,500 for continuation, otherwise risk of pullback to 6,450 support.
S&P500 1H Chart
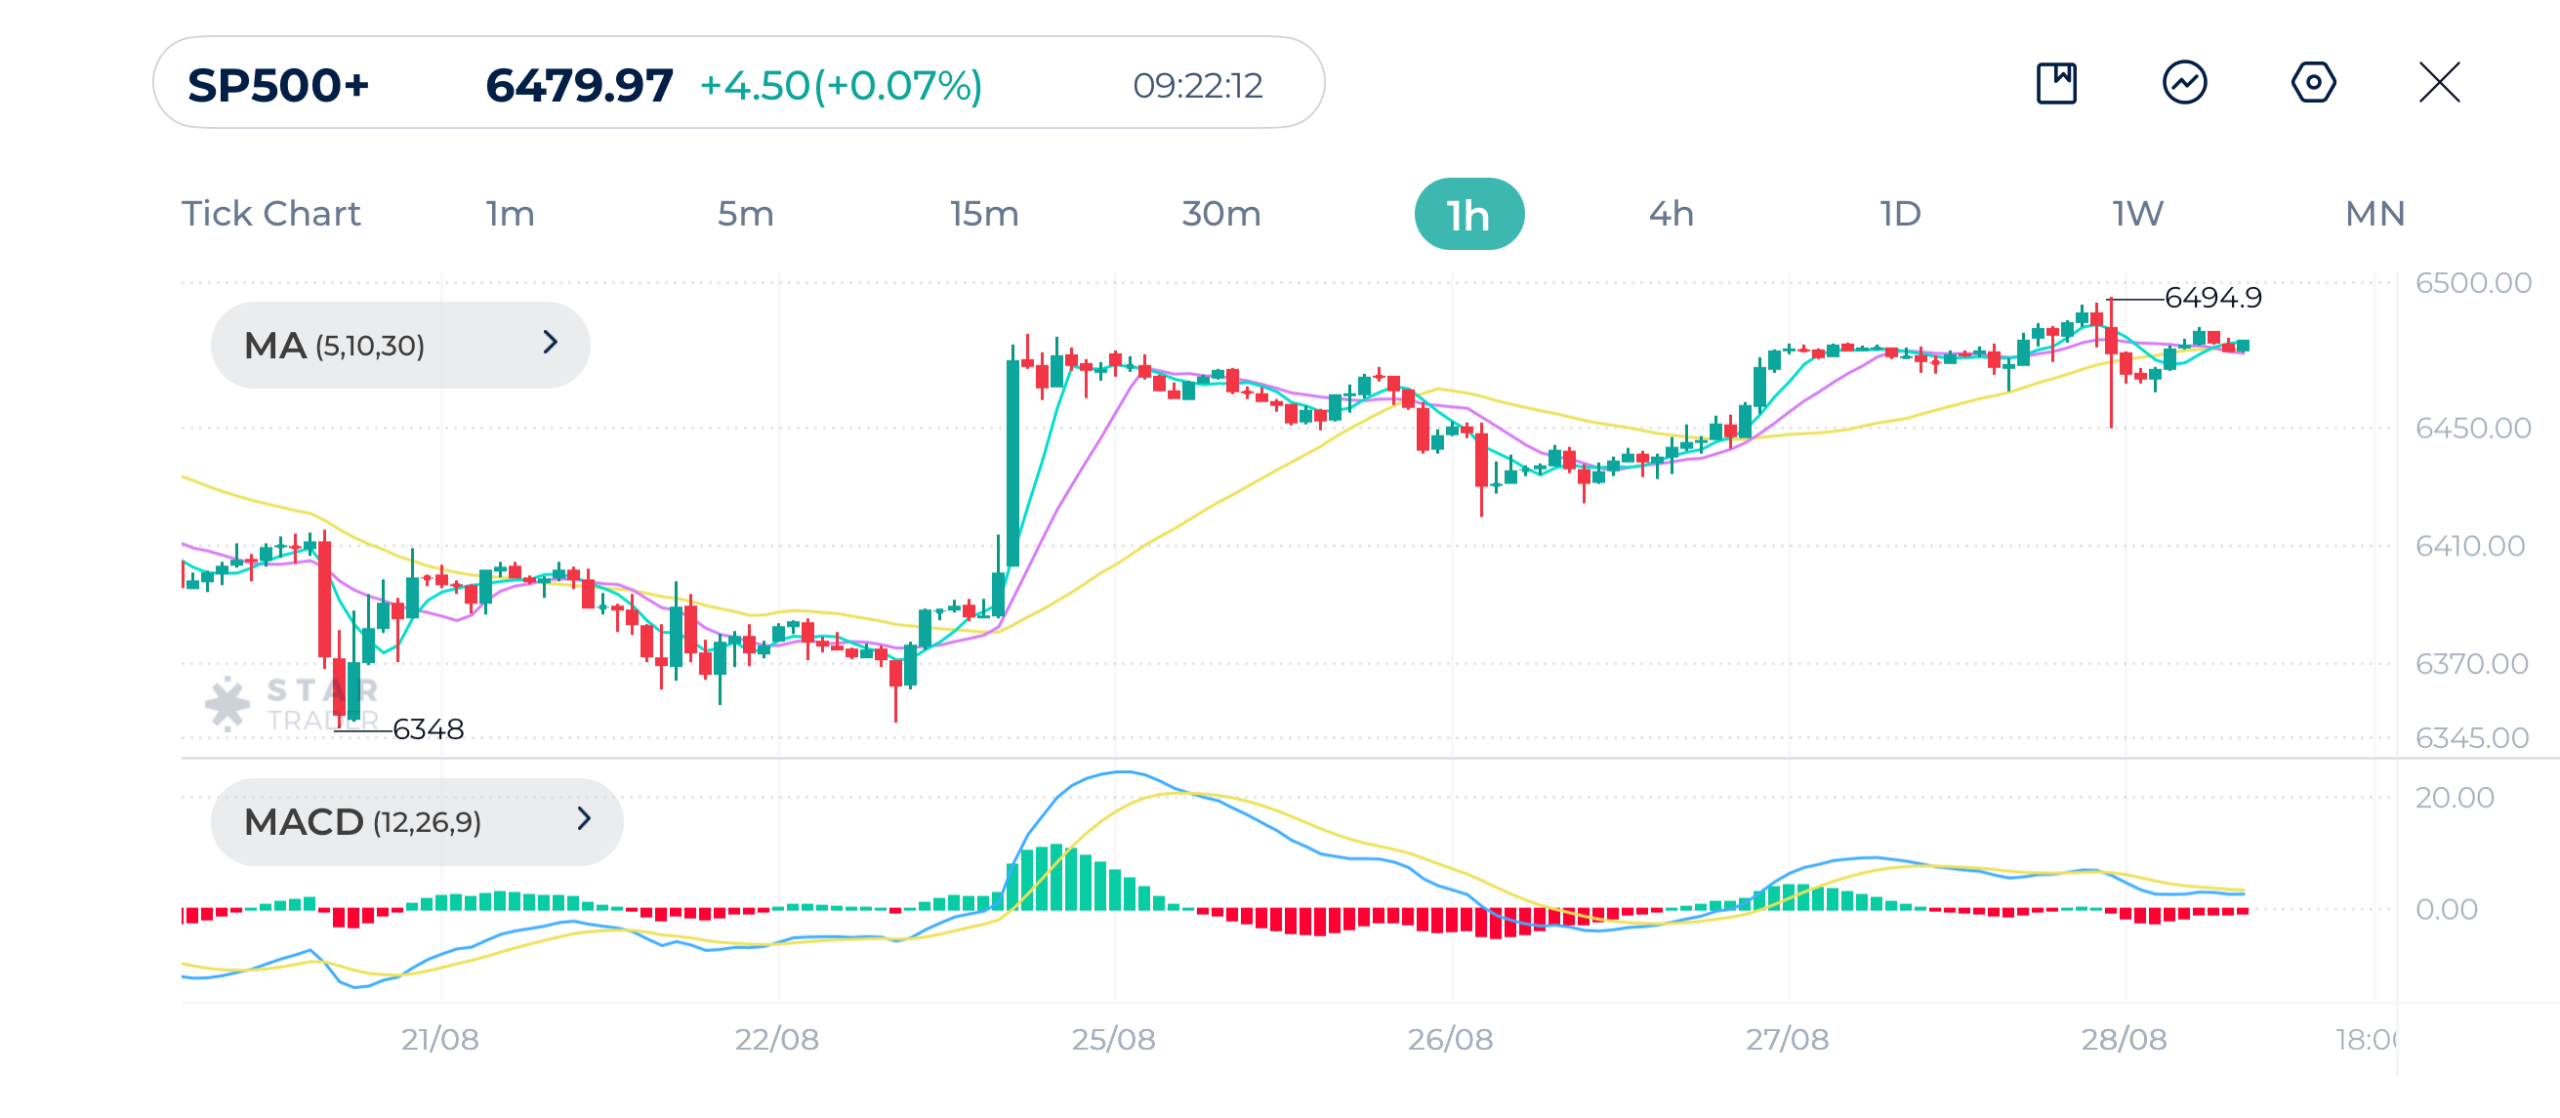
| Resistance | 6,489 | 6,500 | 6,525 |
| Support | 6,456 | 6,437 | 6,419 |
Ether Technical Analysis
Following the recent surge to a new all-time high for Ether to 4,955, price retraced heavily to around 4,200, and is currently rebounding.
Moving averages MA(5) and MA(10) on the hourly chart show indecisiveness. However, the 30-period moving average acts as resistance around 4,600.
Momentum is still weak on the MACD as the histogram is near zero level.
We may see deeper correction on Ether till the end of the week. However, the overall trend is still bullish.
Breaking above $4,650 may open the door for further gains towards $4,950 and possibly a new all-time high.
Ether 1H Chart
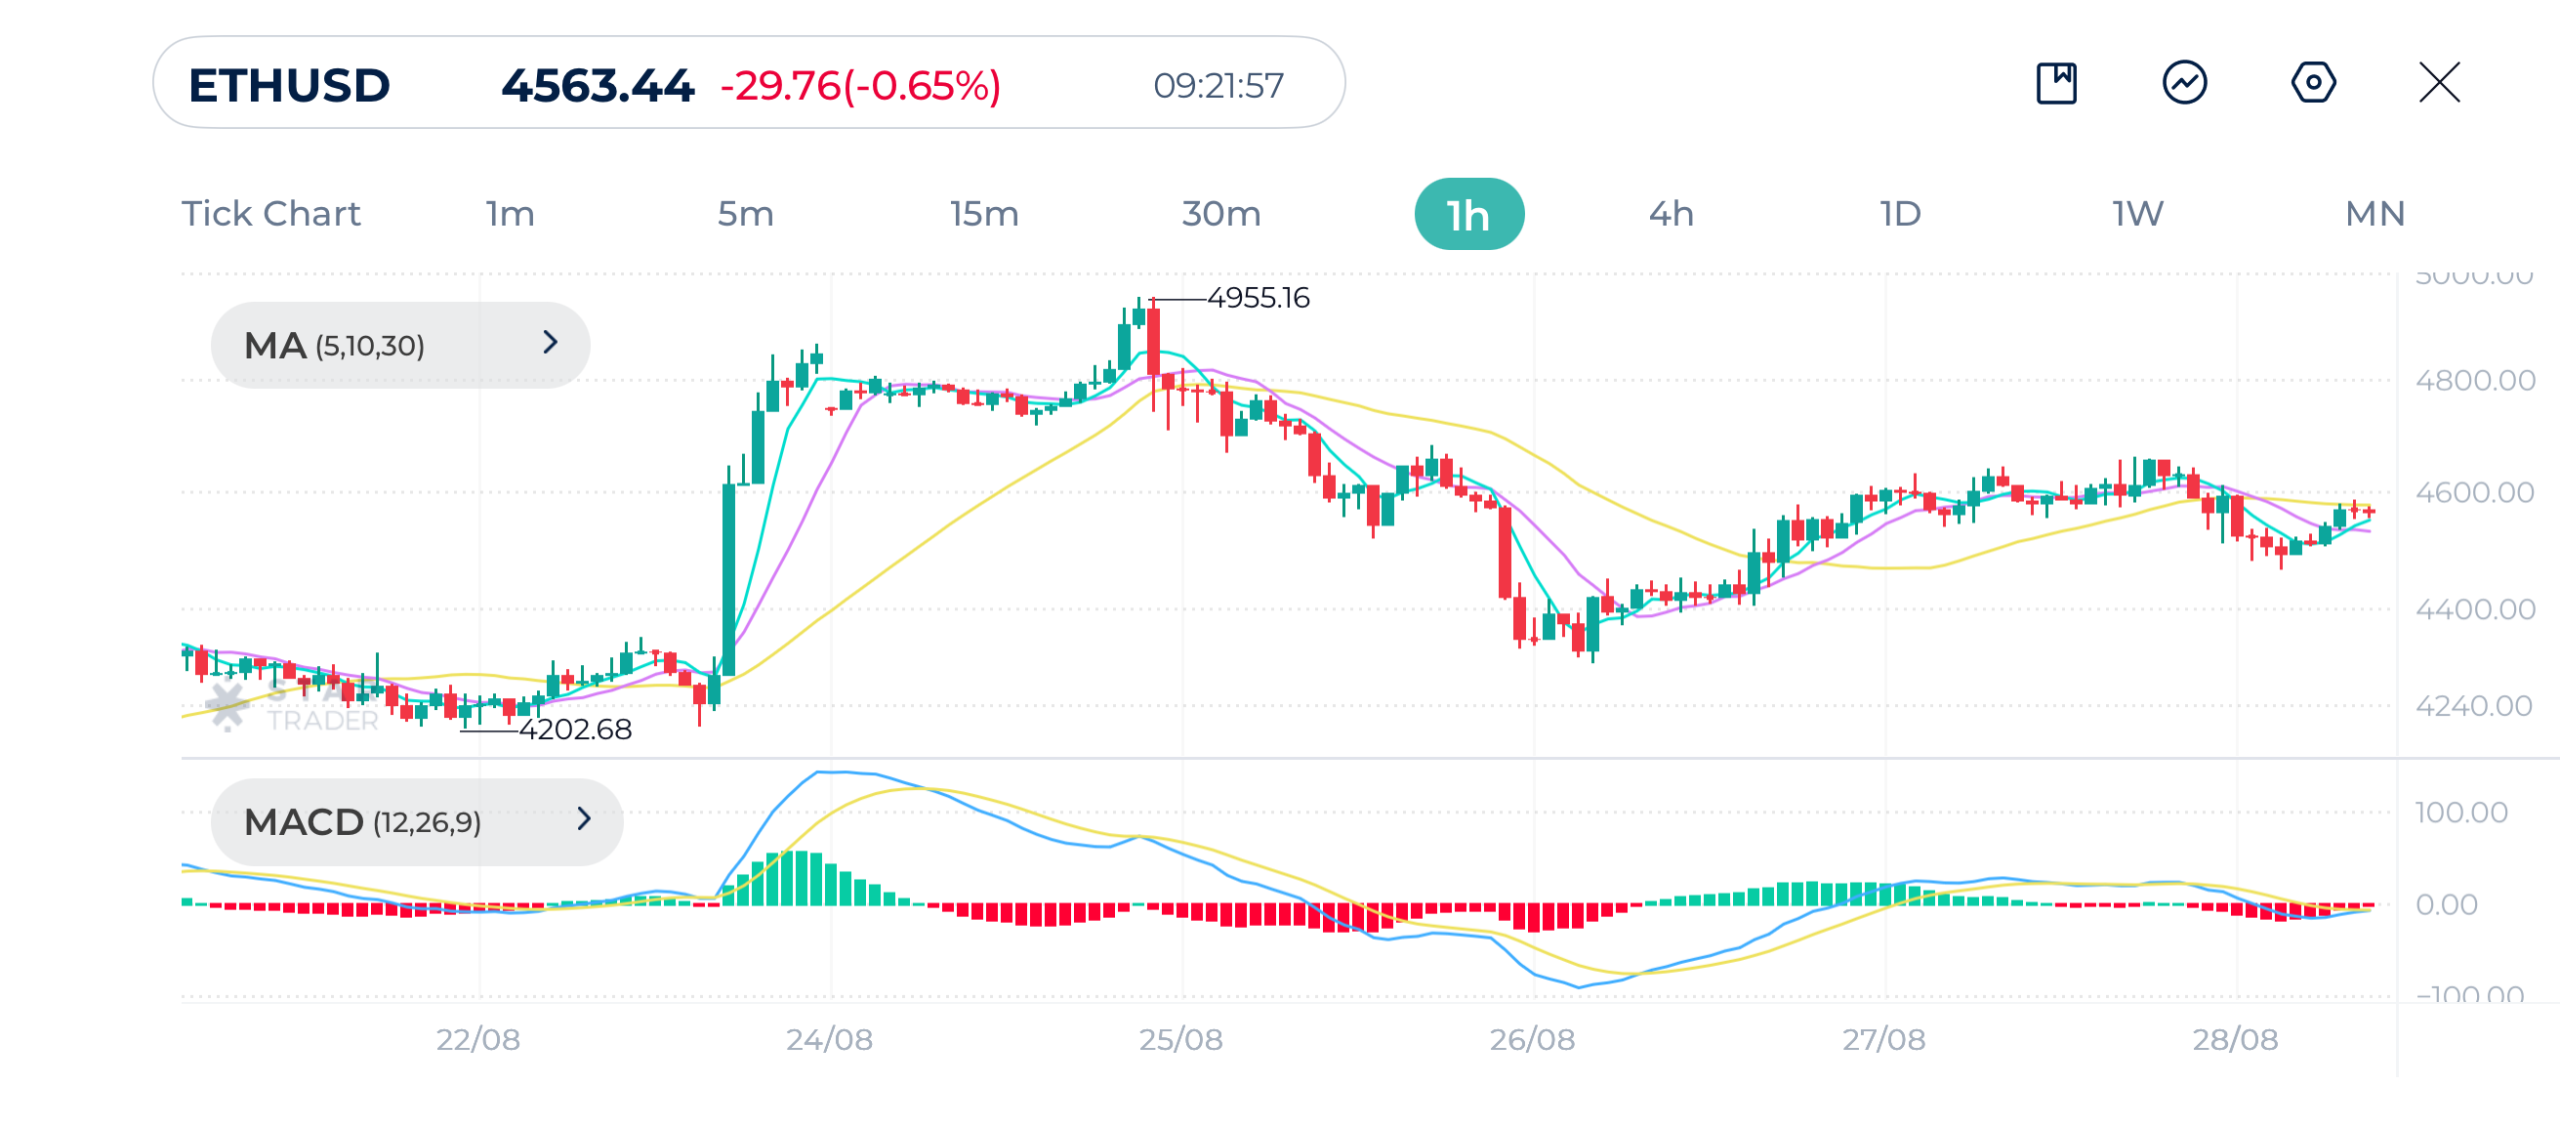
| Resistance | $4,464 | $4,736 | $4,884 |
| Support | $4,468 | $4,395 | $4,207 |
Tags
Open Live Account
Please enter a valid country
No results found
No results found
Please enter a valid email
Please enter a valid verification code
1. 8-16 characters + numbers (0-9) 2. blend of letters (A-Z, a-z) 3. special characters (e.g, !a#S%^&)
Please enter the correct format
Please tick the checkbox to proceed
Please tick the checkbox to proceed
Important Notice
STARTRADER does not accept any applications from Australian residents.
To comply with regulatory requirements, clicking the button will redirect you to the STARTRADER website operated by STARTRADER PRIME GLOBAL PTY LTD (ABN 65 156 005 668), an authorized Australian Financial Services Licence holder (AFSL no. 421210) regulated by the Australian Securities and Investments Commission.
CONTINUEImportant Notice for Residents of the United Arab Emirates
In alignment with local regulatory requirements, individuals residing in the United Arab Emirates are requested to proceed via our dedicated regional platform at startrader.ae, which is operated by STARTRADER Global Financial Consultation & Financial Analysis L.L.C.. This entity is licensed by the UAE Capital Market Authority (CMA) under License No. 20200000241, and is authorised to introduce financial services and promote financial products in the UAE.
Please click the "Continue" button below to be redirected.
CONTINUEError! Please try again.

