


Gold Technical Analysis
Gold remains under strong bearish pressure after extending its decline from the $4,330 area toward the recent low at $3,959. Although buyers briefly defended support, the market continues trading below all three moving averages, confirming that the broader short-term trend remains negative.
The moving averages remain bearishly aligned, with the MA20 continuing to slope lower.
The market continues to produce lower highs and lower lows. The recent consolidation near $3,980–$4,000 reflects a pause in selling.
The inability to reclaim the MA20 suggests that bullish momentum remains weak, while the recent recovery attempts continue to be met with selling pressure.
Gold remains bearish in the short term. As long as price remains below $4,035–$4,090, rallies are likely to be viewed as selling opportunities. A break below $3,959 would expose $3,925 and potentially $3,900, while a move above $4,090 would be required to signal a more meaningful recovery.
Gold 1H Chart
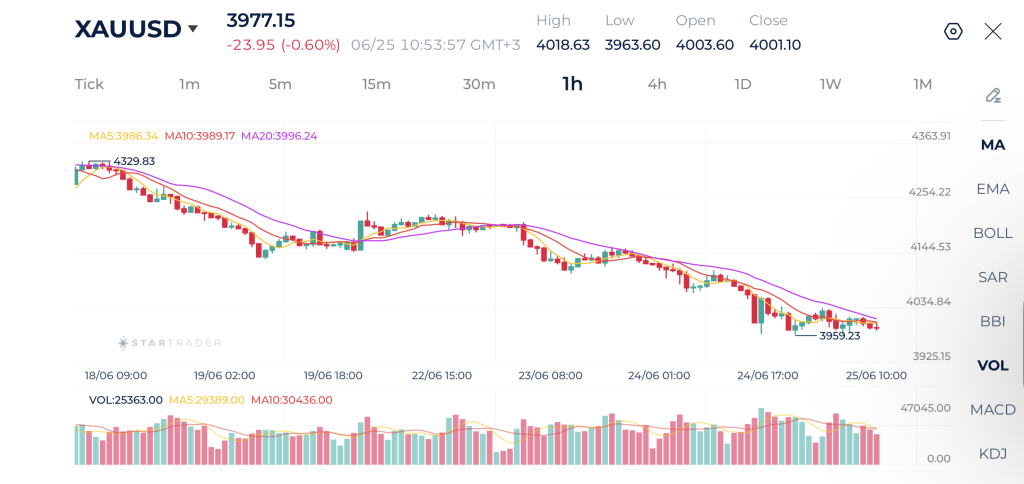
| Resistance | $4,035 | $4,100 | $4,128 |
| Support | $3,935 | $3,900 | $3,857 |
Brent Technical Analysis
Brent crude remains firmly within a bearish trend despite a modest bounce from the recent low at $72.23. The market continues to trade below all major moving averages, while the MA20 remains downward sloping, confirming that sellers still dominate the broader trend.
After several sessions of heavy selling, price has stabilized around the $72.20 support area and is attempting a technical rebound.
The latest bullish candles appear corrective. Buyers have yet to reclaim any significant resistance level, while the moving averages continue acting as dynamic resistance overhead.
The overall trend remains bearish while price stays below $74.00–$74.60. A break below $72.20 would likely accelerate the decline toward $71.20. A sustained recovery above $74.00 would be the first indication that bearish momentum is beginning to fade.
Brent 1H Chart
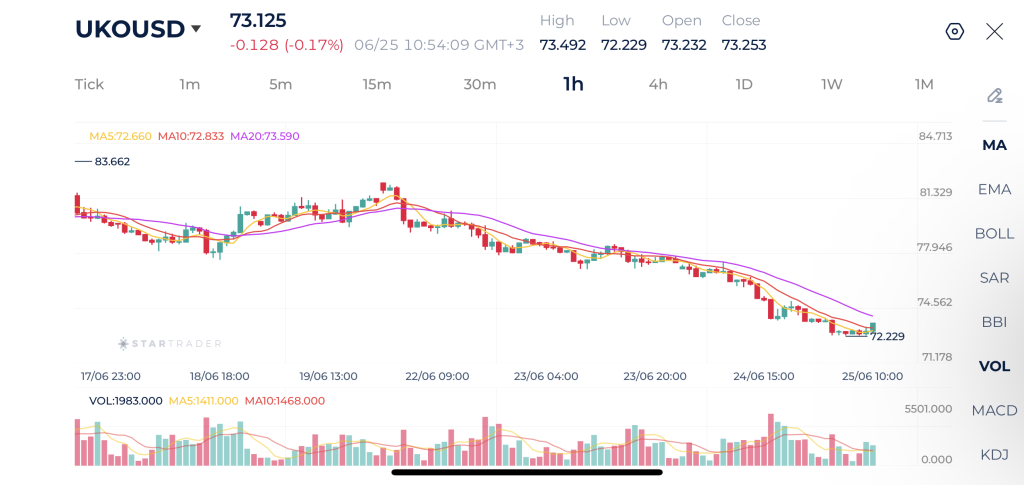
| Resistance | $74.56 | $75.76 | $76.00 |
| Support | $72.00 | $71.48 | $71.00 |
Nasdaq 100 Technical Analysis
The Nasdaq 100 is attempting to recover after last week’s sharp correction from the 30,723 high to the 29,034 low. Price has rebounded strongly from support and is now trading above the 5, 10, and 20-period moving averages, indicating that short-term bullish momentum has returned.
The moving averages have started turning higher, with the MA5 crossing above the MA10 while price remains comfortably above the MA20, suggesting that buyers have regained near-term control.
The short-term outlook has improved. Holding above 29,850 keeps the recovery intact and increases the probability of another test of the 30,150–30,250 resistance zone. However, failure to sustain gains above 30,000 could trigger profit-taking and a retest of 29,650.
Nasdaq 100 1H Chart
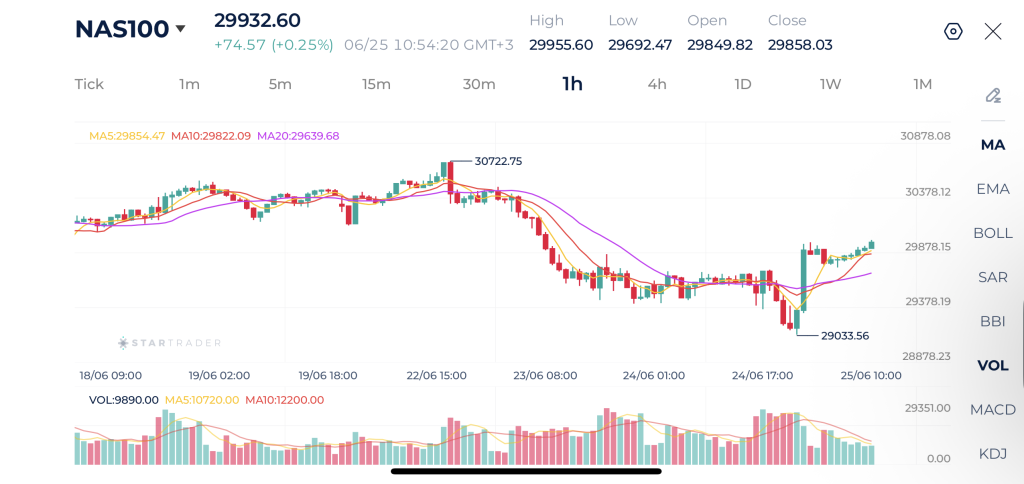
| Resistance | 30,378 | 30,722 | 30,800 |
| Support | 29,378 | 29,033 | 28,721 |
Risk Disclaimer: This material is provided for informational purposes only and does not constitute a recommendation or investment advice. Trading financial instruments on margin involves substantial risk and may not be appropriate for all investors.
Tags
Open Live Account
Please enter a valid country
No results found
No results found
Please enter a valid email
Please enter a valid verification code
1. 8-16 characters + numbers (0-9) 2. blend of letters (A-Z, a-z) 3. special characters (e.g, !a#S%^&)
Please enter the correct format
Please tick the checkbox to proceed
Please tick the checkbox to proceed
Important Notice
STARTRADER does not accept any applications from Australian residents.
To comply with regulatory requirements, clicking the button will redirect you to the STARTRADER website operated by STARTRADER PRIME GLOBAL PTY LTD (ABN 65 156 005 668), an authorized Australian Financial Services Licence holder (AFSL no. 421210) regulated by the Australian Securities and Investments Commission.
CONTINUEImportant Notice for Residents of the United Arab Emirates
In alignment with local regulatory requirements, individuals residing in the United Arab Emirates are requested to proceed via our dedicated regional platform at startrader.ae, which is operated by STARTRADER Global Financial Consultation & Financial Analysis L.L.C.. This entity is licensed by the UAE Capital Market Authority (CMA) under License No. 20200000241, and is authorised to introduce financial services and promote financial products in the UAE.
Please click the "Continue" button below to be redirected.
CONTINUEError! Please try again.

