


 Web Trader MT5













Nasdaq-100 Technical Analysis
The Nasdaq 100 remains under bearish pressure after failing to sustain its recent recovery toward the 29,400–29,500 area. Following the sharp decline toward 28,838, the index entered a consolidation phase before rebounding toward approximately 29,400.
The moving averages reinforce this cautious outlook. The current price is below all three averages MA(5), MA(10), and MA(20), indicating that short-term momentum has turned negative again.
On the downside, immediate support is located around 29,180, followed by the previous low at 28,838 and the broader support area near 28,750. A sustained break below 28,838 would confirm further downside pressure. On the upside, resistance lies around 29,265–29,317, followed by 29,400 and 29,600. A recovery above 29,317 would ease the immediate bearish pressure, while a sustained move above 29,400 would provide stronger evidence of renewed buying interest.
Nasdaq-100 1H Chart
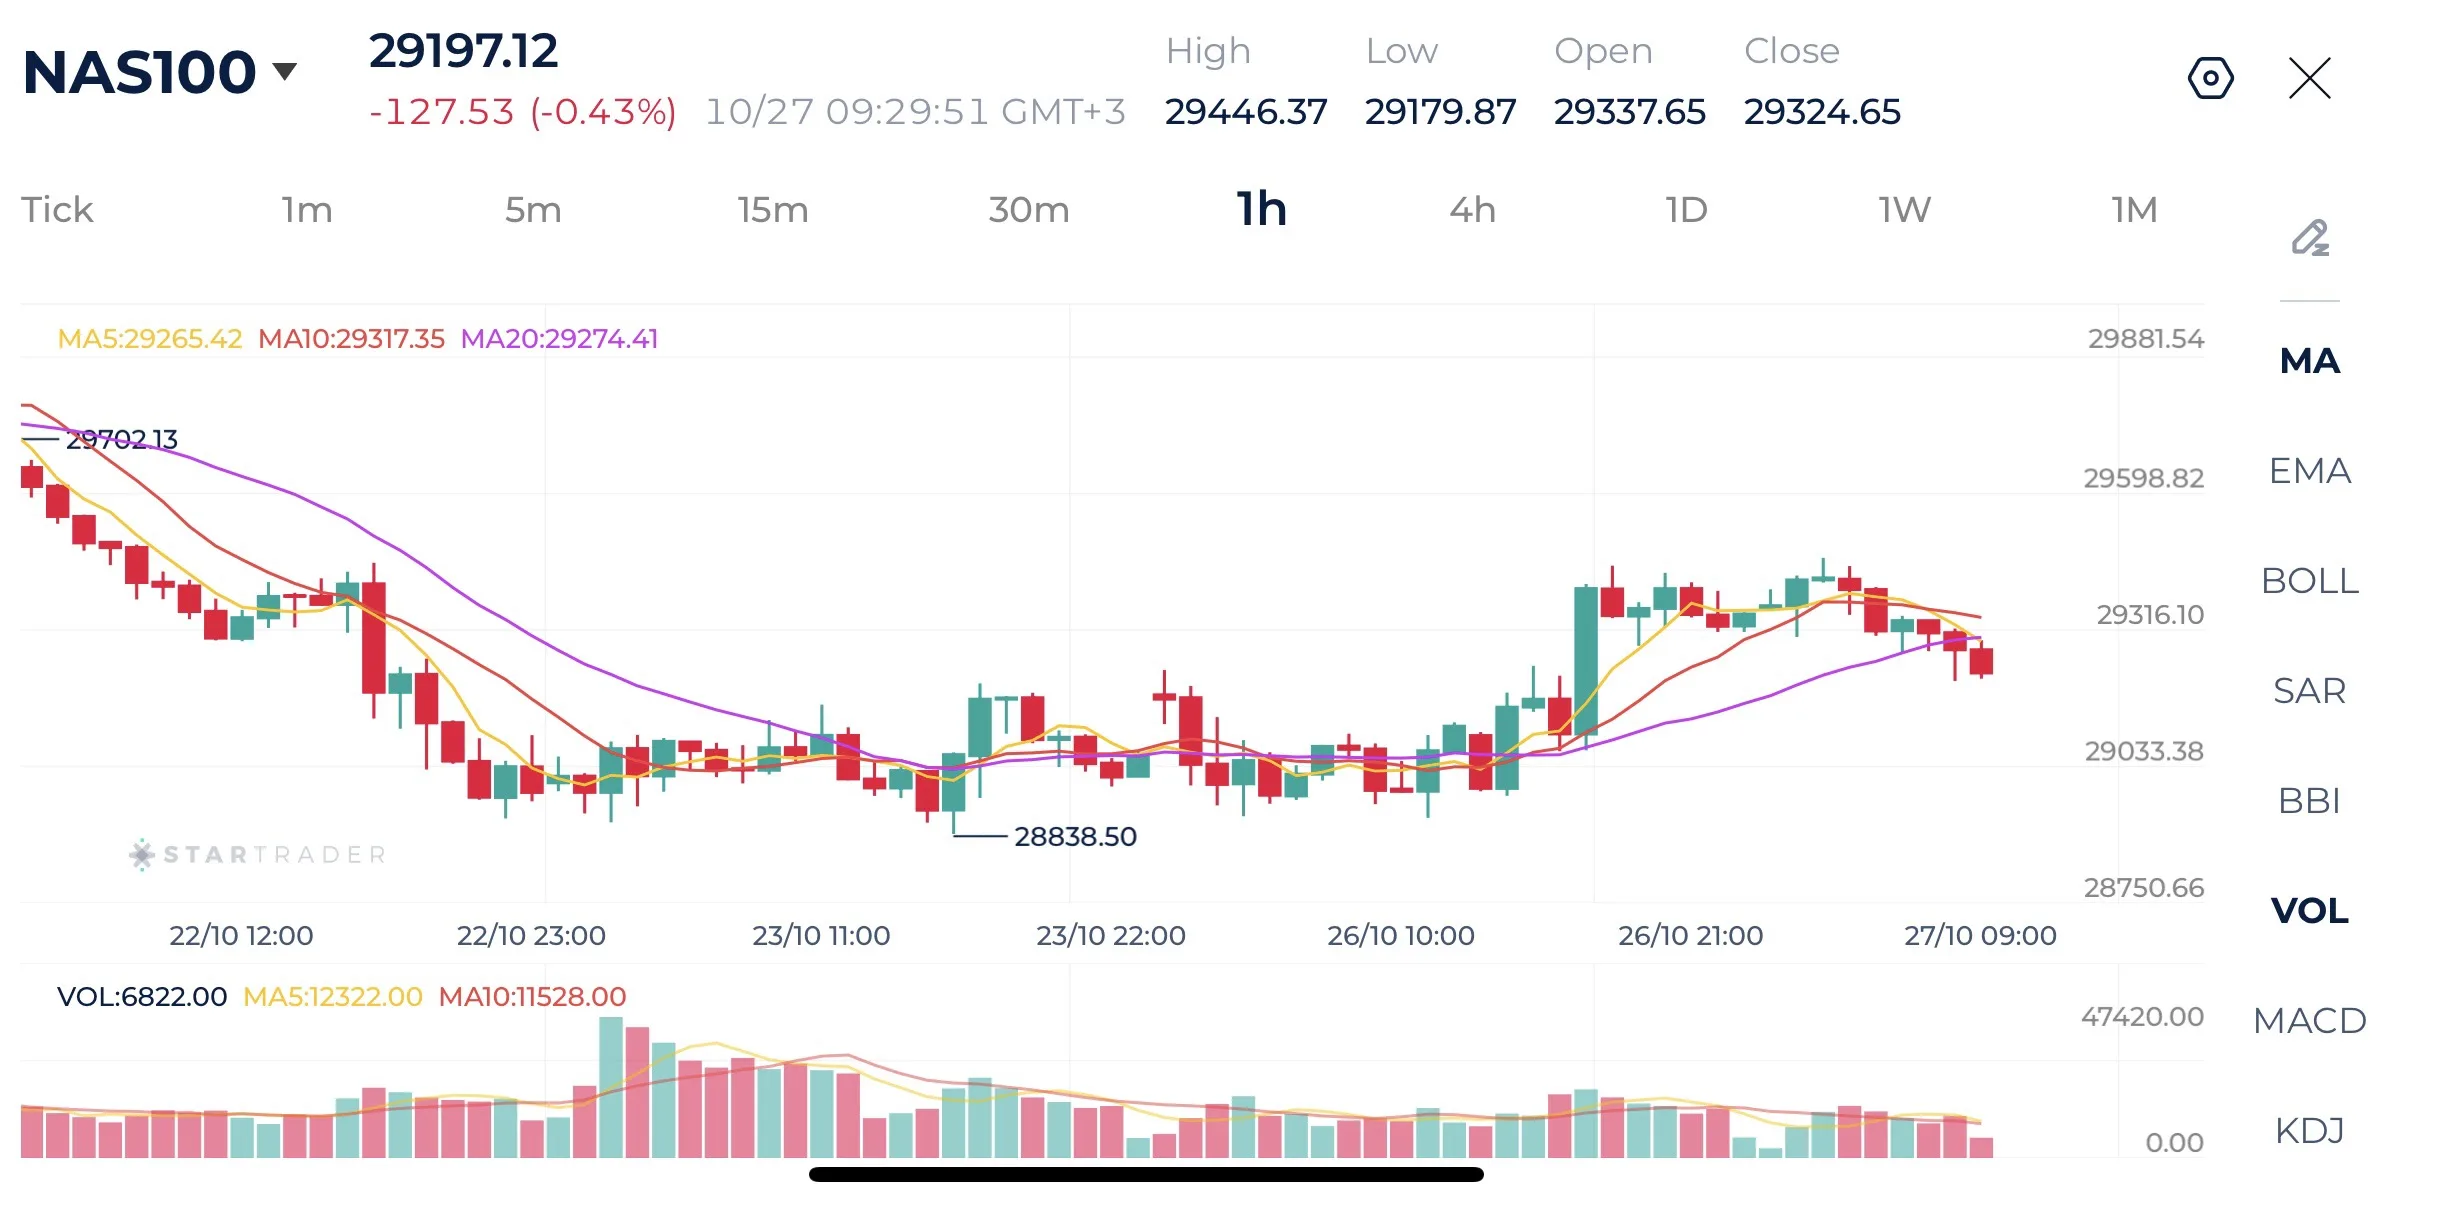
Source: STARTRADER app | Nasdaq trades higher after Anthropic announced filing for IPO
| Resistance | 29,317 | 29,425 | 29,600 |
|---|---|---|---|
| Support | 28,838 | 28,750 | 28,510 |
Brent Technical Analysis
Brent crude is attempting to stabilize after correcting sharply from its recent high of $118.23. The recent decline brought prices toward the $114.00 region, where the market began consolidating. The latest candles indicate a modest rebound from the recent lows, with price moving back toward $115.30 However, the recovery remains relatively weak, and Brent has yet to establish a clear sequence of higher highs that would confirm a renewed bullish trend.
The moving averages suggest that the market is approaching a potential turning point. A sustained move above $115.43 would strengthen the recovery signal, while repeated rejection around this level would suggest that sellers remain active.
Immediate support lies around $114.50, followed by the broader $113.80–$114.00 area. A break below $113.80 would weaken the stabilization pattern and could expose lower levels. On the upside, initial resistance is located around $115.40–$115.50, followed by $116.40 and $117.0. The recent high at $118.230 remains the key resistance for a broader bullish continuation.
Brent 1H Chart
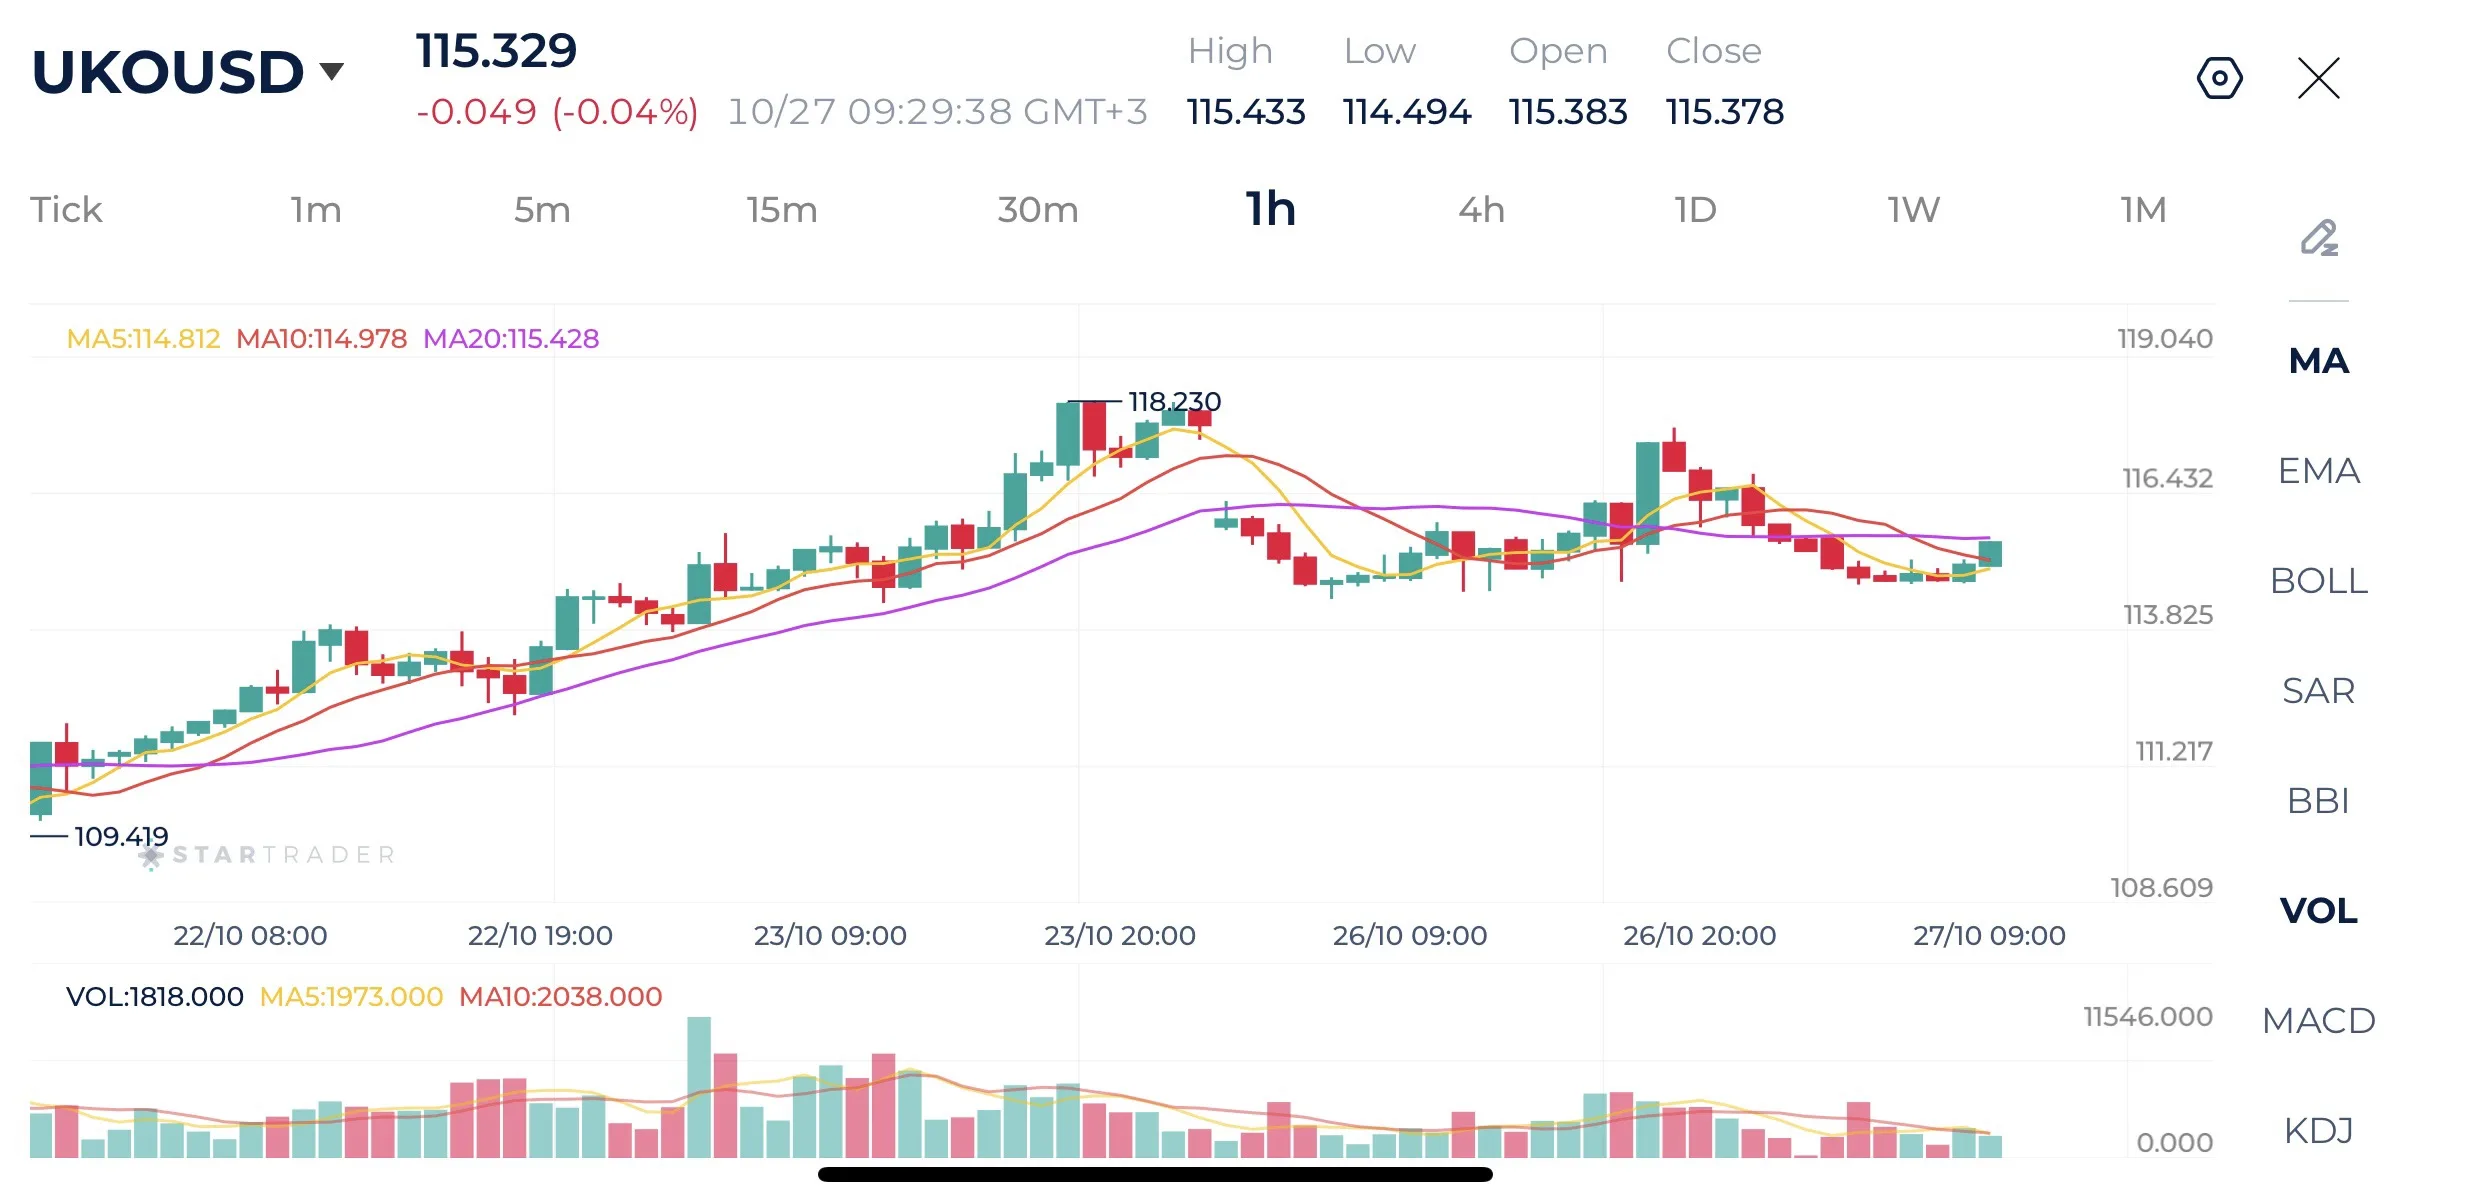
Source: STARTRADER app | Oil prices cool on hopes of progress in negotiations between the US and Iran
| Resistance | $115.50 | $117.00 | $118.43 |
|---|---|---|---|
| Support | $113.80 | $112.42 | $111.23 |
Gold Technical Analysis
Gold remains under significant selling pressure after declining from its recent high of approximately $4,126. The 1-hour chart shows a clear sequence of lower highs and lower lows, with the precious metal falling toward the $3,975 support level before entering a sideways consolidation phase around the psychological $4,000 mark.
The moving averages indicate a largely neutral short-term configuration within a broader bearish structure.
A sustained recovery above $4,013 would be the first indication of improving momentum, although stronger confirmation would require a move above the next resistance levels.
Immediate support lies around $4,000, followed by the recent low at $3,975 and the broader support zone near $3,960. A break below $3,975 would reinforce the bearish structure and could open the way for another leg lower. On the upside, resistance lies around $4,010–$4,013, followed by $4,025 and $4,050. A sustained move above $4,025 would improve the short-term outlook, while a recovery above $4,050 would offer stronger evidence of a reversal attempt. For now, gold maintains a bearish bias, with the $4,000 level acting as a key psychological pivot.
Gold 1H Chart
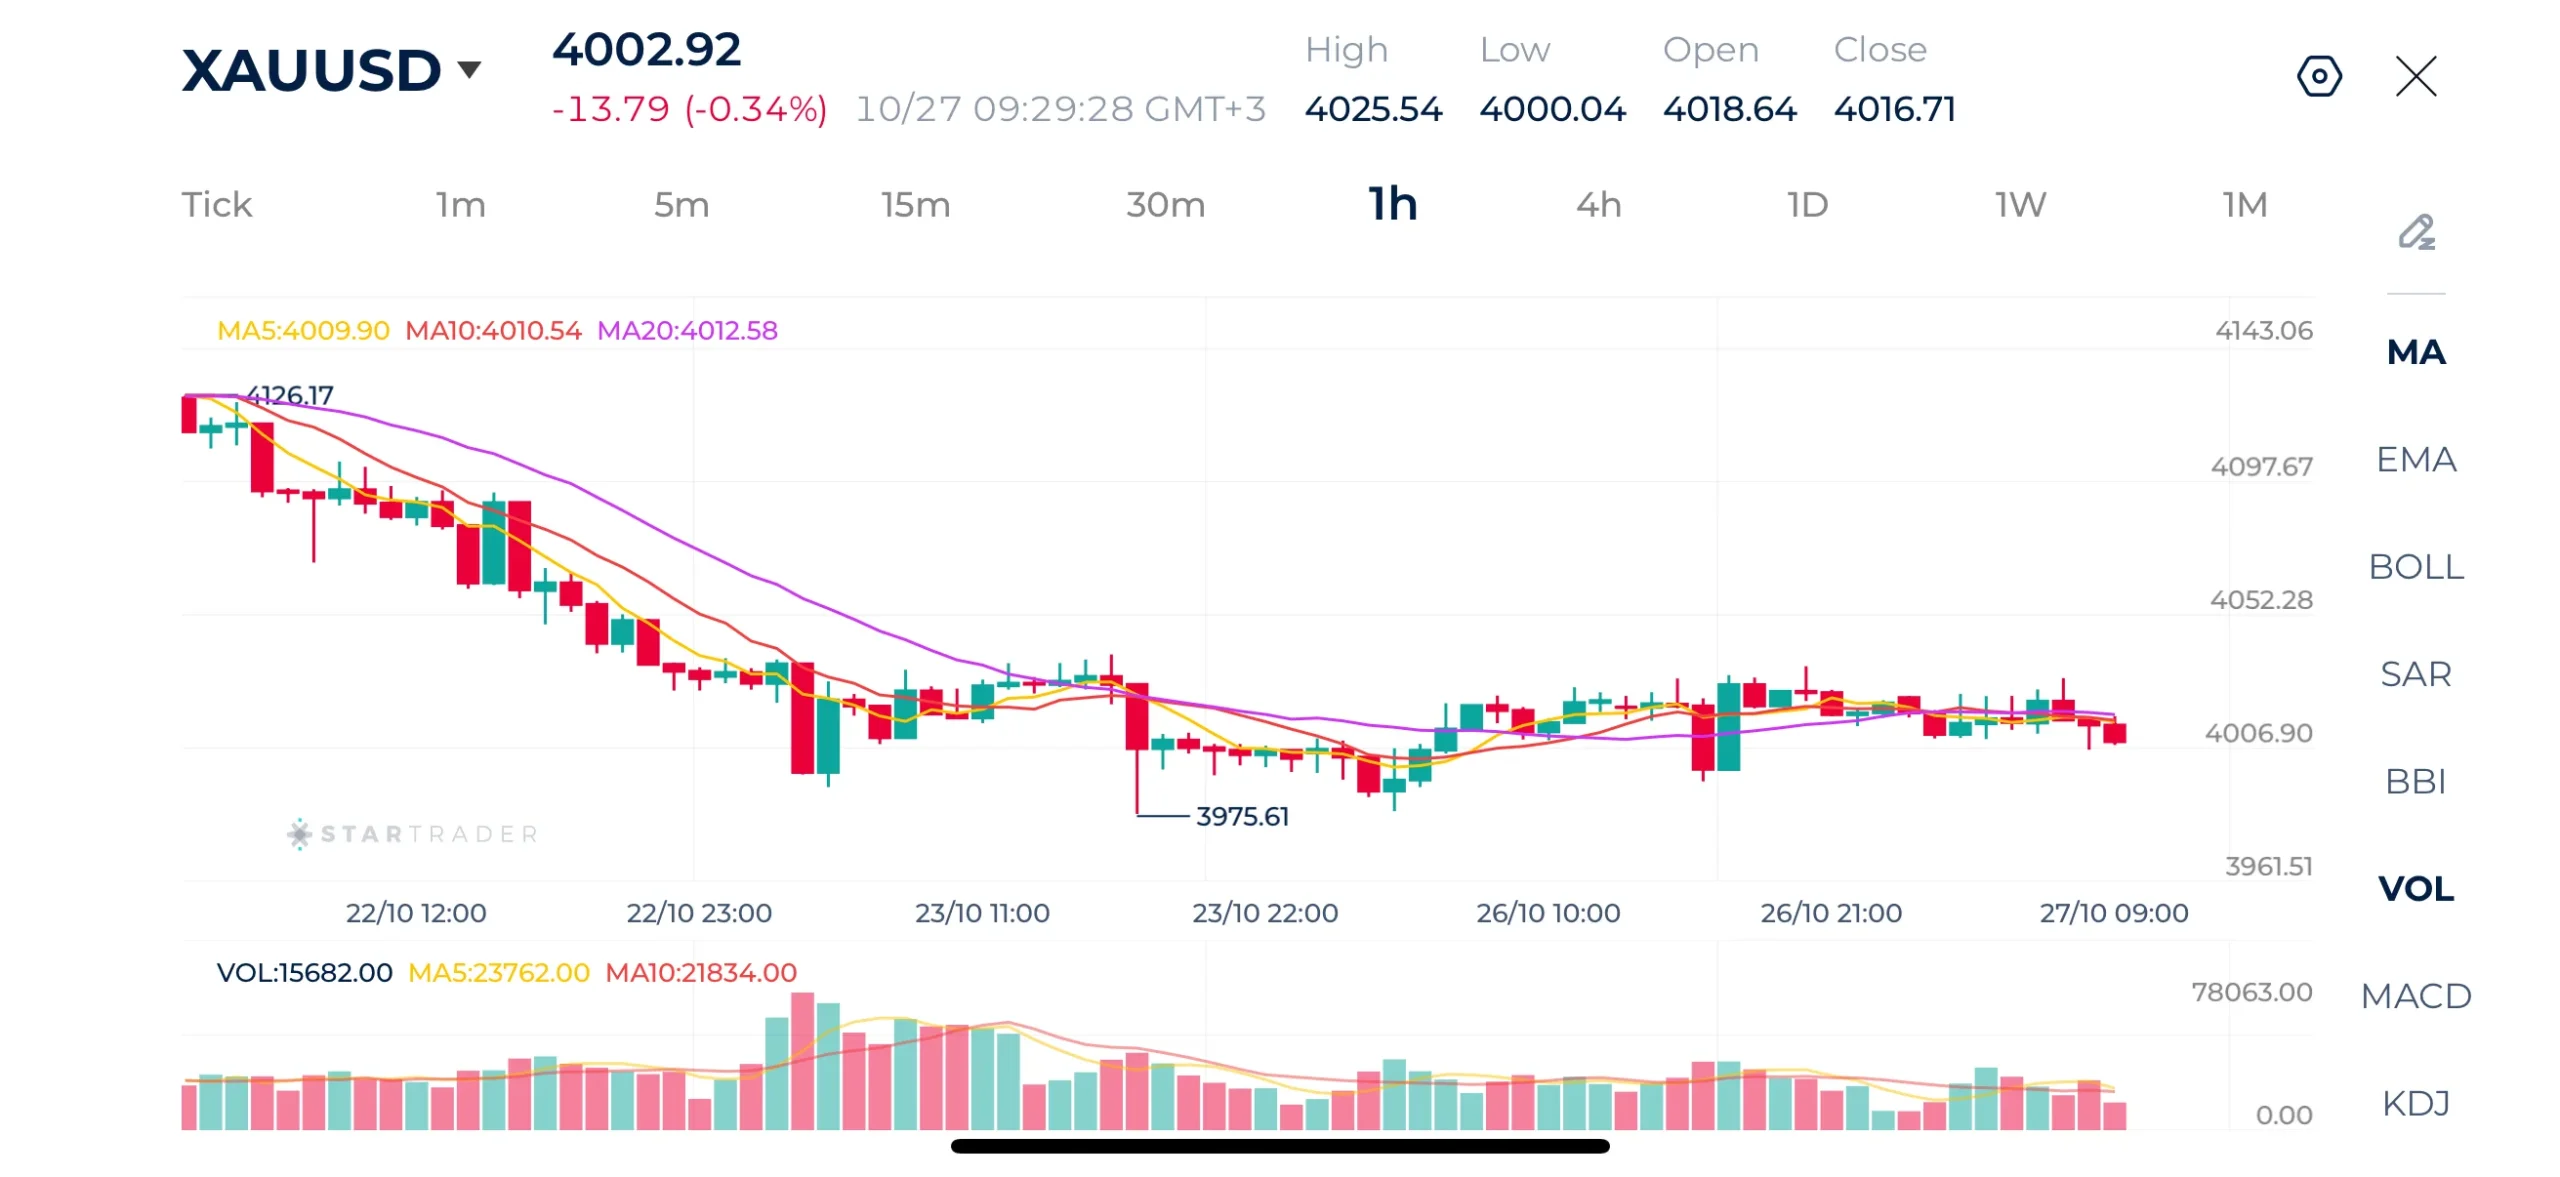
Source: STARTRADER app | Gold holda above $4,000 psychological support level
| Resistance | $4,025 | $4,059 | $4,097 |
|---|---|---|---|
| Support | $3,975 | $3,950 | $3,922 |
Risk Disclaimer: This material is provided for informational purposes only and does not constitute a recommendation or investment advice. Trading financial instruments on margin involves substantial risk and may not be appropriate for all investors.
Tags


Open Live Account
 Email Address
 Phone Number
Important Notice
STARTRADER does not accept any applications from Australian residents.
To comply with regulatory requirements, clicking the button will redirect you to the STARTRADER website operated by STARTRADER PRIME GLOBAL PTY LTD (ABN 65 156 005 668), an authorized Australian Financial Services Licence holder (AFSL no. 421210) regulated by the Australian Securities and Investments Commission.
Important Notice for Residents of the United Arab Emirates
In alignment with local regulatory requirements, individuals residing in the United Arab Emirates are requested to proceed via our dedicated regional platform at startrader.ae, which is operated by STARTRADER Global Financial Consultation & Financial Analysis L.L.C.. This entity is licensed by the UAE Capital Market Authority (CMA) under License No. 20200000241, and is authorised to introduce financial services and promote financial products in the UAE.
Please click the "Continue" button below to be redirected.


