


Brent Technical Analysis
Brent crude continues to exhibit a clear bearish trend characterized by lower highs, lower lows, and persistent selling pressure.
The moving average structure confirms the bearish trend. The 5-period moving average is positioned below the 10-period moving average, and both remain below the declining 20-period moving average. This bearish alignment reflects sustained downside momentum and demonstrates that sellers continue to dominate both the short-term and intermediate-term trend.
The $82.85 region is now acting as immediate support. A decisive break below this level would likely trigger another wave of selling pressure toward the psychological $82.00 level and potentially lower. Resistance is now found around $84.00–$84.50, followed by the declining 20-period moving average near $86.00. Brent would need to reclaim and hold above these levels before any sustainable recovery could be considered.
Brent 1H Chart
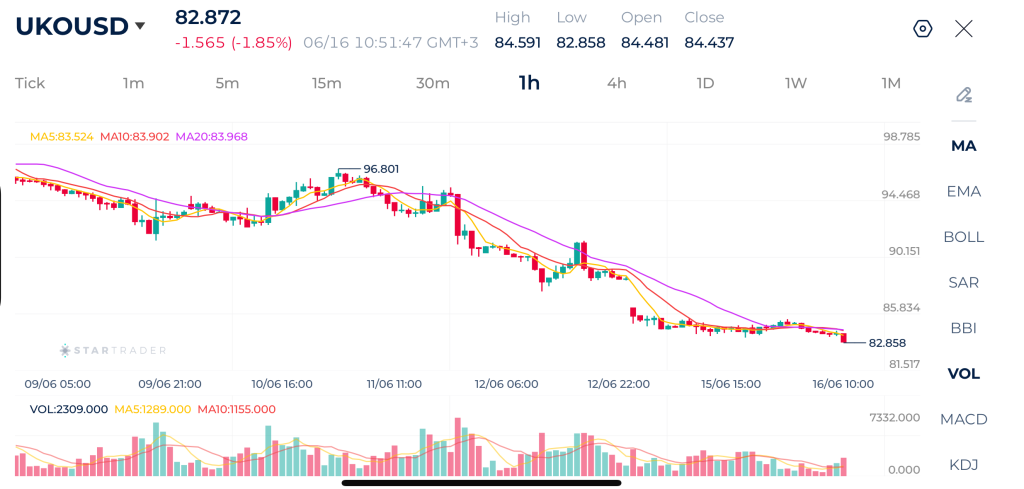
| Resistance | $84.50 | $85.90 | $87.22 |
| Support | $82.00 | $80.64 | $79.00 |
Gold Technical Analysis
Gold continues to demonstrate constructive bullish behavior after its sharp recovery from the $4,023 low. Following the strong reversal.
The moving averages remain positively aligned. The 5-period and 10-period moving averages are positioned above the 20-period moving average, while the 20-period MA continues to slope upward. This alignment confirms that the broader short-term trend remains bullish.
Price is holding above the $4,300 area and above the rising 20-period moving average, suggesting that buyers are defending gains. The relatively tight range following the rally is often indicative of accumulation before another directional move.
Resistance remains located at $4,369, which is the most recent swing high. A breakout above this level would signal renewed bullish momentum and could open the door toward $4,400 and potentially higher targets. On the downside, initial support is found around $4,300–$4,310, followed by stronger support near the 20-period moving average around $4,280–$4,290. As long as gold continues to hold above these support zones, the broader bullish recovery remains intact.
Gold 1H Chart
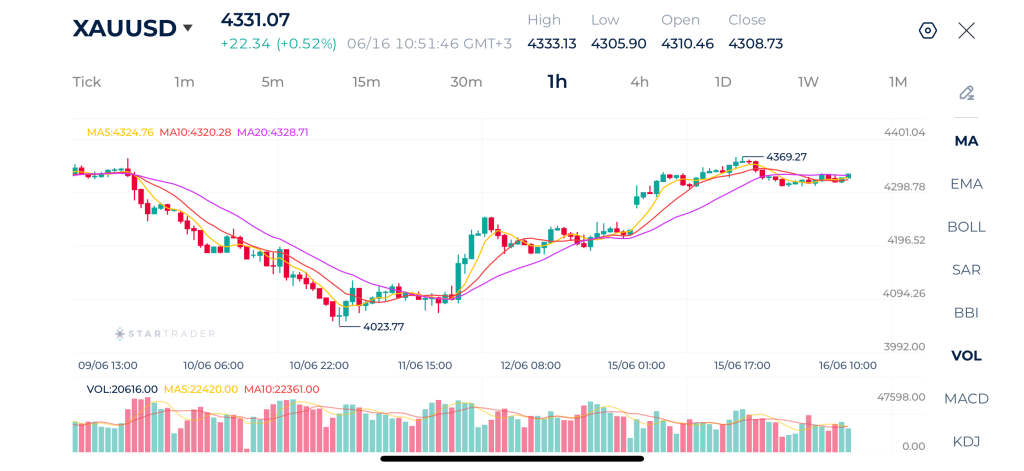
| Resistance | $4,375 | $4,420 | $4,500 |
| Support | $4,235 | $4,178 | $4,095 |
Dow Jones Technical Analysis
The Dow Jones remains in a well-established bullish structure with higher highs and higher lows, confirming that buyers remain firmly in control.
The moving averages continue to support the bullish narrative. The 5-period MA remains above the 10-period MA, while both averages are positioned above the 20-period MA. More importantly, the 20-period MA is still trending upward, indicating that the broader short-term trend remains positive despite the recent sideways movement.
Immediate support is located around 51,800–51,850. Below that, stronger support is found near 51,600 and then around the rising 20-period moving average. As long as price remains above these levels, the bullish trend remains intact. A decisive break above 52,050 would confirm the continuation of the uptrend and could expose the 52,250–52,500 region as the next upside objective. Only a sustained break below 51,600 would begin to weaken the current bullish outlook.
Dow Jones 1H Chart
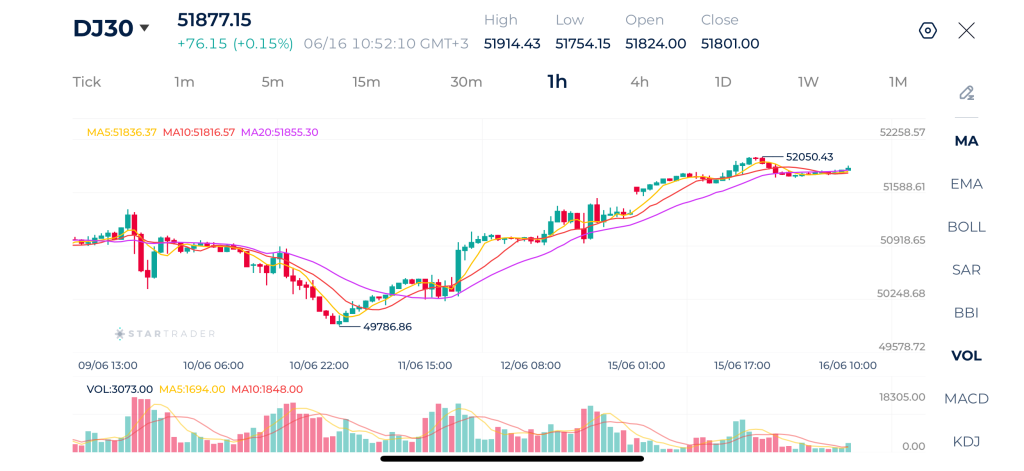
| Resistance | 52,050 | 52,140 | 52,200 |
| Support | 51,480 | 50,923 | 50,726 |
Risk Disclaimer: This material is provided for informational purposes only and does not constitute a recommendation or investment advice. Trading financial instruments on margin involves substantial risk and may not be appropriate for all investors.
Tags
Open Live Account
Please enter a valid country
No results found
No results found
Please enter a valid email
Please enter a valid verification code
1. 8-16 characters + numbers (0-9) 2. blend of letters (A-Z, a-z) 3. special characters (e.g, !a#S%^&)
Please enter the correct format
Please tick the checkbox to proceed
Please tick the checkbox to proceed
Important Notice
STARTRADER does not accept any applications from Australian residents.
To comply with regulatory requirements, clicking the button will redirect you to the STARTRADER website operated by STARTRADER PRIME GLOBAL PTY LTD (ABN 65 156 005 668), an authorized Australian Financial Services Licence holder (AFSL no. 421210) regulated by the Australian Securities and Investments Commission.
CONTINUEImportant Notice for Residents of the United Arab Emirates
In alignment with local regulatory requirements, individuals residing in the United Arab Emirates are requested to proceed via our dedicated regional platform at startrader.ae, which is operated by STARTRADER Global Financial Consultation & Financial Analysis L.L.C.. This entity is licensed by the UAE Capital Market Authority (CMA) under License No. 20200000241, and is authorised to introduce financial services and promote financial products in the UAE.
Please click the "Continue" button below to be redirected.
CONTINUEError! Please try again.

