








 Web Trader MT5













Gold Technical Analysis
Gold remains under clear bearish pressure on the hourly timeframe. The chart shows a sustained sequence of lower highs and lower lows, confirming that sellers continue to dominate short-term momentum. The sharp decline accelerated after price broke beneath the previous consolidation area around $4,600, leading to a fast bearish expansion toward the $4,480 low.
Technically, gold is trading below all key moving averages, with the MA5, MA10, and MA20 aligned bearishly.
The $4,529-$4,545 region is now acting as the main resistance zone. Buyers would need to break and sustain price above that area to improve short-term sentiment and potentially trigger a broader recovery toward $4,590. Without that breakout, rallies are likely to continue attracting selling pressure.
On the downside, immediate support stands near $4,480, which represents the recent swing low. A decisive break beneath that level could accelerate bearish momentum further and expose the market to deeper declines toward $4,450 and potentially lower.
Gold 1H Chart
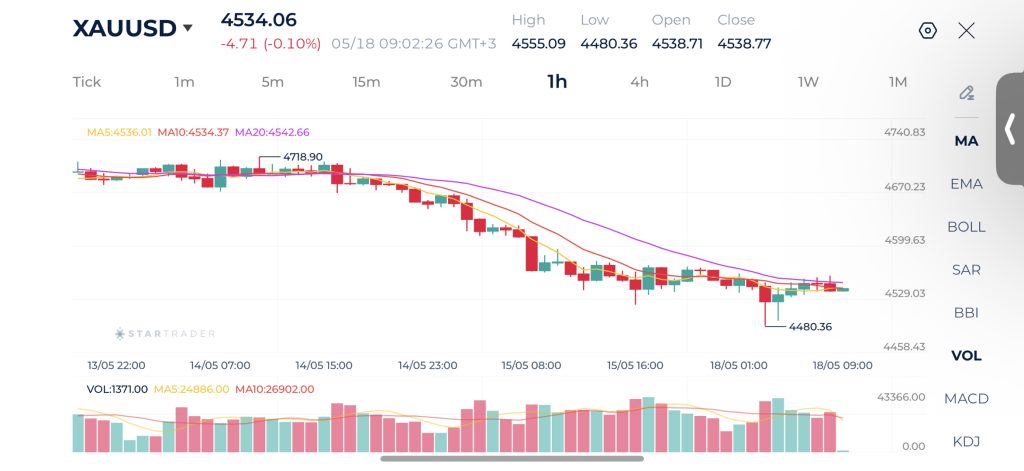
| Resistance | $4,600 | $4,670 | $4,735 |
| Support | $4,480 | $4,425 | $4,365 |
Brent Technical Analysis
Brent crude oil continues to maintain a strong bullish recovery structure on the hourly timeframe after rebounding sharply from the $106 low. The chart shows a clear sequence of higher highs and higher lows, confirming that buyers remain in control of short-term momentum.
The market is still holding above the key dynamic support zone around $112.20-$111.90. As long as oil remains above that region, the bullish trend remains technically intact.
If buyers manage to reclaim and close above the $113.70 resistance, Brent could extend toward the $114.50-$115.00 area. On the downside, a break below $111.90 would weaken short term bullish momentum and could trigger a correction toward $110.50 or even the rising MA20 near $109.90.
Unless price starts forming lower lows beneath the recent support zones, the current consolidation still favors eventual continuation to the upside.
Brent 1H Chart
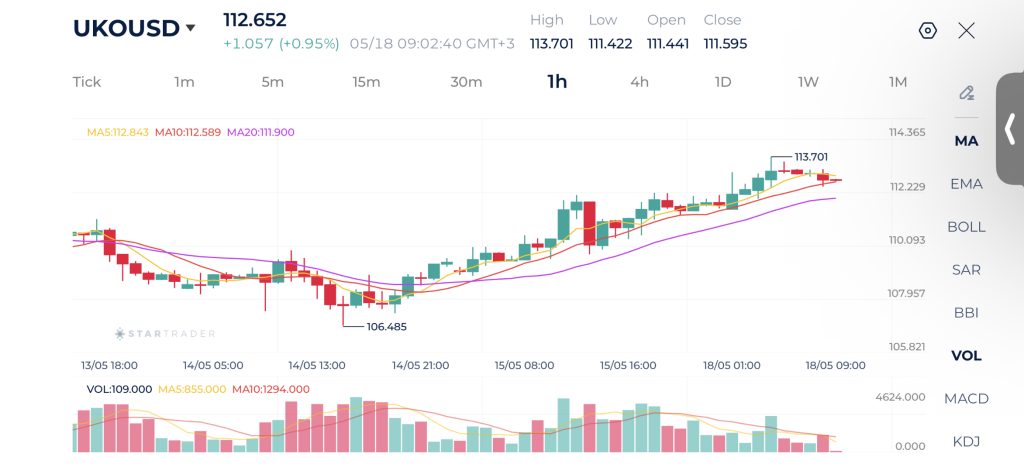
| Resistance | $113.70 | $116.25 | $118.30 |
| Support | $111.90 | $110.50 | $109.10 |
EURUSD Technical Analysis
EURUSD remains in a strong downward trend. price made a series of lower highs and lower lows as it slid down. Volume spikes last week support the presence of strong institutional selling pressure.
In the past few hours, the strong downward momentum has stalled, and the market is currently directionless in the short term.
If the price can break and hold above the moving average MA20 with an increase in green buying volume, it could trigger a short-term relief rally.
Because the primary trend on this chart is heavily bearish, the overall bias remains down. If the price breaks cleanly below the 1.16084 support level, it signals a continuation of the downtrend, likely exposing the next psychological round number at 1.1600 or lower
EURUSD 1H Chart
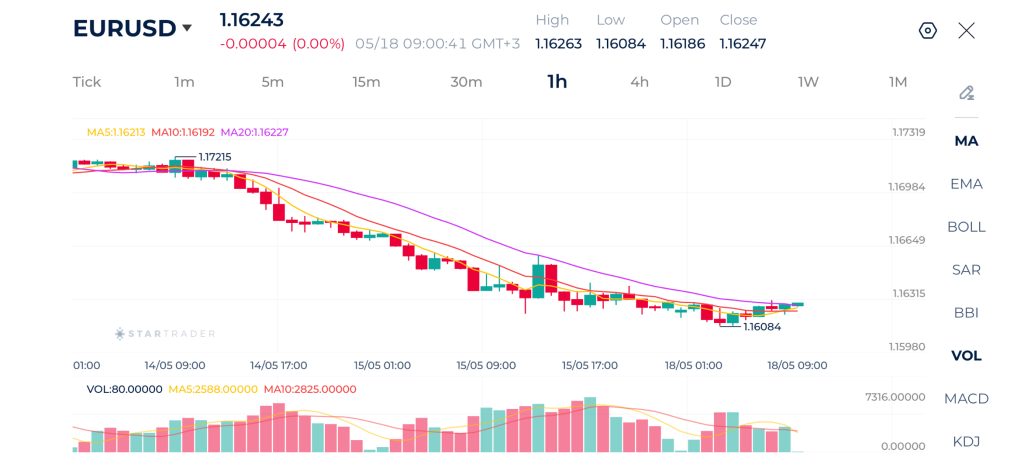
| Resistance | 1.1650 | 1.1690 | 1.1722 |
| Support | 1.1600 | 1.1572 | 1.1528 |
Risk Disclaimer: This material is provided for informational purposes only and does not constitute a recommendation or investment advice. Trading financial instruments on margin involves substantial risk and may not be appropriate for all investors.
Tags


Open Live Account
 Email Address
 Phone Number
Important Notice
STARTRADER does not accept any applications from Australian residents.
To comply with regulatory requirements, clicking the button will redirect you to the STARTRADER website operated by STARTRADER PRIME GLOBAL PTY LTD (ABN 65 156 005 668), an authorized Australian Financial Services Licence holder (AFSL no. 421210) regulated by the Australian Securities and Investments Commission.
Important Notice for Residents of the United Arab Emirates
In alignment with local regulatory requirements, individuals residing in the United Arab Emirates are requested to proceed via our dedicated regional platform at startrader.ae, which is operated by STARTRADER Global Financial Consultation & Financial Analysis L.L.C.. This entity is licensed by the UAE Capital Market Authority (CMA) under License No. 20200000241, and is authorised to introduce financial services and promote financial products in the UAE.
Please click the "Continue" button below to be redirected.


