


Gold Technical Analysis
Gold is showing clear short-term weakness on the 1-hour timeframe after failing to sustain gains above the $4,660 resistance area. The rejection from that level led to a shift in structure, with price now forming lower highs and lower lows. This is reinforced by the moving averages, where price has dropped below the MA10 and MA20, both starting to slope downward, signaling increasing bearish momentum.
The recent sell-off suggests that buyers have lost control in the short term, and the market is transitioning into a corrective or even impulsive bearish phase. As long as price remains below the $4,600–$4,615 resistance zone, downside pressure is likely to persist, with potential targets around $4,560 and $4,545. Only a strong reclaim above $4,620 would weaken the bearish outlook and suggest a possible recovery.
Gold 1H Chart
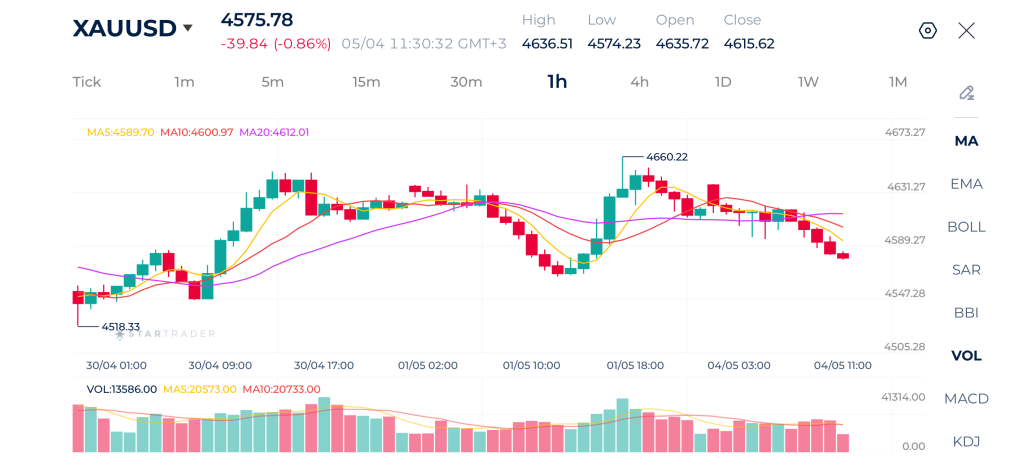
| Resistance | $4,625 | $4,660 | $4,700 |
| Support | $4,540 | $4,515 | $4,500 |
S&P 500 Technical Analysis
The S&P 500 remains in a broader bullish trend, but the 1-hour chart shows clear signs of consolidation after the recent upward move. Price has been moving sideways near the highs around 7,278, forming a tight range with decreasing momentum.
The moving averages are flattening, and price is hovering around them, which reflects indecision between buyers and sellers in the short term. Despite this consolidation, the overall structure remains bullish, as the market is still holding above key support levels. As long as price remains above the 7,190–7,210 zone. A breakout above 7,278 would likely trigger another bullish leg, while a break below 7,190 could lead to a deeper correction.
S&P 500 1H Chart
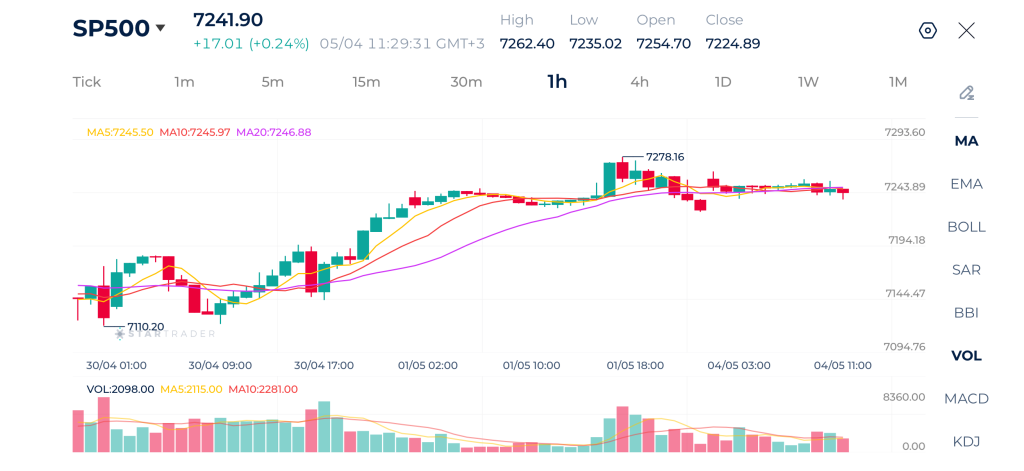
| Resistance | 7,278 | 7,300 | 7,350 |
| Support | 7,195 | 7,156 | 7,110 |
Brent Technical Analysis
Oil is currently attempting to recover after a notable correction from the $120.30 highs. The sharp drop toward the $110.40 level marked a short-term bearish phase, but recent price action shows a rebound with higher lows forming, indicating that buyers are stepping back in.
Price is now testing the moving averages, which are starting to flatten, suggesting a transition phase between bearish correction and potential bullish continuation. However, the structure is not fully bullish yet, as price still needs to break and hold above the $115.50–$116.50 resistance zone to confirm momentum recovery. If this breakout occurs, oil could resume its broader uptrend. On the downside, failure to hold above $113.00 could signal renewed weakness and continuation of the corrective move.
Brent 1H Chart
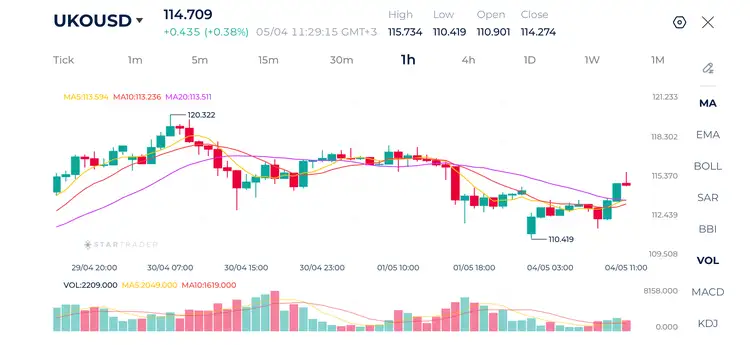
| Resistance | $116.50 | $118.30 | $120.32 |
| Support | $111.26 | $110.41 | $108.26 |
Risk Disclaimer: This material is provided for informational purposes only and does not constitute a recommendation or investment advice. Trading financial instruments on margin involves substantial risk and may not be appropriate for all investors.
Tags
Open Live Account
Please enter a valid country
No results found
No results found
Please enter a valid email
Please enter a valid verification code
1. 8-16 characters + numbers (0-9) 2. blend of letters (A-Z, a-z) 3. special characters (e.g, !a#S%^&)
Please enter the correct format
Please tick the checkbox to proceed
Please tick the checkbox to proceed
Important Notice
STARTRADER does not accept any applications from Australian residents.
To comply with regulatory requirements, clicking the button will redirect you to the STARTRADER website operated by STARTRADER PRIME GLOBAL PTY LTD (ABN 65 156 005 668), an authorized Australian Financial Services Licence holder (AFSL no. 421210) regulated by the Australian Securities and Investments Commission.
CONTINUEImportant Notice for Residents of the United Arab Emirates
In alignment with local regulatory requirements, individuals residing in the United Arab Emirates are requested to proceed via our dedicated regional platform at startrader.ae, which is operated by STARTRADER Global Financial Consultation & Financial Analysis L.L.C.. This entity is licensed by the UAE Capital Market Authority (CMA) under License No. 20200000241, and is authorised to introduce financial services and promote financial products in the UAE.
Please click the "Continue" button below to be redirected.
CONTINUEError! Please try again.

