


 Web Trader MT5













Gold Technical Analysis
Gold has shifted into a bearish short term structure. Following the failure to hold above the $4,100 area, price has continued to make lower highs and lower lows, falling to $3,968. The 5-hour moving average is below the 10-hour and 20-hour averages, and all three are sloping downward, reinforcing the bearish momentum.
The immediate support is $3,970–$3,950, with a break below this zone potentially extending the decline toward the next psychological support around $3,900. On the upside, $4,000–$4,005 is now the first resistance, followed by $4,055–$4,060. Unless gold can reclaim $4,005 and subsequently $4,060, rallies are likely to remain corrective. Short-term bias remains bearish.
Gold 1H Chart
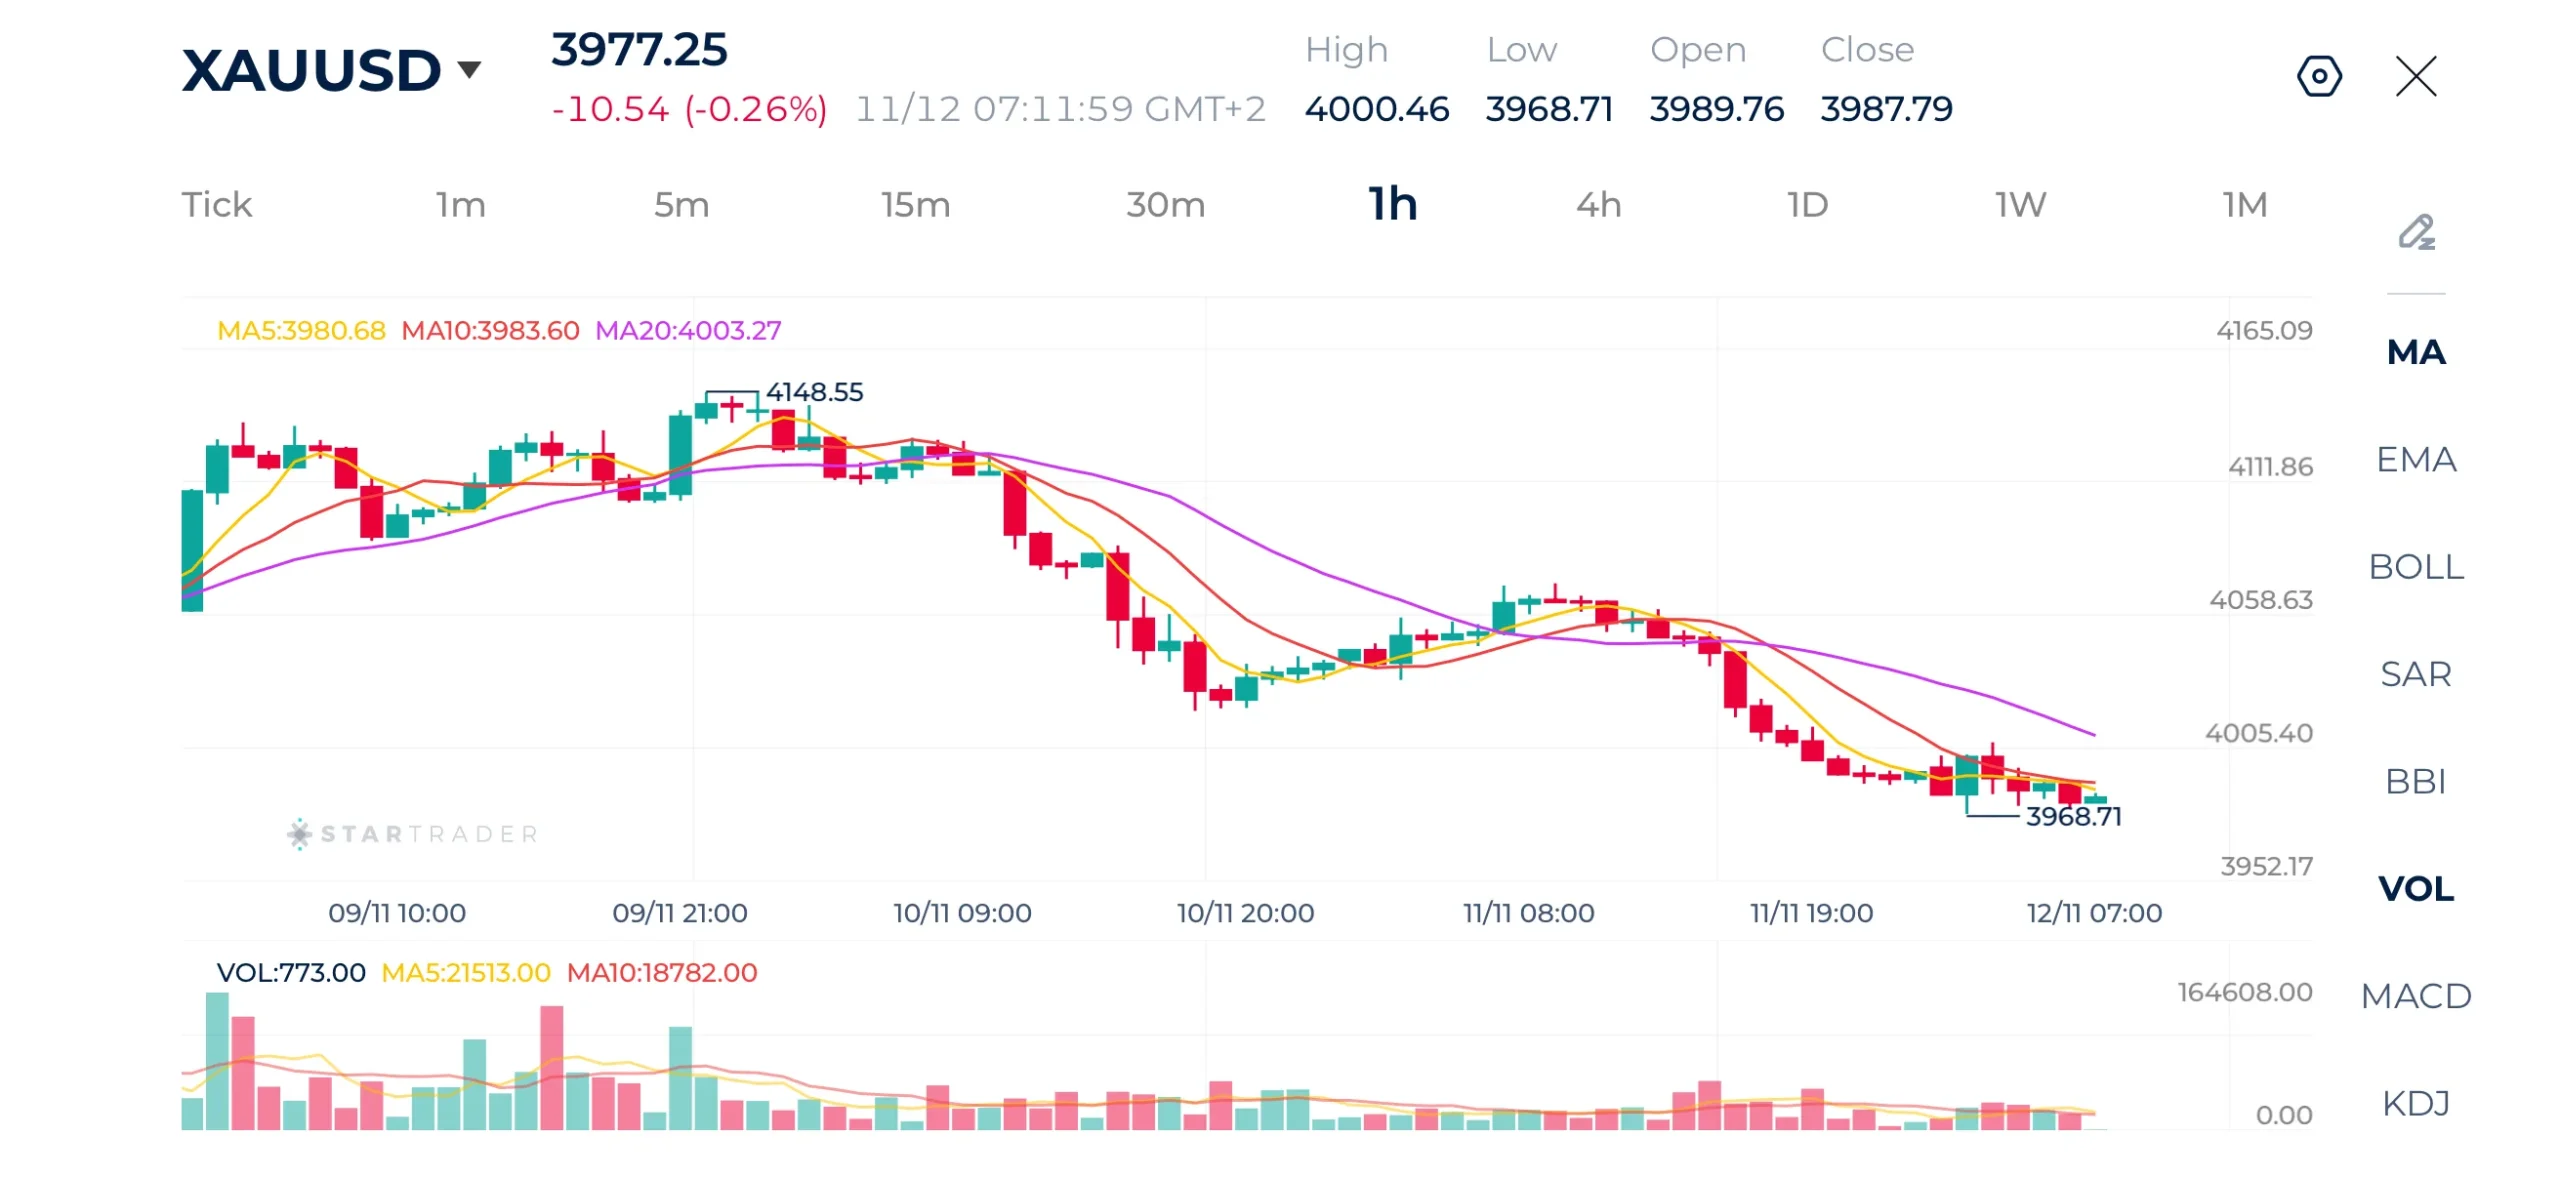
Source: STARTRADER app | Gold falls below $4,000 support level as yields rise
| Resistance | $4,000 | $4,055 | $4,088 |
|---|---|---|---|
| Support | $3,950 | $3,922 | $3,887 |
Brent Technical Analysis
Brent crude remains clearly bearish on the 1-hour chart. The 5-hour moving average is now below the 10-hour MA, while the 20-hour MA remains significantly higher, confirming that the broader trend is still downward. Price is currently testing the $93.80–$93.40 area, making this an important near-term support zone.
A break below $93.30–$93.40 would expose the previous low around $91.75, while any recovery would first face resistance around $94.50–$95.00. Crude brent therefore maintains a bearish bias, particularly while price remains below $95.
Brent 1H Chart
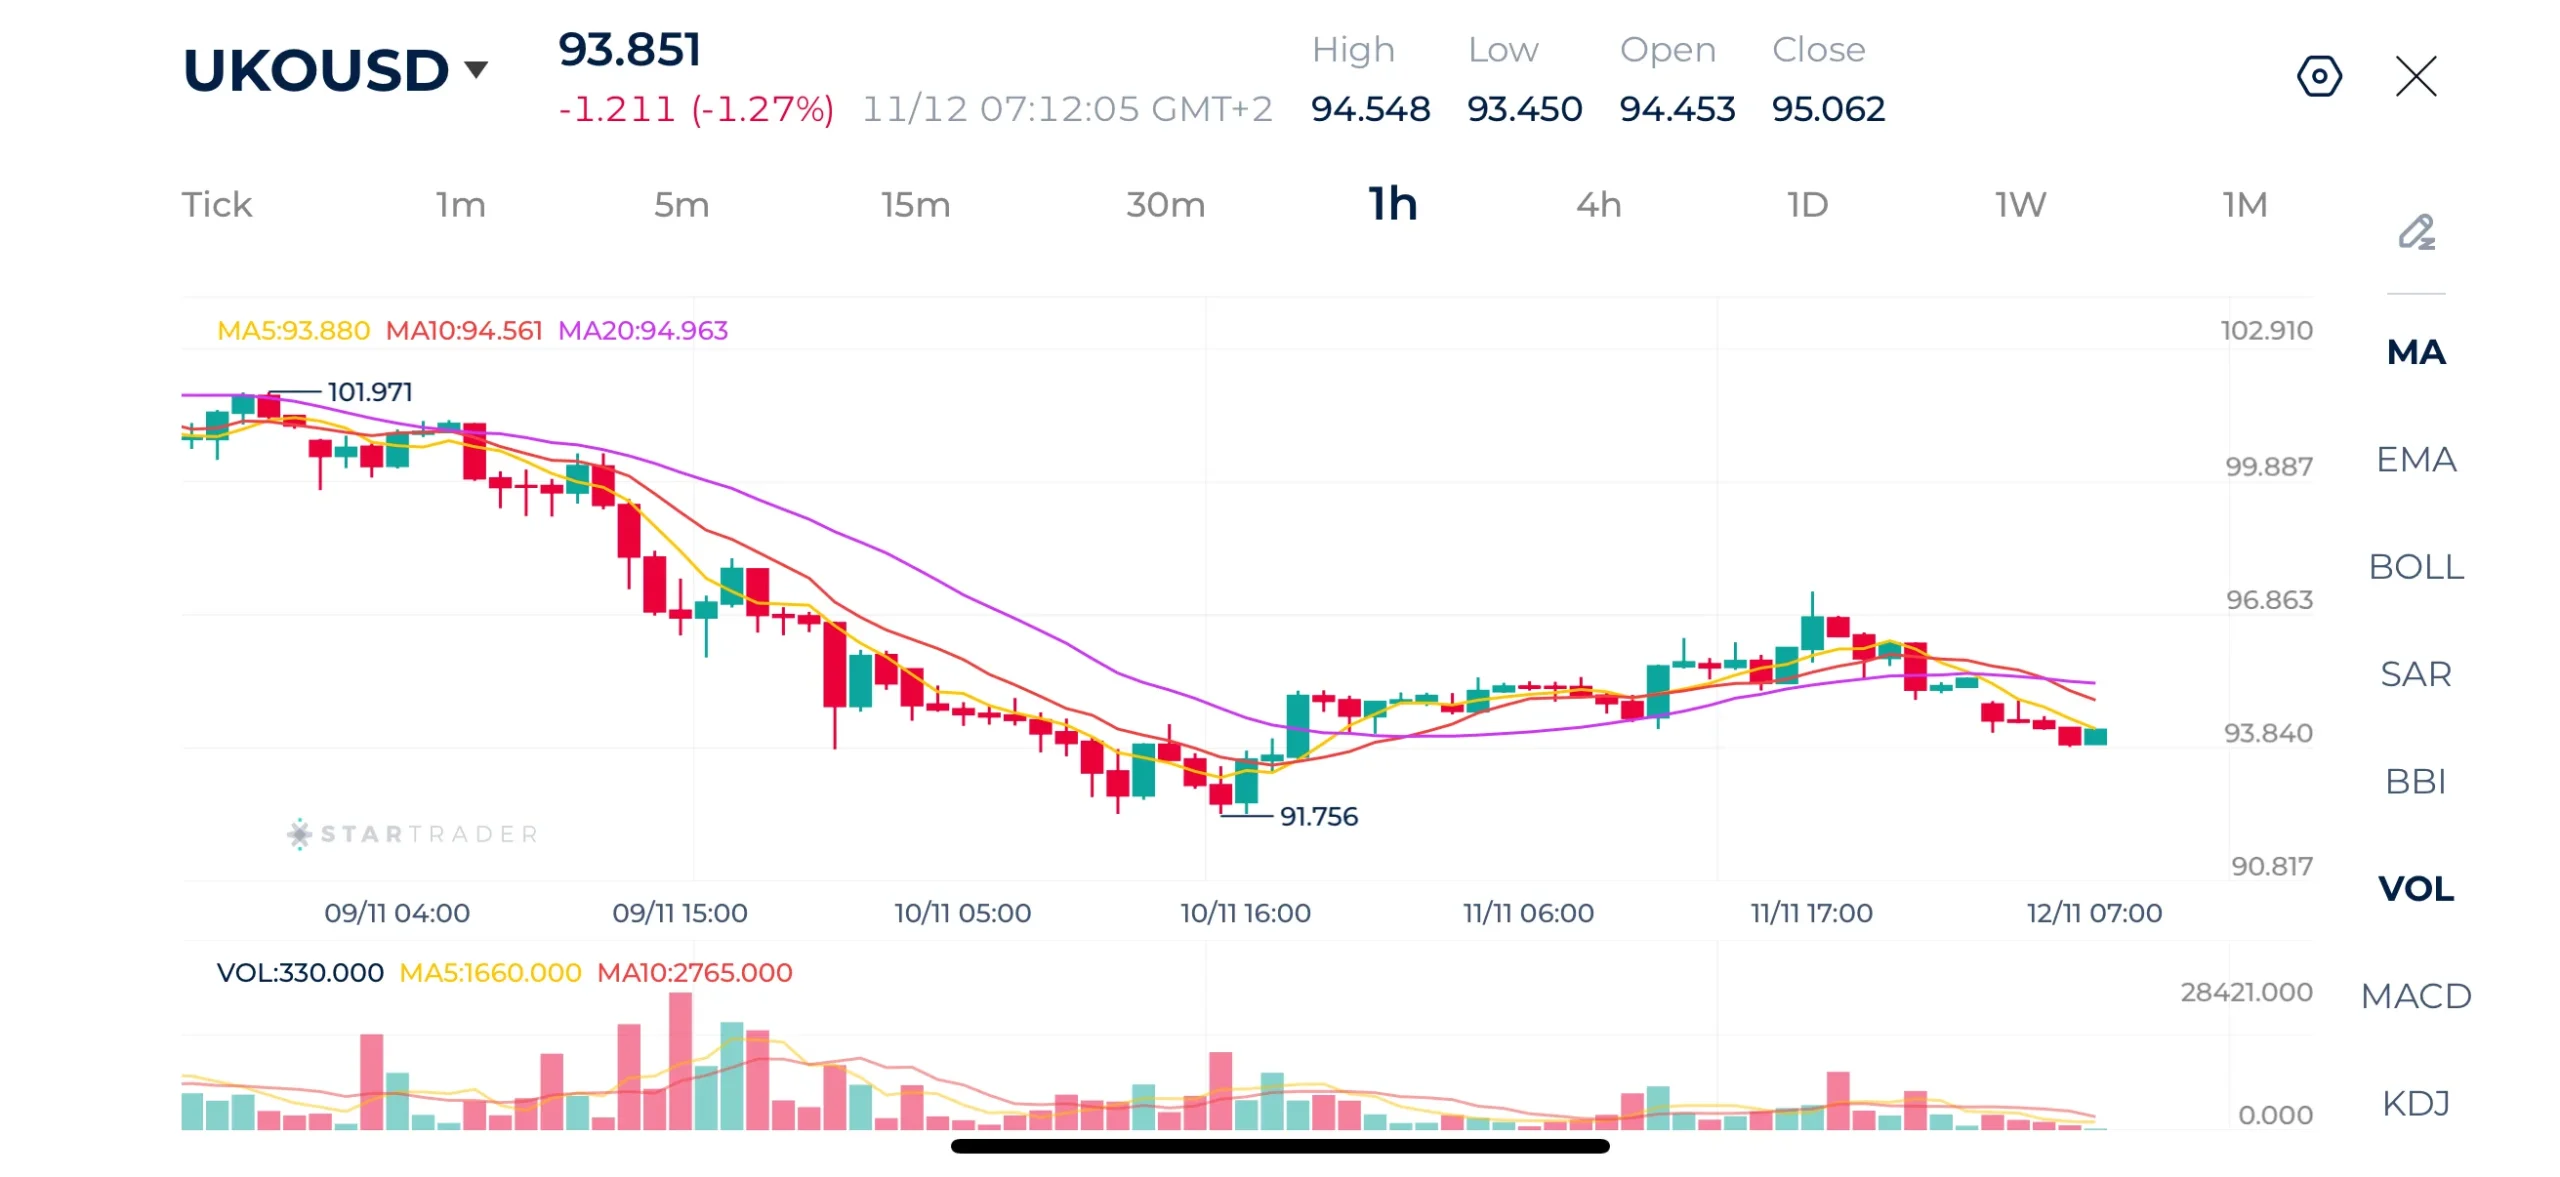
Source: STARTRADER app | Oil prices continue to decline on hopes of a diplomatic resolution
| Resistance | $94.50 | $95.22 | $96.85 |
|---|---|---|---|
| Support | $93.00 | $91.75 | $90.48 |
Nasdaq Technical Analysis
Nasdaq remains in a short-term bullish structure on the hourly chart, but momentum has weakened noticeably. Price has pulled back toward 28,120, slipping below the 5-hour and 10-hour moving averages, while the 20-hour MA remains below price. This suggests that the broader recovery is still intact, but the immediate momentum has shifted into consolidation.
The key support area is 28,000–27,950, followed by 27,760–27,650. On the upside, 28,220–28,250 is the first resistance, followed by the recent high at 28,615. A break back above 28,250 would restore bullish momentum, while a sustained break below 27,950 would increase the risk of a deeper retracement toward 27,650.
Short-term bias: neutral-to-bullish, with a corrective pullback underway.
Nasdaq 1H Chart
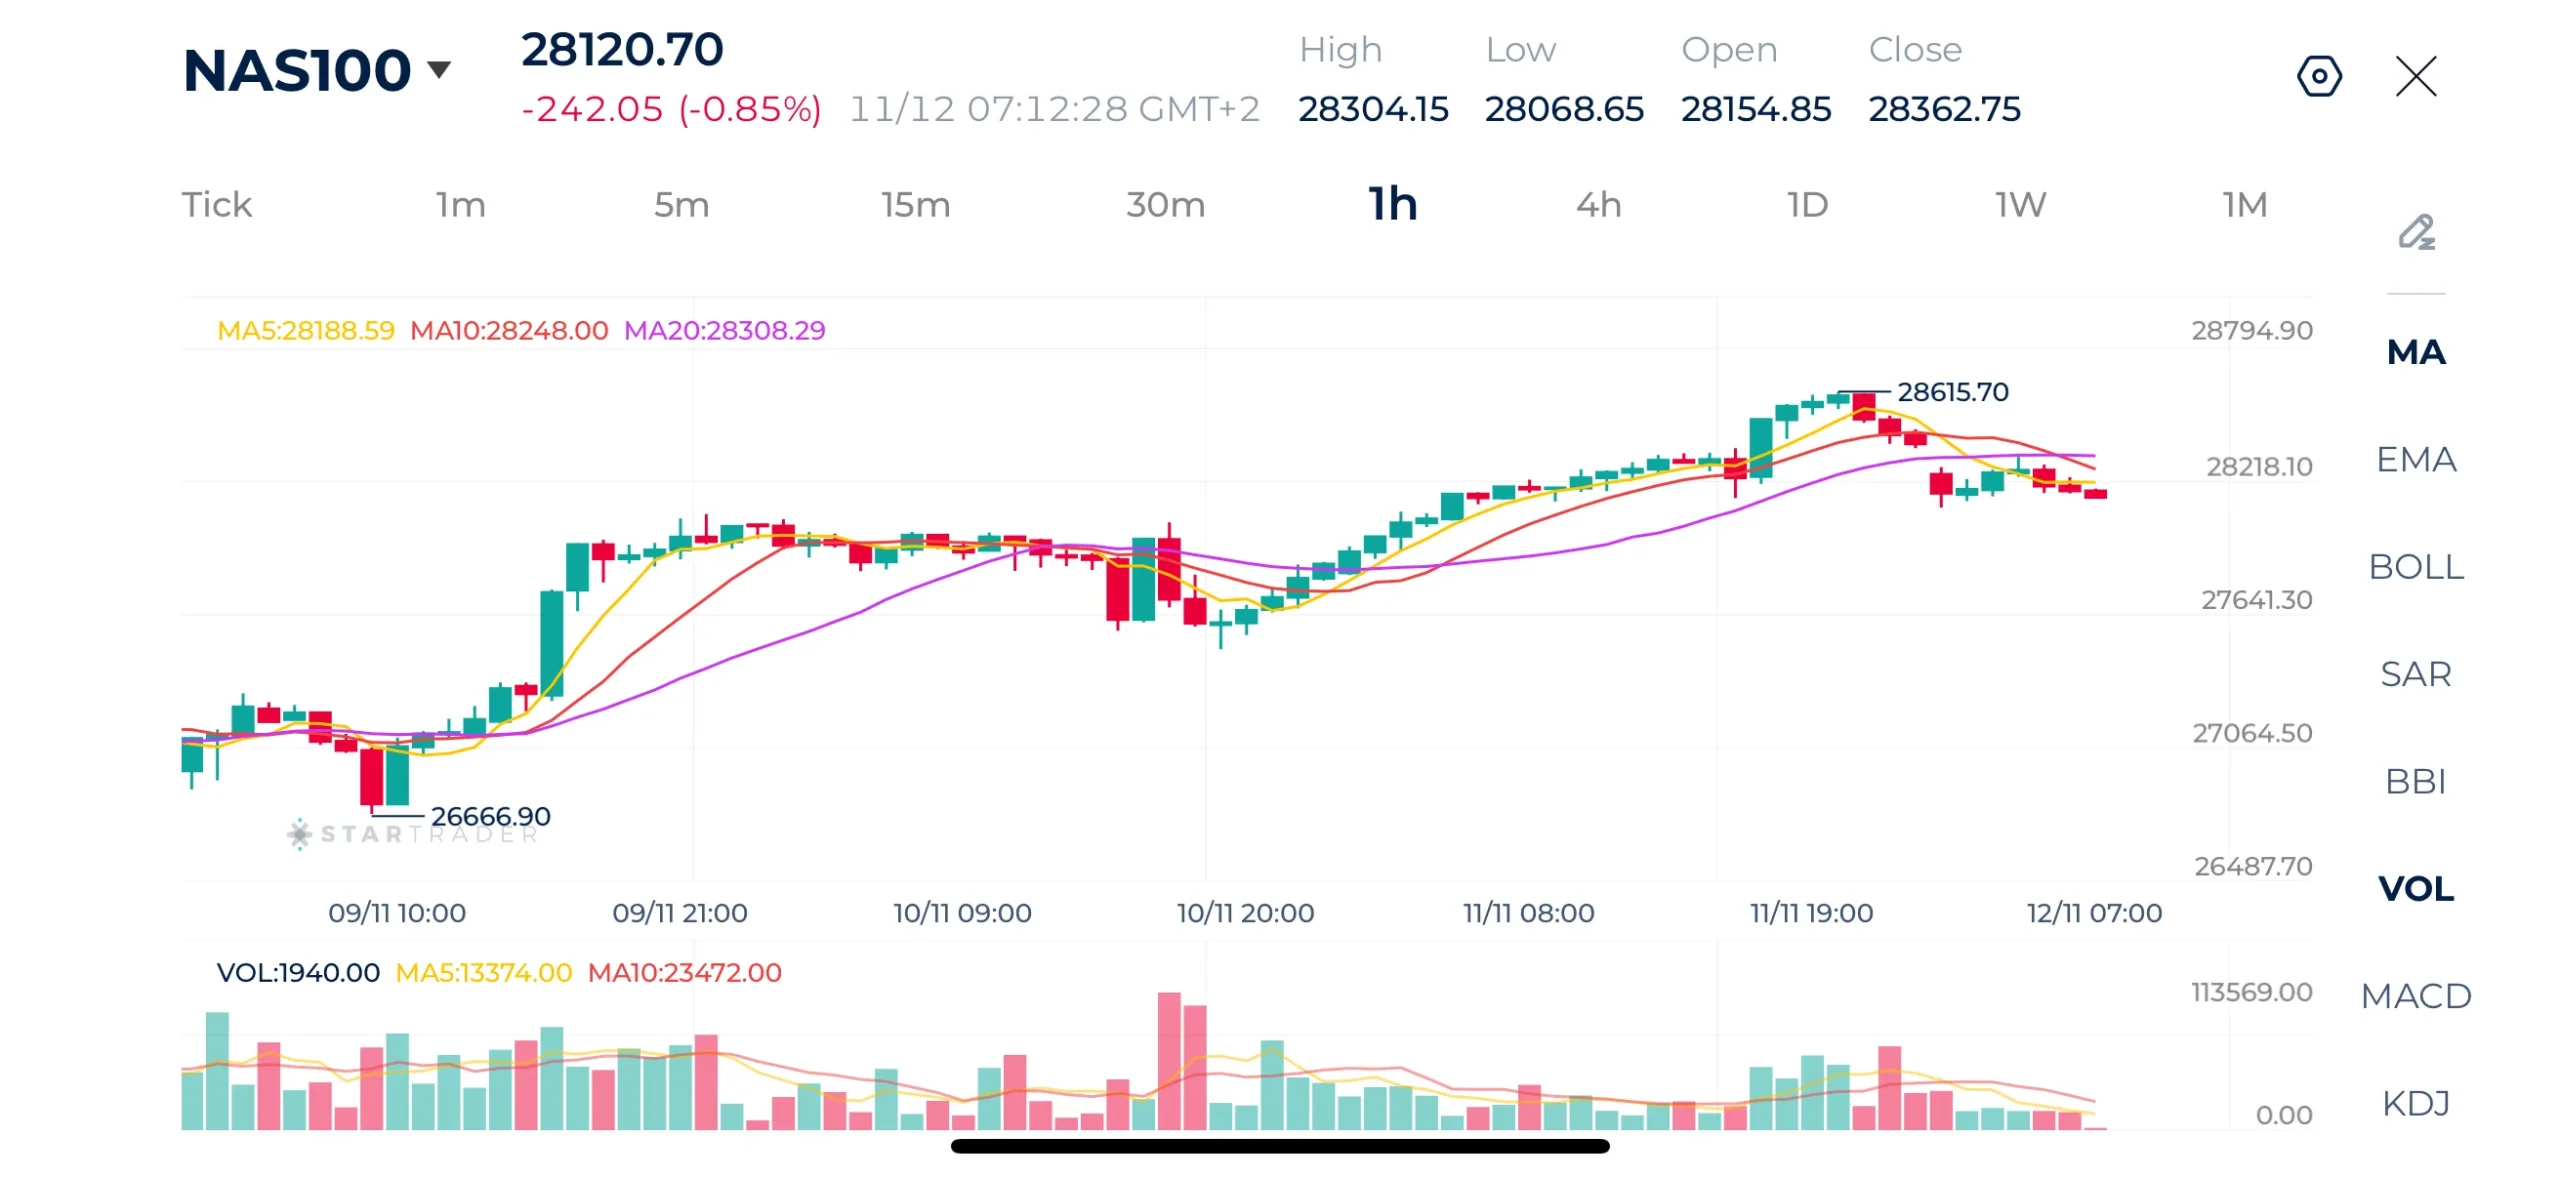
Source: STARTRADER app | Nasdaq-100 maintains bullish structure, but momentum is slowing
| Resistance | 28,250 | 28,615 | 29,000 |
|---|---|---|---|
| Support | 27,950 | 27,760 | 27,650 |
Risk Disclaimer: This material is provided for informational purposes only and does not constitute a recommendation or investment advice. Trading financial instruments on margin involves substantial risk and may not be appropriate for all investors.
Tags


Open Live Account
 Email Address
 Phone Number
Important Notice
STARTRADER does not accept any applications from Australian residents.
To comply with regulatory requirements, clicking the button will redirect you to the STARTRADER website operated by STARTRADER PRIME GLOBAL PTY LTD (ABN 65 156 005 668), an authorized Australian Financial Services Licence holder (AFSL no. 421210) regulated by the Australian Securities and Investments Commission.
Important Notice for Residents of the United Arab Emirates
In alignment with local regulatory requirements, individuals residing in the United Arab Emirates are requested to proceed via our dedicated regional platform at startrader.ae, which is operated by STARTRADER Global Financial Consultation & Financial Analysis L.L.C.. This entity is licensed by the UAE Capital Market Authority (CMA) under License No. 20200000241, and is authorised to introduce financial services and promote financial products in the UAE.
Please click the "Continue" button below to be redirected.


