


Gold Technical Analysis
Gold has begun to stabilize following a sharp decline that pushed prices down to a low of $4,423. The precious metal has managed to recover from those lows and is currently trading above the 20-period moving average, indicating that buyers are attempting to regain short-term control. However, price is still trading below the major swing high at $4,541 and has yet to establish a bullish trend.
Immediate resistance is located around $4,480–$4,490, followed by $4,517 and then the major swing high at $4,541. On the downside, support is found at $4,455, followed by $4,423 and then $4,400. The short-term outlook has improved from bearish to neutral, but gold needs a strong break above $4,490 to confirm that a more meaningful recovery is underway.
Gold 1H Chart
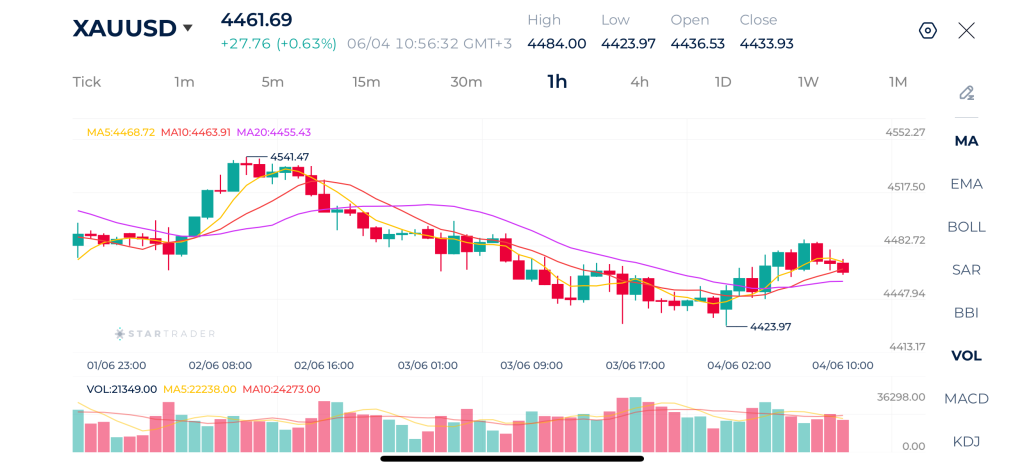
| Resistance | $4,484 | $4,500 | $4,526 |
| Support | $4,424 | $4,380 | $4,366 |
Brent Technical Analysis
Brent crude oil continues to display a constructive bullish structure despite the latest pullback from the $101.07 high. The market remains supported by a series of higher highs and higher lows that have developed since the rebound from the $94.90 area. Although price is currently consolidating below recent highs, it continues to trade close to key moving averages, suggesting that the broader uptrend remains intact.
After reaching $101.07, oil entered a consolidation phase characterized by relatively shallow retracements and limited selling pressure. The 20-period moving average around $99.55 continues to provide underlying support, while the 5-period and 10-period moving averages are beginning to flatten as momentum cools.
A break above $100.00 and subsequently $101.07 would likely signal renewed bullish momentum and open the door toward higher levels. Conversely, a sustained move below $98.50 could trigger a deeper correction toward the 20-period moving average and potentially the $97.00 area. For now, the overall bias remains moderately bullish while price holds above the key support zone.
Brent 1H Chart
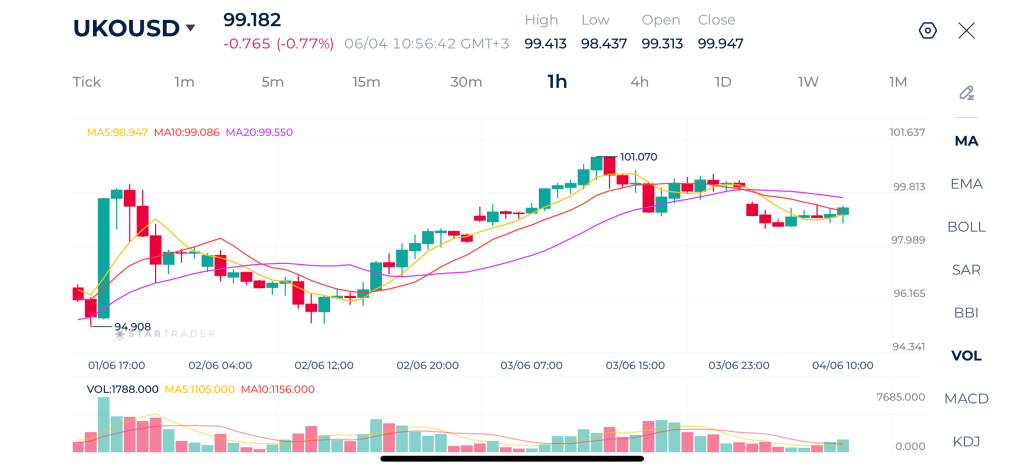
| Resistance | $100.00 | $101.20 | $103.21 |
| Support | $97.80 | $96.25 | $95.00 |
Bitcoin Technical Analysis
Bitcoin remains under significant bearish pressure on the hourly timeframe after experiencing a sharp decline to $61,365. The overall structure continues to favor sellers, as price remains below the 5-period, 10-period, and 20-period moving averages. The moving averages are also bearishly aligned, with the shorter-term averages trading beneath the longer-term average, confirming that downward momentum remains dominant despite occasional recovery attempts.
The latest candles show weakening bullish momentum and renewed selling interest around resistance levels. Immediate support is located at $63,365, followed by the recent low at $61,365. A break below this level could accelerate downside pressure toward the psychological $60,000 area. On the upside, resistance is found at $64,000, followed by the 20-period moving average near $64,800 and then the larger resistance zone around $67,000. Overall, the short-term outlook remains bearish unless Bitcoin can reclaim and hold above the 20-period moving average.
Bitcoin 1H Chart
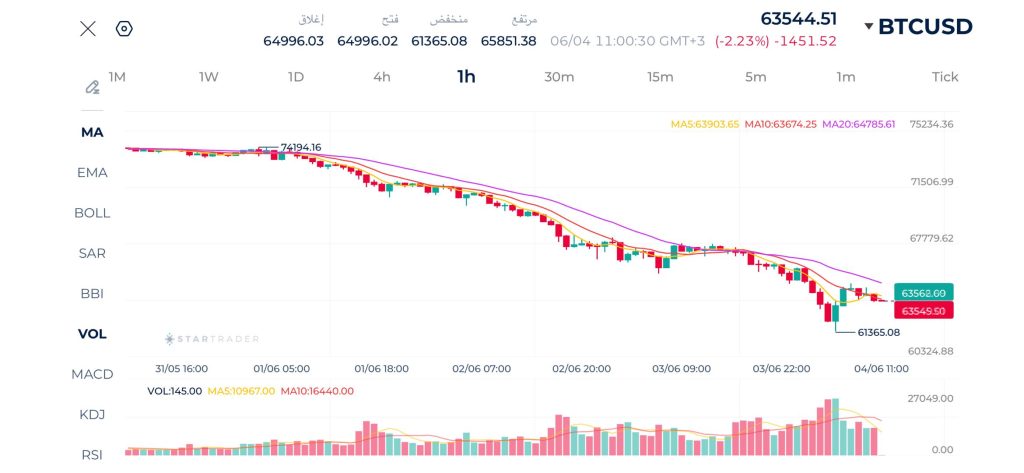
| Resistance | $64,700 | $64,851 | $66,578 |
| Support | $61,300 | $60,981 | $59,977 |
Risk Disclaimer: This material is provided for informational purposes only and does not constitute a recommendation or investment advice. Trading financial instruments on margin involves substantial risk and may not be appropriate for all investors.
Tags
Open Live Account
Please enter a valid country
No results found
No results found
Please enter a valid email
Please enter a valid verification code
1. 8-16 characters + numbers (0-9) 2. blend of letters (A-Z, a-z) 3. special characters (e.g, !a#S%^&)
Please enter the correct format
Please tick the checkbox to proceed
Please tick the checkbox to proceed
Important Notice
STARTRADER does not accept any applications from Australian residents.
To comply with regulatory requirements, clicking the button will redirect you to the STARTRADER website operated by STARTRADER PRIME GLOBAL PTY LTD (ABN 65 156 005 668), an authorized Australian Financial Services Licence holder (AFSL no. 421210) regulated by the Australian Securities and Investments Commission.
CONTINUEImportant Notice for Residents of the United Arab Emirates
In alignment with local regulatory requirements, individuals residing in the United Arab Emirates are requested to proceed via our dedicated regional platform at startrader.ae, which is operated by STARTRADER Global Financial Consultation & Financial Analysis L.L.C.. This entity is licensed by the UAE Capital Market Authority (CMA) under License No. 20200000241, and is authorised to introduce financial services and promote financial products in the UAE.
Please click the "Continue" button below to be redirected.
CONTINUEError! Please try again.

