


Brent Technical Analysis
Brent crude remains under bearish pressure. Following the failure near $96.80, sellers have maintained control and driven prices steadily lower toward fresh swing lows around $78.82.
The moving average structure clearly reflects the bearish trend. The 5-period moving average remains below the 10-period moving average, while both are positioned beneath the declining 20-period moving average. This bearish alignment confirms that momentum remains firmly in favor of sellers and that rallies continue to attract selling interest.
The $78.82 low now represents immediate support. A decisive break beneath this level would likely trigger another wave of selling pressure and could accelerate declines toward the psychological $78.00 level and potentially lower. Resistance is found around $80.00–$80.50, followed by the declining 20-period moving average near $81.00–$82.00. Until Brent is able to reclaim and hold above these resistance zones, the overall technical outlook remains decisively bearish, with sellers maintaining control of the trend.
Brent 1H Chart
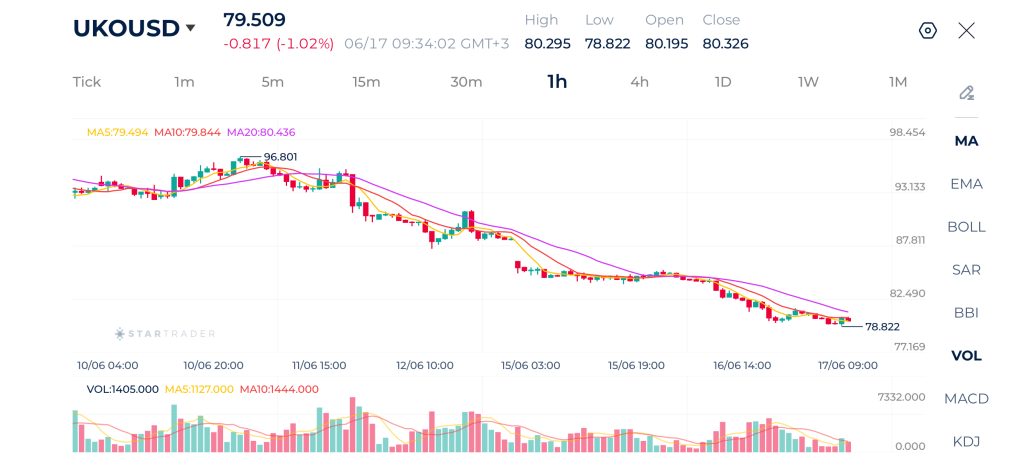
| Resistance | $79.03 | $79.72 | $80.54 |
| Support | $77.54 | $77.00 | $76.42 |
Dow Jones Technical Analysis
The Dow Jones continues to trade within a strong uptrend. The current price action reflects a healthy consolidation phase near the highs.
The moving averages remain firmly supportive of the bullish outlook. The 20-period moving average is trending upward and acting as dynamic support, while the shorter-term averages remain clustered above it.
The recent sideways movement near 52,300 suggests that market participants are digesting gains following the strong rally. Volume has moderated during this consolidation, indicating an absence of aggressive profit-taking.
The immediate resistance zone remains the recent all-time high around 52,312. A successful breakout above this level would reinforce the bullish trend and could open the path toward 52,500 and beyond. Initial support is located near 52,000, followed by stronger support around 51,800 where the moving averages converge. Unless price breaks decisively below these support zones, the broader outlook remains firmly bullish.
Dow Jones 1H Chart
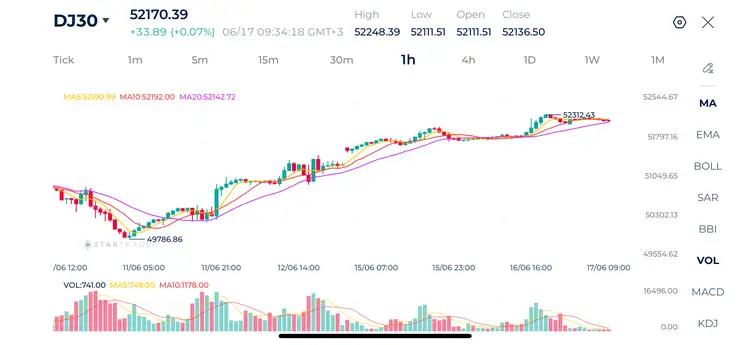
| Resistance | 52,312 | 52,460 | 52,600 |
| Support | 51,963 | 51,800 | 51,647 |
EURUSD Technical Analysis
EURUSD remains in a constructive bullish structure despite the recent period of consolidation.
The moving averages highlight this neutral-to-bullish bias. The 5-period, 10-period, and 20-period moving averages have converged tightly around current price action. Importantly, the 20-period moving average continues to slope slightly upward and price remains above the key support area created by the recent breakout from the 1.1560–1.1570 region.
A break above the recent high at 1.1621 would confirm renewed bullish momentum and potentially expose the 1.1650 region as the next upside target. Conversely, a sustained break below 1.1580 would weaken the bullish structure and increase the risk of a deeper retracement toward 1.1560. For now, the broader bias remains mildly bullish while price continues to hold above the rising medium-term moving average.
EURUSD 1H Chart
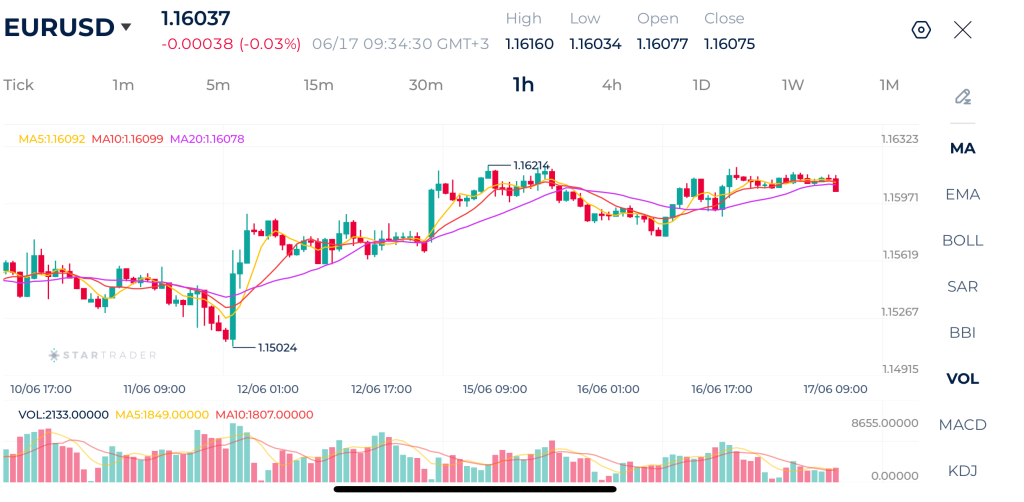
| Resistance | 1.1620 | 1.1645 | 1.1670 |
| Support | 1.1585 | 1.1575 | 1.1554 |
Risk Disclaimer: This material is provided for informational purposes only and does not constitute a recommendation or investment advice. Trading financial instruments on margin involves substantial risk and may not be appropriate for all investors.
Tags
Open Live Account
Please enter a valid country
No results found
No results found
Please enter a valid email
Please enter a valid verification code
1. 8-16 characters + numbers (0-9) 2. blend of letters (A-Z, a-z) 3. special characters (e.g, !a#S%^&)
Please enter the correct format
Please tick the checkbox to proceed
Please tick the checkbox to proceed
Important Notice
STARTRADER does not accept any applications from Australian residents.
To comply with regulatory requirements, clicking the button will redirect you to the STARTRADER website operated by STARTRADER PRIME GLOBAL PTY LTD (ABN 65 156 005 668), an authorized Australian Financial Services Licence holder (AFSL no. 421210) regulated by the Australian Securities and Investments Commission.
CONTINUEImportant Notice for Residents of the United Arab Emirates
In alignment with local regulatory requirements, individuals residing in the United Arab Emirates are requested to proceed via our dedicated regional platform at startrader.ae, which is operated by STARTRADER Global Financial Consultation & Financial Analysis L.L.C.. This entity is licensed by the UAE Capital Market Authority (CMA) under License No. 20200000241, and is authorised to introduce financial services and promote financial products in the UAE.
Please click the "Continue" button below to be redirected.
CONTINUEError! Please try again.

