


Gold Technical Analysis
Gold has resumed its short-term downtrend after failing to sustain the recent recovery. Price is trading below the 5, 10, and 20-period moving averages, confirming that sellers remain firmly in control.
After rebounding from the $3,942 support, gold encountered strong selling pressure around the $4,030–$4,040 resistance area. The rejection from this zone has resulted in another series of lower highs and lower lows, with price now approaching the recent lows once again.
Although selling momentum has moderated slightly, buyers have yet to demonstrate enough strength to reverse the trend.
The short-term outlook remains bearish while gold trades below $4,000–$4,025. A break below $3,963 would confirm renewed selling pressure and increase the probability of a retest of $3,942, with scope for further downside if that support fails. To improve the technical picture, buyers would need to reclaim $4,025 and establish sustained trading above the 20-period moving average.
Gold 1H Chart
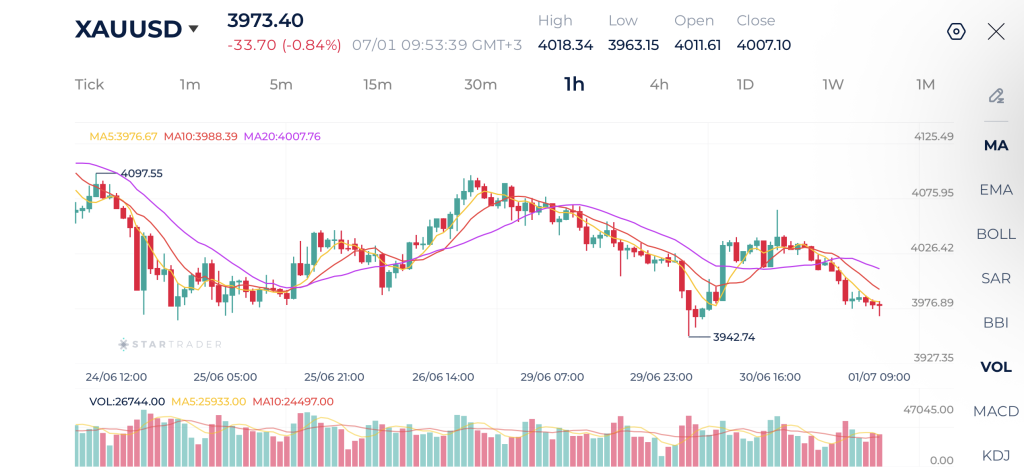
| Resistance | $4,000 | $4,045 | $4,100 |
| Support | $3,942 | $3,900 | $3,854 |
Brent Technical Analysis
Brent crude remains under bearish pressure despite stabilising after last week’s decline. Price continues to trade below the 20-period moving average, while the 5 and 10-period moving averages remain beneath the longer-term trend line, confirming that sellers still have the technical advantage.
The recent recovery attempts have lacked follow-through, indicating weak buying interest.
Following the rebound from $71.63, Brent briefly recovered toward $74.50 before sellers regained control. Price has since rolled over and is once again drifting lower toward the $72.70 area.
The short-term bias remains bearish while Brent trades below $73.30–$73.50. A sustained move below $72.67 would likely trigger another test of the $71.63 support. Conversely, a break above $73.50 would improve the technical outlook and could lead to a recovery toward $74.50.
Brent 1H Chart
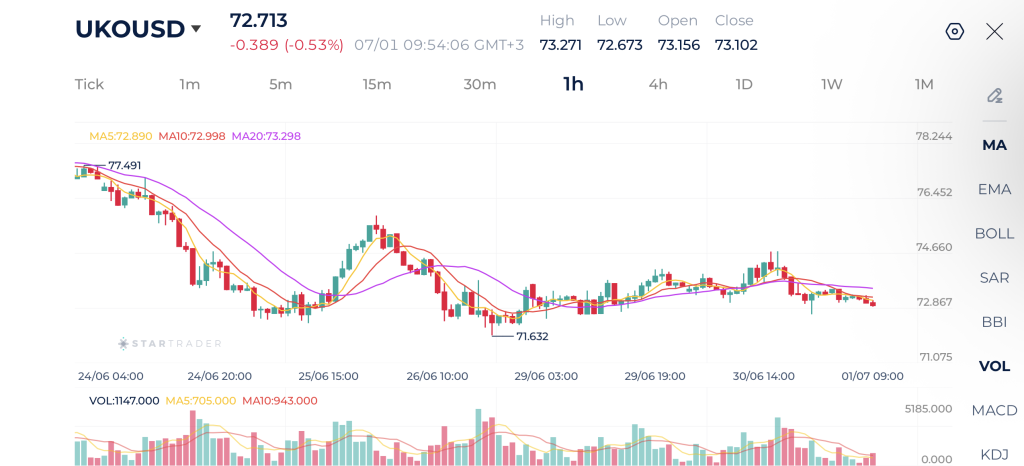
| Resistance | $73.60 | $74.50 | $76.45 |
| Support | $72.67 | $71.85 | $70.25 |
Dow Jones Technical Analysis
The Dow Jones remains in a medium-term bullish trend despite the recent loss of momentum. Price continues to trade above the rising 20-period moving average, although the short-term moving averages (MA5 and MA10) have crossed below the MA20, indicating that bullish momentum has weakened in the near term.
Price is currently consolidating around the 52,235–52,300 region, with relatively narrow candles reflecting reduced volatility and indecision.
The short-term outlook is neutral to slightly bullish. Holding above 52,200 keeps the broader recovery intact and leaves room for another attempt toward 52,600–52,800. However, a decisive break below 52,200 would strengthen the bearish correction and expose the 52,000–51,900 support area.
Dow Jones H Chart
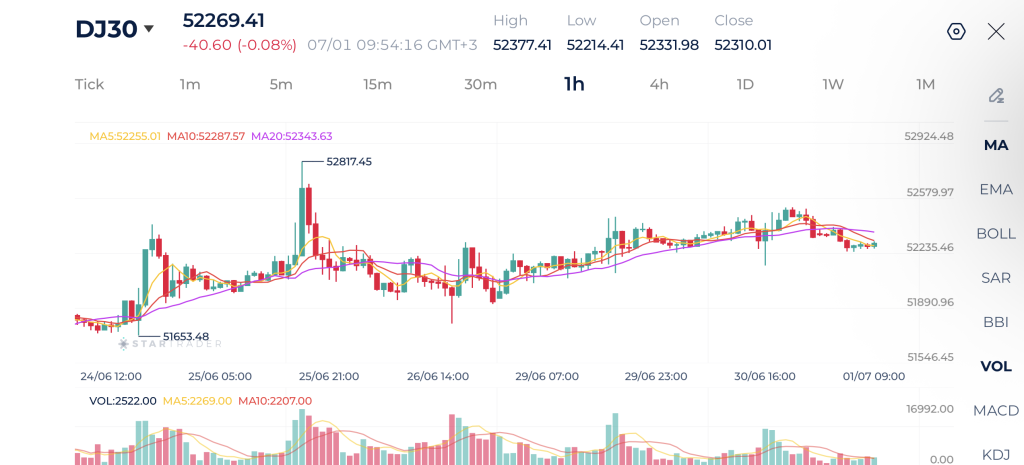
| Resistance | 52,263 | 52,388 | 52,500 |
| Support | 52,000 | 51,857 | 51,597 |
Risk Disclaimer: This material is provided for informational purposes only and does not constitute a recommendation or investment advice. Trading financial instruments on margin involves substantial risk and may not be appropriate for all investors.
Tags
Open Live Account
Please enter a valid country
No results found
No results found
Please enter a valid email
Please enter a valid verification code
1. 8-16 characters + numbers (0-9) 2. blend of letters (A-Z, a-z) 3. special characters (e.g, !a#S%^&)
Please enter the correct format
Please tick the checkbox to proceed
Please tick the checkbox to proceed
Important Notice
STARTRADER does not accept any applications from Australian residents.
To comply with regulatory requirements, clicking the button will redirect you to the STARTRADER website operated by STARTRADER PRIME GLOBAL PTY LTD (ABN 65 156 005 668), an authorized Australian Financial Services Licence holder (AFSL no. 421210) regulated by the Australian Securities and Investments Commission.
CONTINUEImportant Notice for Residents of the United Arab Emirates
In alignment with local regulatory requirements, individuals residing in the United Arab Emirates are requested to proceed via our dedicated regional platform at startrader.ae, which is operated by STARTRADER Global Financial Consultation & Financial Analysis L.L.C.. This entity is licensed by the UAE Capital Market Authority (CMA) under License No. 20200000241, and is authorised to introduce financial services and promote financial products in the UAE.
Please click the "Continue" button below to be redirected.
CONTINUEError! Please try again.

