


Brent Technical Analysis
Brent crude continues to display a clear bearish trend, with sellers maintaining firm control across all major moving averages.
The moving average structure remains negative. The 5-period MA is positioned below the 10-period MA, while both remain beneath the declining 20-period MA. This bearish alignment reflects persistent downside momentum and suggests that rallies continue to be viewed as selling opportunities. Price remains compressed beneath all major moving averages, indicating a lack of buying conviction.
The immediate support level remains the recent low at $77.00. A decisive break below this level would likely trigger another wave of selling pressure and expose the $76.00 region as the next downside objective. Resistance is located around $79.50–$80.00, followed by stronger resistance near the declining 20-period moving average around $81.50. Unless Brent can reclaim and sustain trading above these levels, the broader technical outlook remains strongly bearish.
Brent 1H Chart
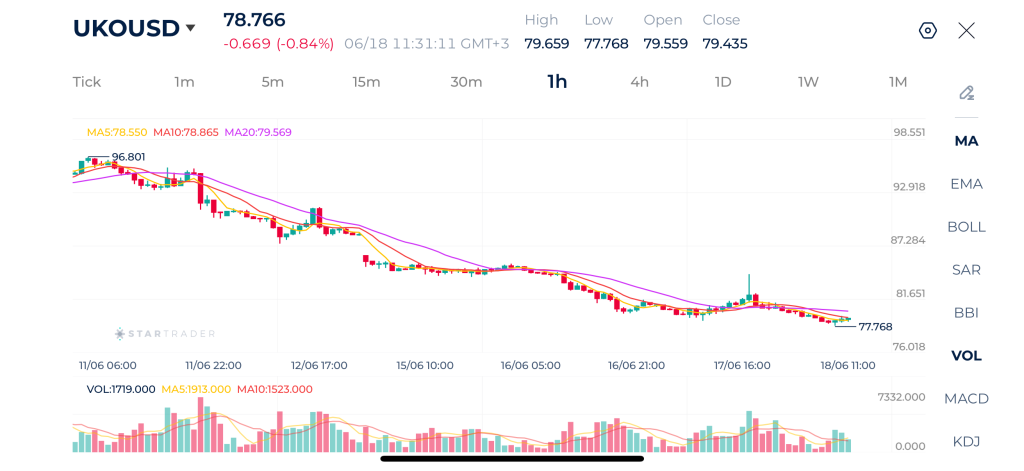
| Resistance | $80.21 | $81.55 | $83.20 |
| Support | $77.00 | $76.00 | $74.43 |
Gold Technical Analysis
Gold remains in a medium-term recovery phase despite experiencing significant volatility during recent sessions. After forming a major low around $4,053, the metal staged a powerful rally that carried prices above $4,380. This advance established a bullish structure characterized by higher highs and higher lows, supported by a rising 20-period moving average.
However, the recent rejection from the $4,382 area triggered a sharp correction that pushed price back below the shorter-term moving averages. The decline was aggressive and accompanied by elevated volume, suggesting profit-taking and a temporary shift toward risk appetite. Despite this pullback, gold continues to trade above the key support region created by the previous breakout zone around $4,250–$4,270, which keeps the broader recovery structure intact.
The key resistance remains the recent swing high near $4,382. A break above this level would confirm renewed bullish momentum and potentially target the $4,450 region. On the downside, immediate support is located around $4,250, followed by stronger support near $4,200 and the rising 20-period moving average. As long as gold remains above these support levels, the broader recovery bias remains intact, although short-term momentum has clearly weakened following the latest correction.
Gold 1H Chart
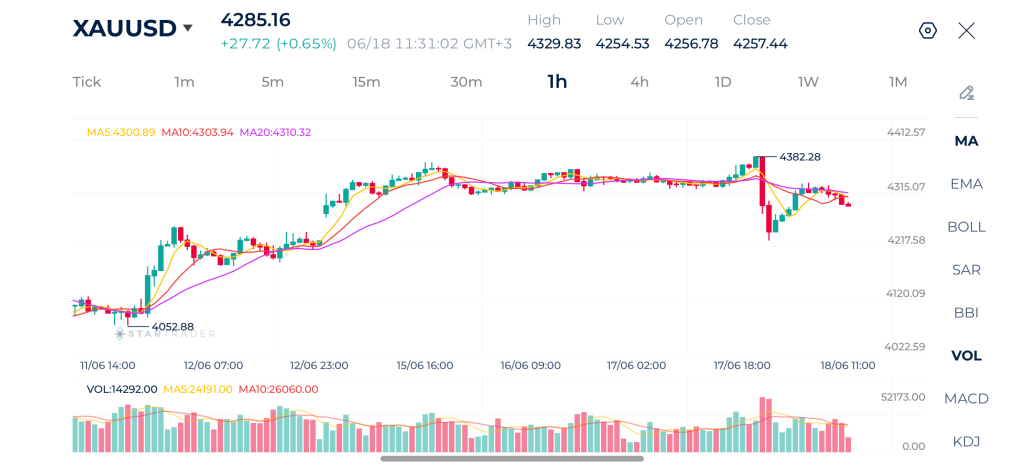
| Resistance | $4,329 | $4,381 | $4,457 |
| Support | $4,218 | $4,170 | $4,130 |
Nasdaq Technical Analysis
The Nasdaq 100 remains in a broadly bullish structure despite the recent volatility surrounding central bank expectations and geopolitical developments.
The latest price action shows buyers attempting to regain momentum after defending support around the 29,700–29,800 area. The short-term moving averages have started turning higher again, with the 5-period MA crossing back above the 10-period MA while both remain above the 20-period MA. This alignment suggests that bullish momentum is rebuilding after the recent pullback. Price is also trading around the psychologically important 30,000 level, indicating that buyers continue to defend this key area.
The immediate resistance remains the recent swing high at 30,712. A breakout above this level would confirm continuation of the broader uptrend and potentially open the path toward 31,000. On the downside, initial support is located near 29,900 followed by stronger support around 29,650 and the rising 20-period moving average. As long as price remains above these levels, the overall outlook remains constructive with bulls retaining control.
Nasdaq 1H Chart
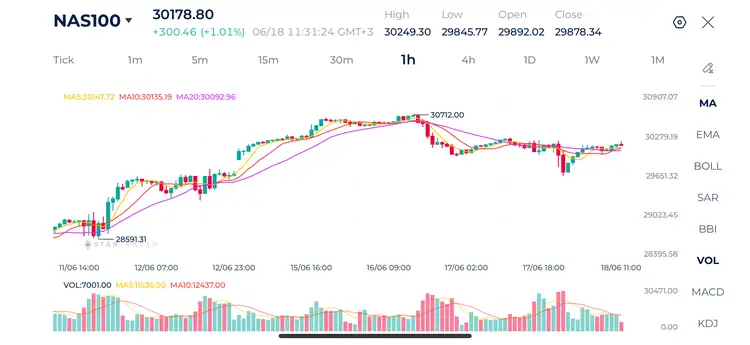
| Resistance | $4,329 | $4,380 | $4,400 |
| Support | $4,257 | $4,212 | $4,169 |
Risk Disclaimer: This material is provided for informational purposes only and does not constitute a recommendation or investment advice. Trading financial instruments on margin involves substantial risk and may not be appropriate for all investors.
Tags
Open Live Account
Please enter a valid country
No results found
No results found
Please enter a valid email
Please enter a valid verification code
1. 8-16 characters + numbers (0-9) 2. blend of letters (A-Z, a-z) 3. special characters (e.g, !a#S%^&)
Please enter the correct format
Please tick the checkbox to proceed
Please tick the checkbox to proceed
Important Notice
STARTRADER does not accept any applications from Australian residents.
To comply with regulatory requirements, clicking the button will redirect you to the STARTRADER website operated by STARTRADER PRIME GLOBAL PTY LTD (ABN 65 156 005 668), an authorized Australian Financial Services Licence holder (AFSL no. 421210) regulated by the Australian Securities and Investments Commission.
CONTINUEImportant Notice for Residents of the United Arab Emirates
In alignment with local regulatory requirements, individuals residing in the United Arab Emirates are requested to proceed via our dedicated regional platform at startrader.ae, which is operated by STARTRADER Global Financial Consultation & Financial Analysis L.L.C.. This entity is licensed by the UAE Capital Market Authority (CMA) under License No. 20200000241, and is authorised to introduce financial services and promote financial products in the UAE.
Please click the "Continue" button below to be redirected.
CONTINUEError! Please try again.

