


S&P500 Technical Analysis
The index is consolidating after reaching a new record high at 6,564. The current structure looks like a bullish flag, which could precede another leg higher.
Price is holding just above the 30-period moving average. Short-term moving averages are slightly flattening, suggesting consolidation but not yet bearish.
MACD showed a bearish crossover recently, with bars slightly below zero. Momentum is weakening, but not strongly negative.
As long as SP500 holds 6,525, bias remains bullish. A breakout above 6,565–6,600 would extend the uptrend. However, a drop below 6,525 could open downside toward 6,480.
S&P500 1H Chart
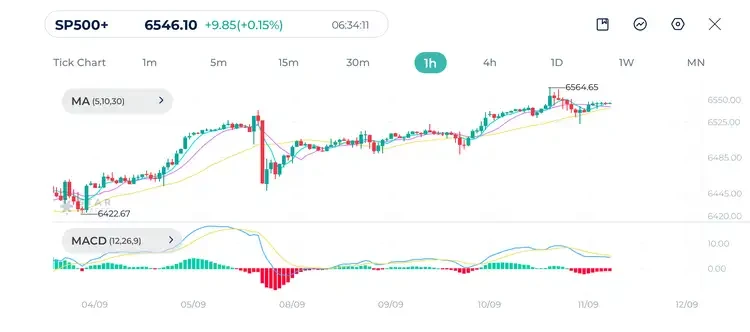
| Resistance | 6,547 | 6,557 | 6,575 |
| Support | 6,529 | 6,510 | 6,492 |
Gold Technical Analysis
Gold rejected $3,674 resistance after a strong rally that went on for days, and is now trading lower, with short-term weakness showing. Price is below the short-term moving averages, testing the 30-period moving average. If it breaks lower, the bearish bias strengthens.
MACD shows strong bearish crossover, and the indicator is in negative territory. Momentum supports further downside.
Gold is currently under pressure, but remains in a bullish trend. If $3,610 breaks, a move toward $3,580 is likely. Buyers need a recovery above $3,650 to regain strength.
Gold (XAUUSD) 1H Chart
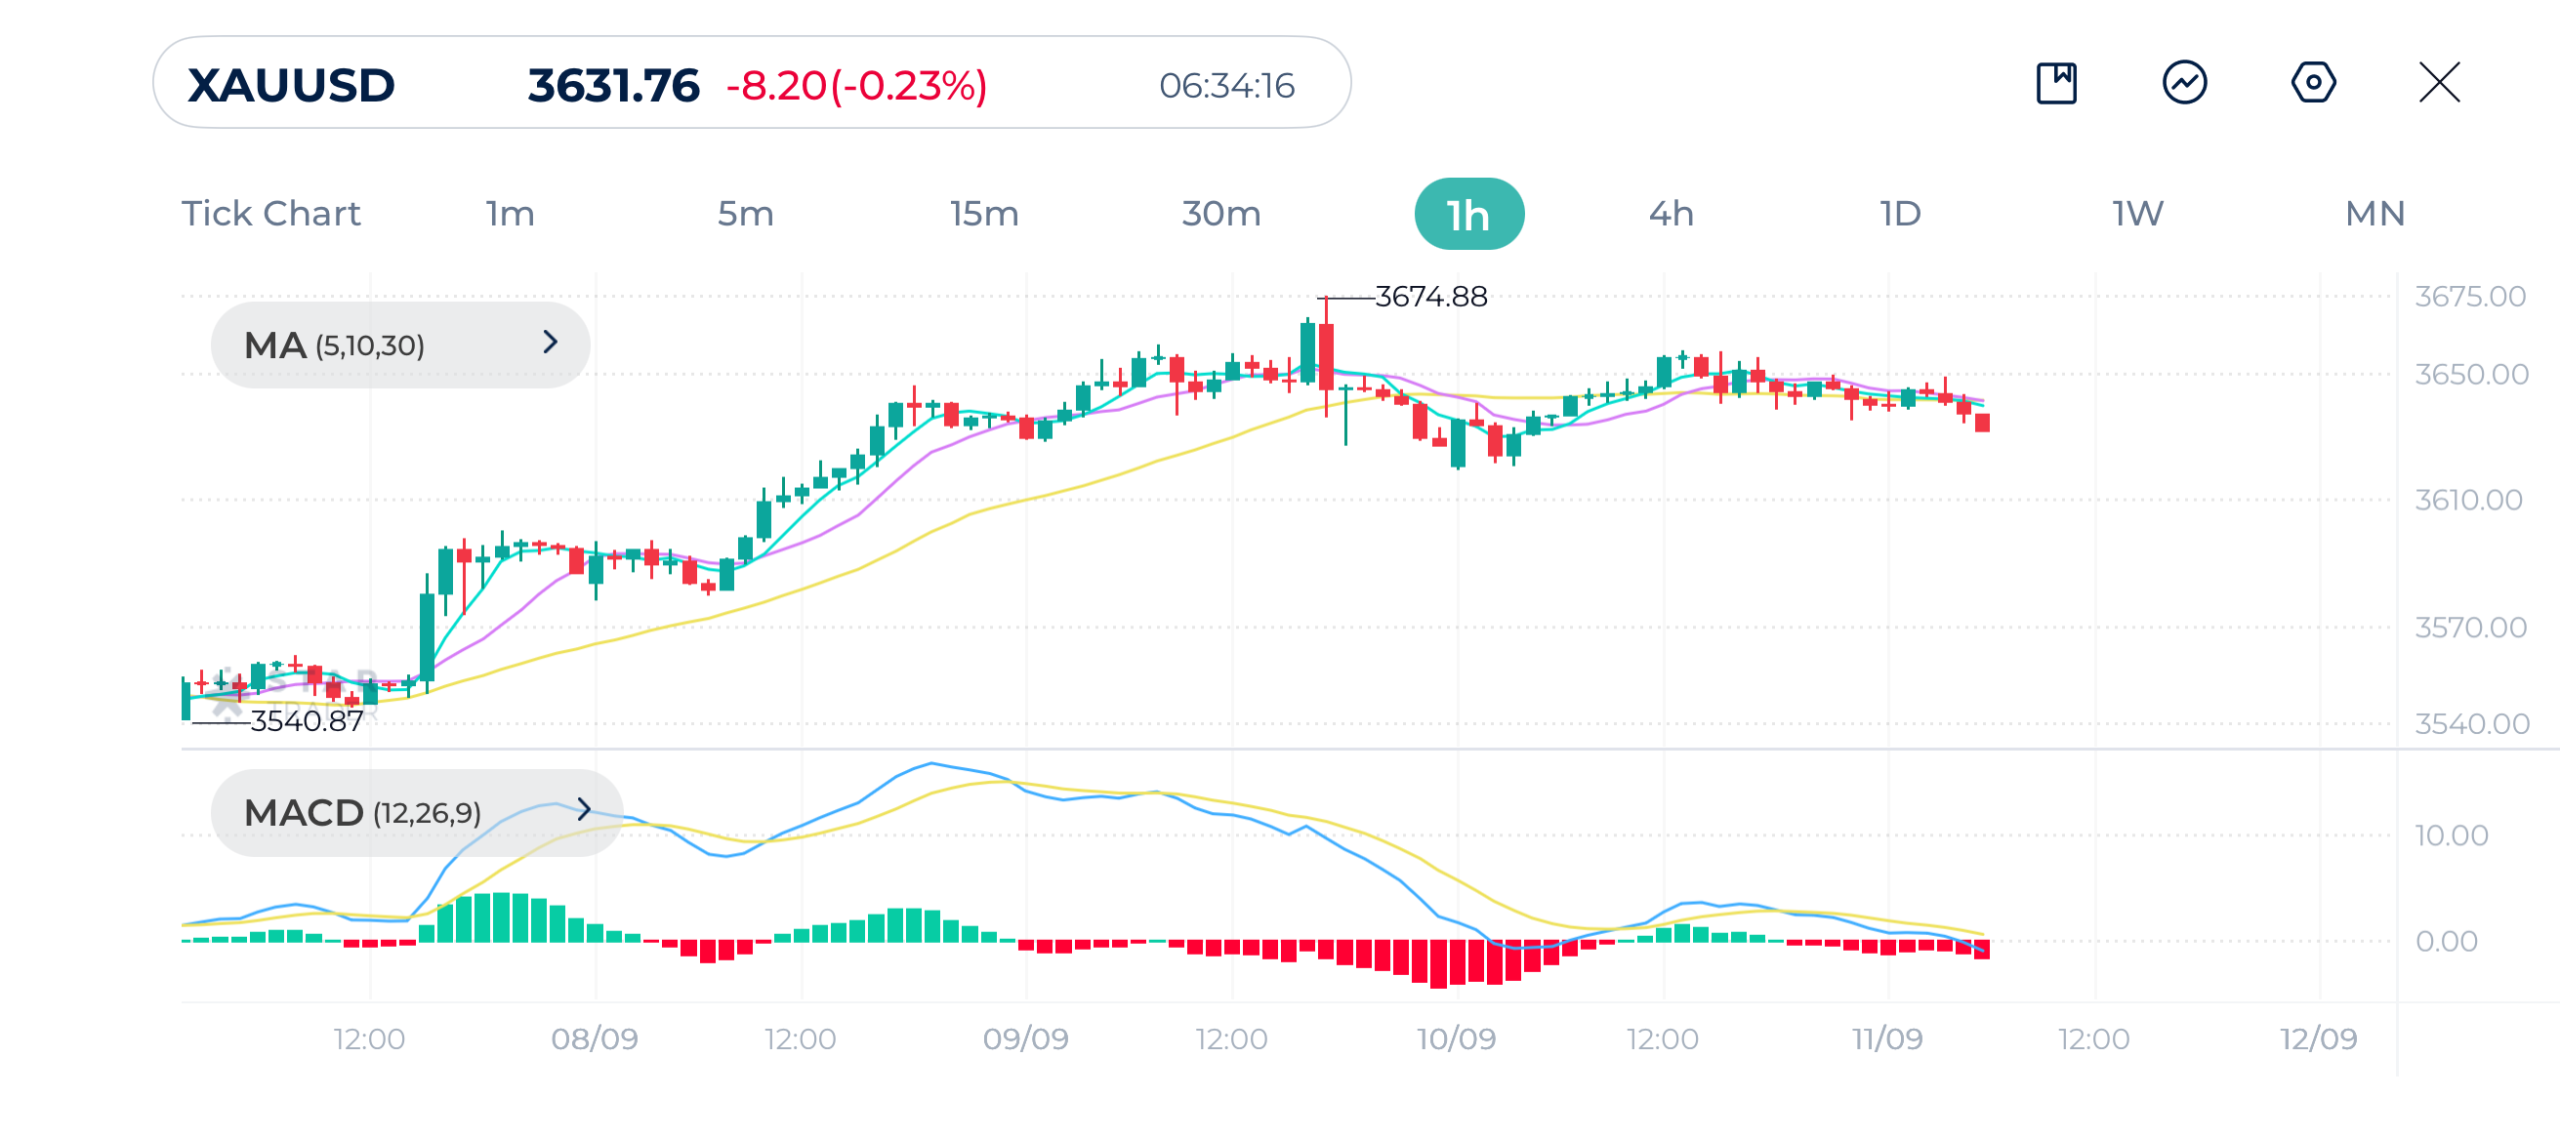
| Resistance | $3,649 | $3,657 | $3,675 |
| Support | $3,620 | $3,596 | $3,578 |
Ethereum Technical Analysis
Ethereum shows a bullish rebound after touching $4,275 support and rallying to $4,451. The short-term moving averages MA(5 & 10) crossed above the MA(30), signaling short-term bullish momentum. Price is trading above the 30-period moving average, which strengthens the uptrend.
MACD turned positive with a bullish crossover earlier, though momentum looks to be moderating slightly.
Ethereum bias is bullish above $4,320. If momentum continues, Ethereum may retest $4,450–$4,500. A break above $4,500 would confirm strength, while failure to hold $4,320 could trigger a pullback to $4,275.
Ethereum (ETHUSD) 1H Chart
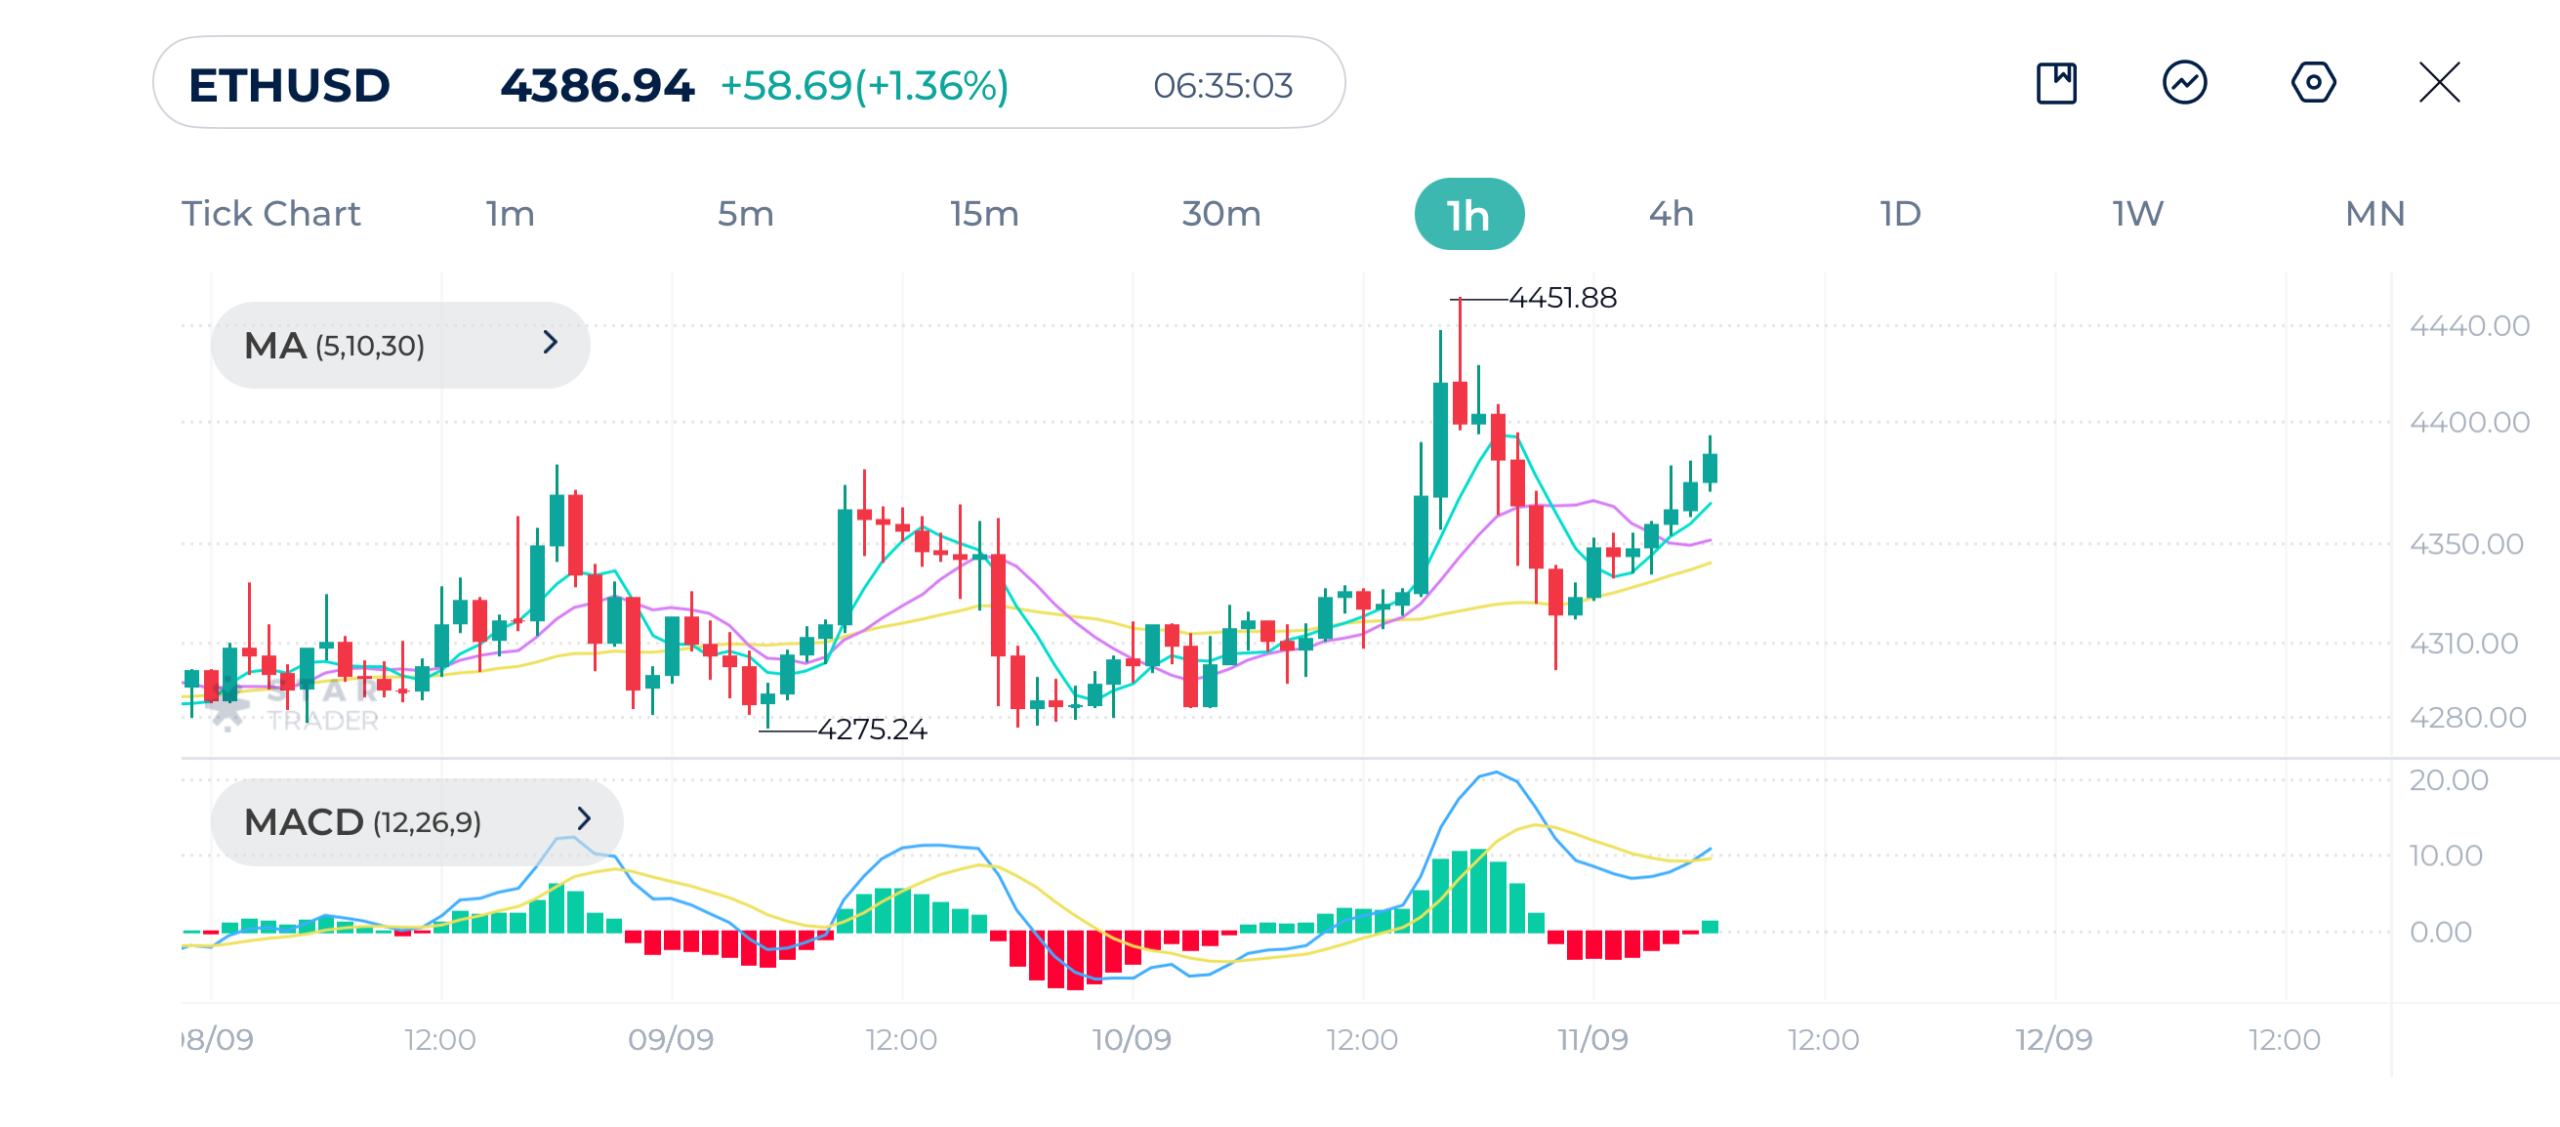
| Resistance | $4,424 | $4,452 | $4,500 |
| Support | $4,339 | $4,300 | $4,278 |
Tags
Open Live Account
Please enter a valid country
No results found
No results found
Please enter a valid email
Please enter a valid verification code
1. 8-16 characters + numbers (0-9) 2. blend of letters (A-Z, a-z) 3. special characters (e.g, !a#S%^&)
Please enter the correct format
Please tick the checkbox to proceed
Please tick the checkbox to proceed
Important Notice
STARTRADER does not accept any applications from Australian residents.
To comply with regulatory requirements, clicking the button will redirect you to the STARTRADER website operated by STARTRADER PRIME GLOBAL PTY LTD (ABN 65 156 005 668), an authorized Australian Financial Services Licence holder (AFSL no. 421210) regulated by the Australian Securities and Investments Commission.
CONTINUEImportant Notice for Residents of the United Arab Emirates
In alignment with local regulatory requirements, individuals residing in the United Arab Emirates are requested to proceed via our dedicated regional platform at startrader.ae, which is operated by STARTRADER Global Financial Consultation & Financial Analysis L.L.C.. This entity is licensed by the UAE Capital Market Authority (CMA) under License No. 20200000241, and is authorised to introduce financial services and promote financial products in the UAE.
Please click the "Continue" button below to be redirected.
CONTINUEError! Please try again.

