


Gold Technical Analysis
Gold has been in a strong uptrend from $3,470, to the current record high $3,659.
Price is still trading above all three moving averages MA(5), MA(10), and MA(30), but the shorter averages are flattening.
MACD shows bearish divergence, signaling potential for a short-term correction.
Gold may see a pullback toward $3,600–$3,620 before attempting another leg higher. If $3,659 breaks with volume, the next resistance lies near psychological level $3,700.
Gold 1H Chart
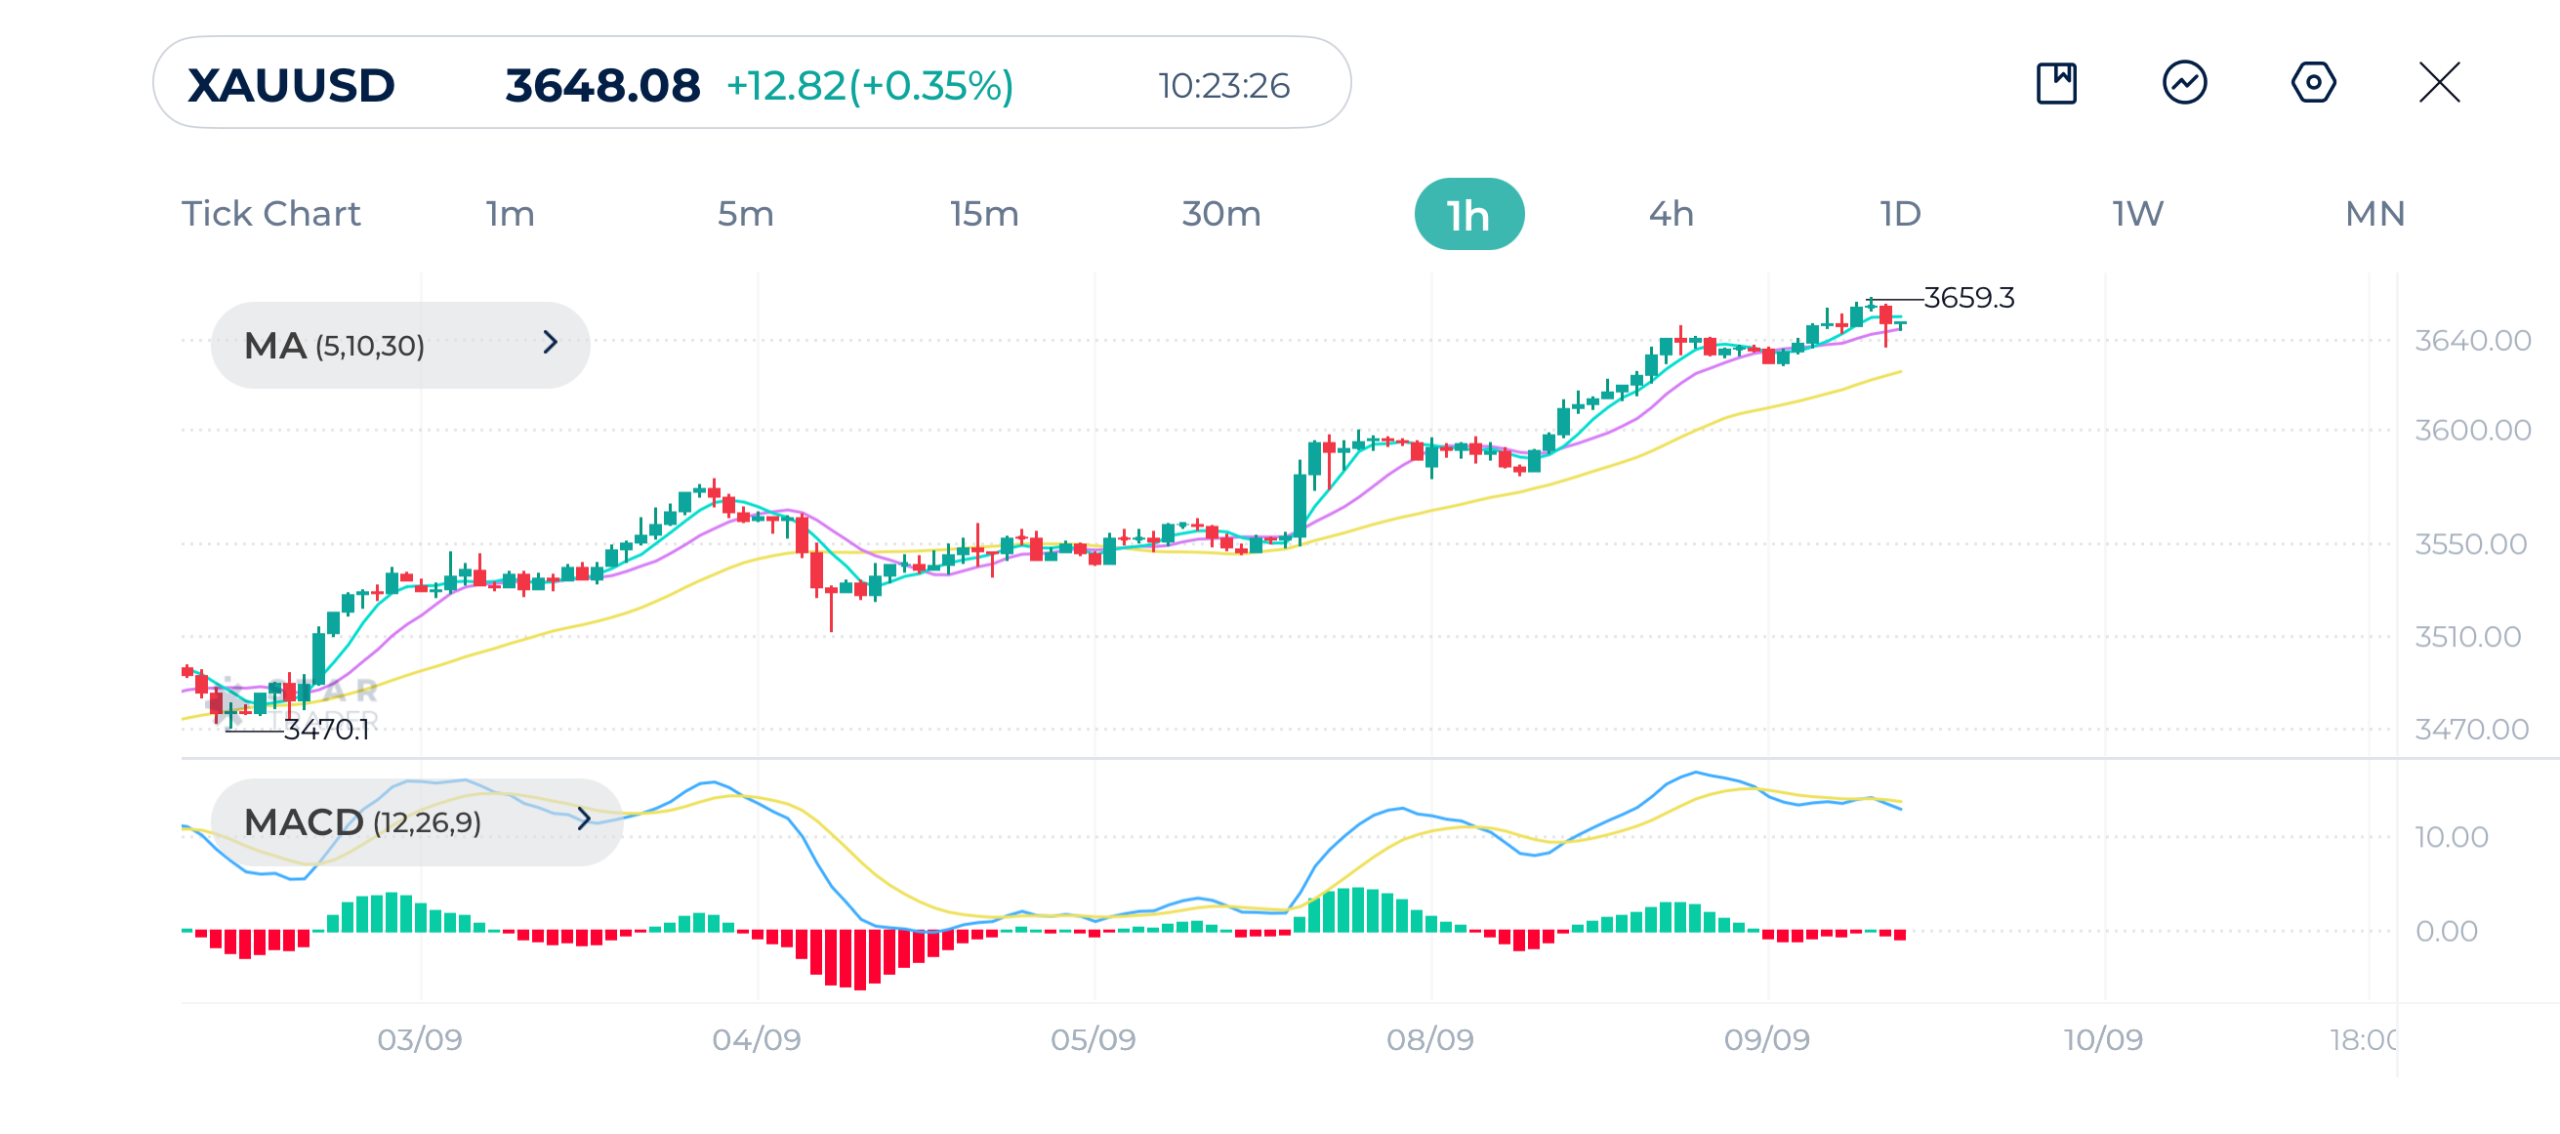
| Resistance | $3,659 | $3,675 | $3,700 |
| Support | $3,635 | $3,627 | $3,600 |
Ethereum Technical Analysis
After dropping from $4,490 to $4,235, Ether consolidated sideways, and now we see a bullish breakout above the short-term moving averages MA(5) and MA(10)
The short-term moving averages MA(5) and MA(10) are crossing above the 30-period moving average, confirming renewed bullish momentum.
Price is trading above all moving averages, suggesting buyers are regaining control.
The MACD line has crossed above the signal line, moving into positive territory, indicating that momentum is shifting to the upside.
Ether still looks bullish in the short term. A break above $4,400–$4,490 could extend gains toward $4,550–$4,600, while a drop back below $4,300 may signal weakness.
Ethereum 1H Chart
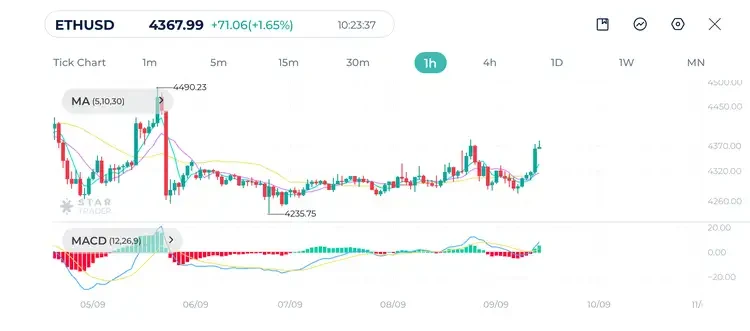
| Resistance | $4,383 | $4,435 | $4,497 |
| Support | $4,278 | $4,241 | $4,205 |
EURUSD Technical Analysis
EURUSD has rebounded strongly from 1.1607 to 1.1779, but price is now stalling.
Moving averages M(5) and MA(10) MA are beginning to flatten after a sharp uptrend. Price remains above the 30-period moving average, so the medium-term trend is still bullish.
MACD shows signs of momentum cooling. A bearish crossover may be forming soon if downside pressure continues.
EURUSD is in a clear uptrend on the hourly chart. A breakout above 1.1780 would extend bullish momentum toward 1.1830, but if it falls below 1.1720, we could see a deeper pullback.
EURUSD 1H Chart
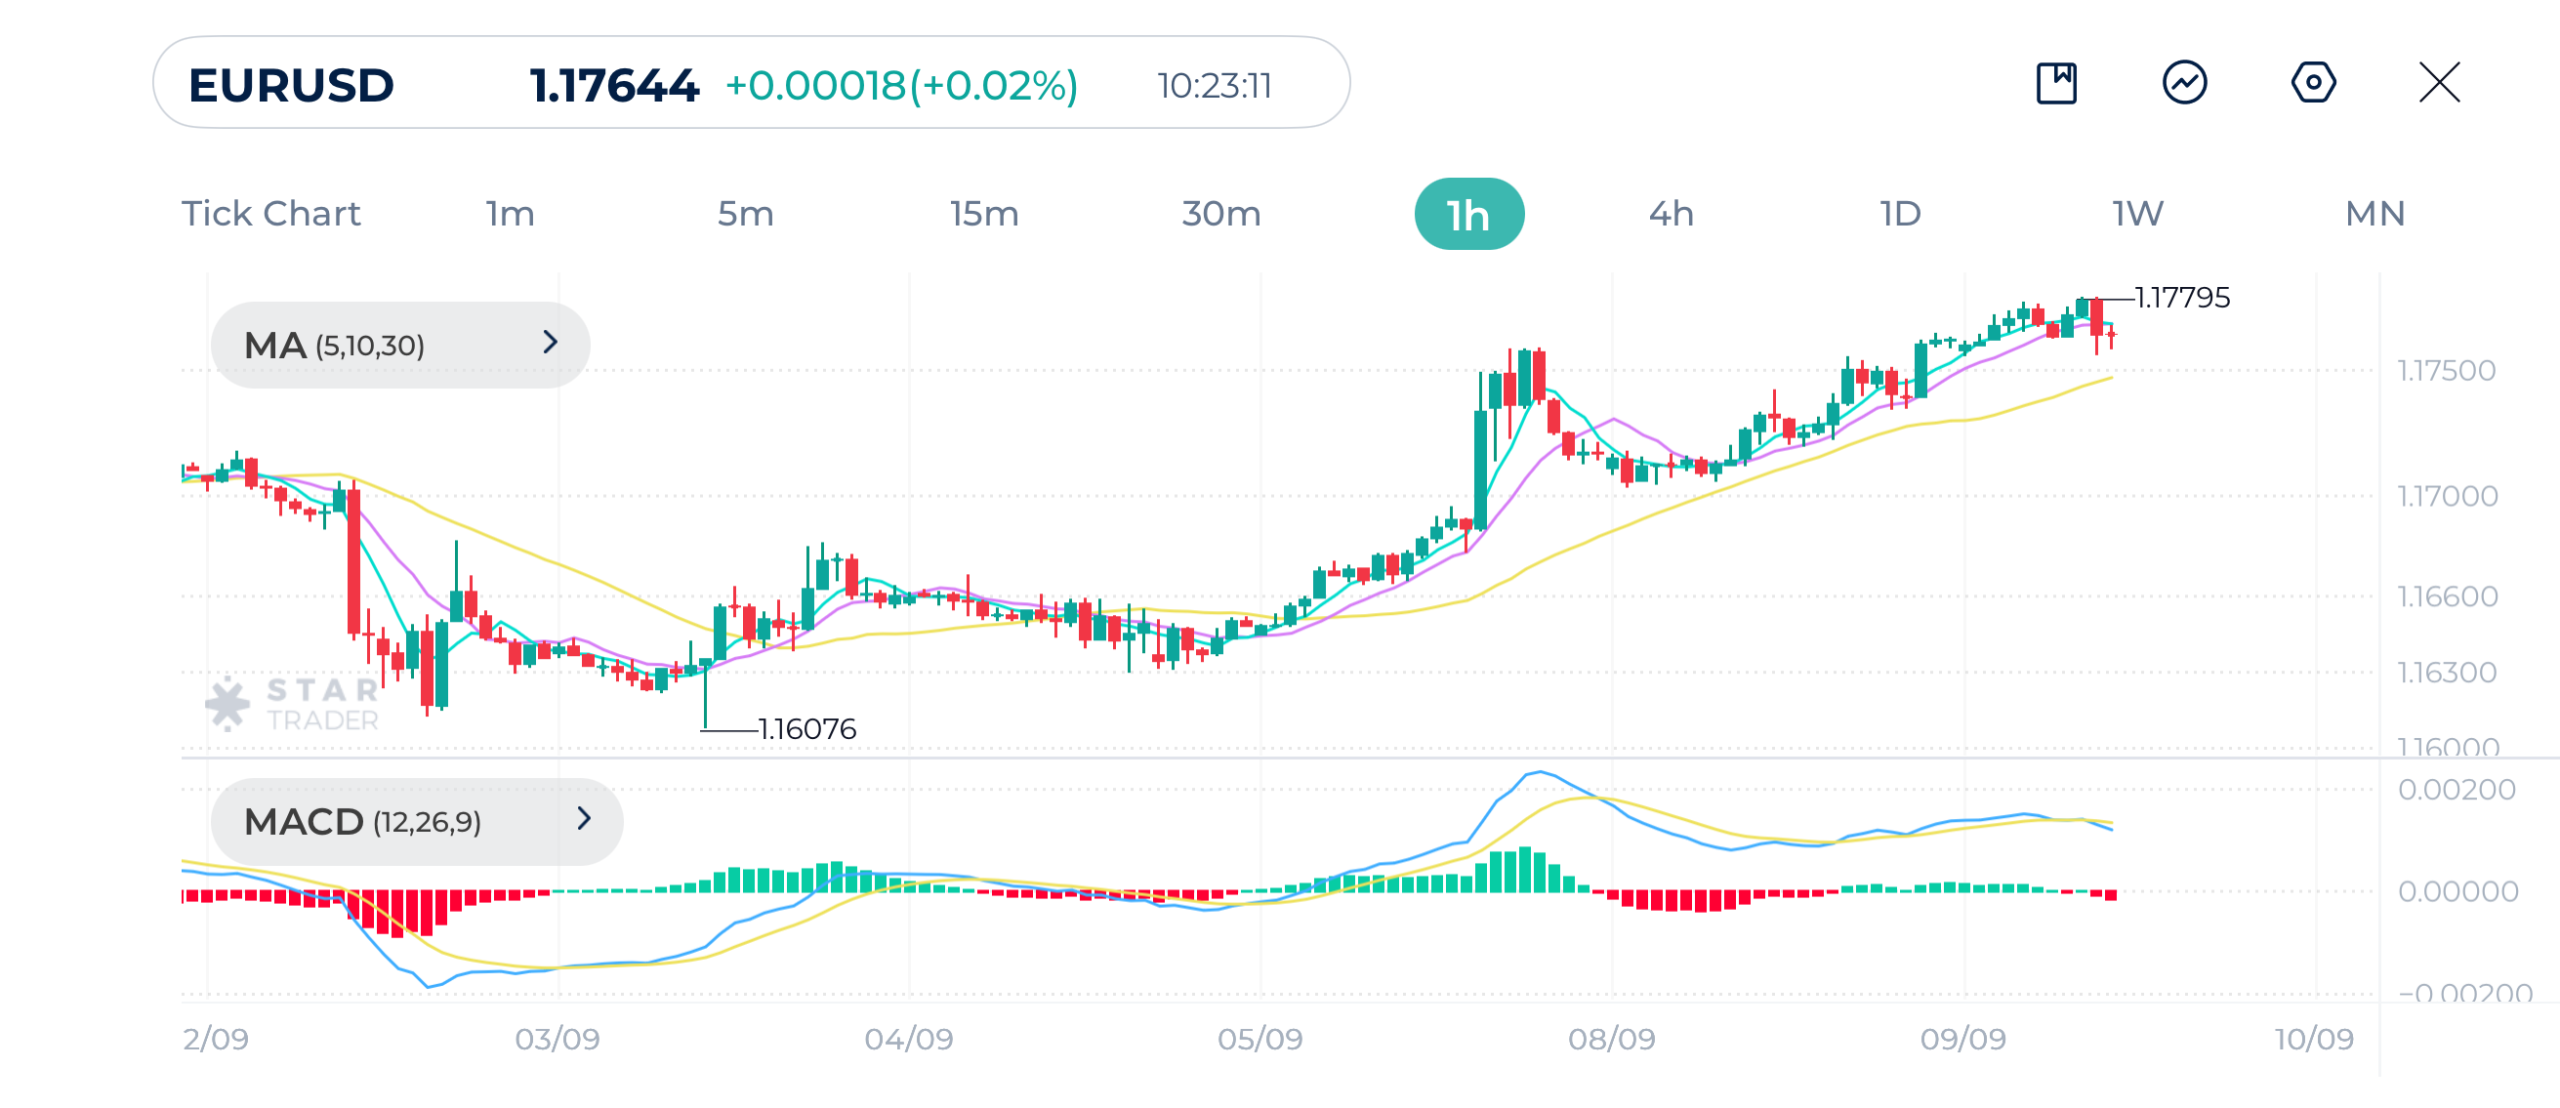
| Resistance | 1.1779 | 1.1821 | 1.1854 |
| Support | 1.1751 | 1.1733 | 1.1711 |
Tags
Open Live Account
Please enter a valid country
No results found
No results found
Please enter a valid email
Please enter a valid verification code
1. 8-16 characters + numbers (0-9) 2. blend of letters (A-Z, a-z) 3. special characters (e.g, !a#S%^&)
Please enter the correct format
Please tick the checkbox to proceed
Please tick the checkbox to proceed
Important Notice
STARTRADER does not accept any applications from Australian residents.
To comply with regulatory requirements, clicking the button will redirect you to the STARTRADER website operated by STARTRADER PRIME GLOBAL PTY LTD (ABN 65 156 005 668), an authorized Australian Financial Services Licence holder (AFSL no. 421210) regulated by the Australian Securities and Investments Commission.
CONTINUEImportant Notice for Residents of the United Arab Emirates
In alignment with local regulatory requirements, individuals residing in the United Arab Emirates are requested to proceed via our dedicated regional platform at startrader.ae, which is operated by STARTRADER Global Financial Consultation & Financial Analysis L.L.C.. This entity is licensed by the UAE Capital Market Authority (CMA) under License No. 20200000241, and is authorised to introduce financial services and promote financial products in the UAE.
Please click the "Continue" button below to be redirected.
CONTINUEError! Please try again.

