


Gold Technical Analysis
Gold has entered a corrective phase after the strong bullish rally that pushed price toward the $4,773 resistance level. The rally appears to have lost momentum near resistance, leading to profit-taking and renewed selling pressure.
The technical structure currently reflects short term bearish correction. Price has slipped below both the MA5 and MA10 moving averages, while the MA5 has crossed beneath the MA10, confirming weakening momentum. The rejection from $4,773 established a clear resistance ceiling after an extended bullish run.
The $4,680-$4,700 region now becomes the key short-term support zone. If buyers manage to stabilize above this area, gold could attempt another recovery toward $4,735 and potentially retest the $4,773 high. However, continued trading below the MA20 would likely keep pressure on the market and increase the probability of a deeper retracement toward $4,650.
Gold 1H Chart
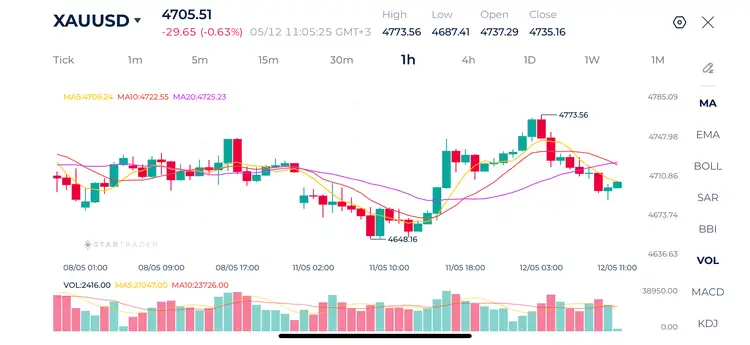
| Resistance | $4,715 | $4,762 | $4,800 |
| Support | $4,678 | $4,646 | $4,614 |
Brent Technical Analysis
Oil is clearly bullish on the 1-hour timeframe. Crude brent is trading comfortably above the MA5, MA10, and MA20 moving averages.
The breakout above the $107-$108 consolidation region was a major bullish signal because it confirmed continuation of the recovery structure
Momentum is also supported by improving market structure. Pullbacks have remained shallow, and buyers continue to absorb selling pressure quickly whenever the market dips.
If oil successfully breaks above $110 on sustained momentum, the next upside targets could emerge near $112 and potentially $115. On the downside, the first important support zone sits around $107.50-$108.00, followed by stronger support near the MA20 around $106.
Brent 1H Chart
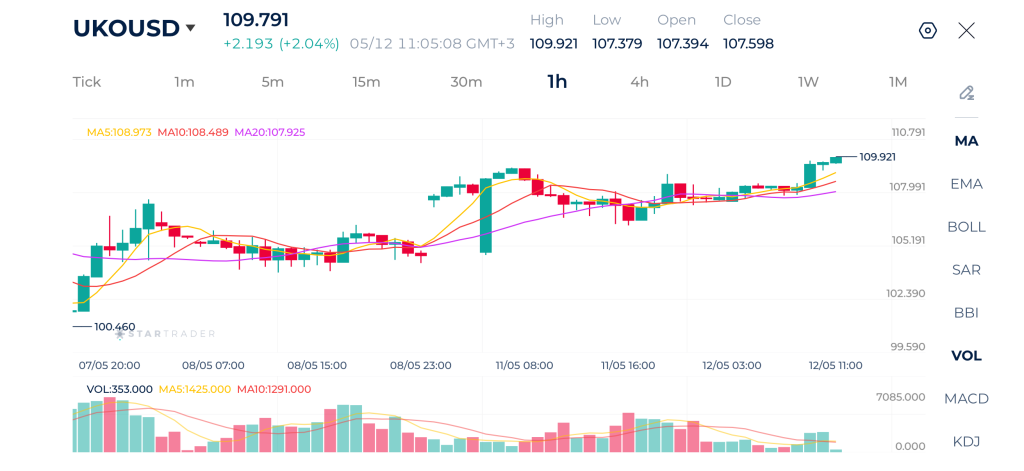
| Resistance | $110.25 | $112.67 | $115.20 |
| Support | $108.26 | $107.13 | $106.05 |
Bitcoin Technical Analysis
Bitcoin is showing signs of weakening momentum on the hourly chart after failing to sustain the strong bullish breakout that pushed price toward the $82,467 resistance area.
Despite the current pullback, the broader structure remains relatively stable as long as the cryptocurrency holds above the psychological $80,000 support region. This area aligns closely with the recent breakout base and remains critical for bulls. If buyers defend this zone successfully, Bitcoin could stabilize and attempt another move back toward $82,000 and potentially retest the recent highs.
However, if the market breaks below $80,000 decisively, bearish momentum could accelerate toward $79,000 and possibly deeper retracement levels.
Bitcoin 1H Chart
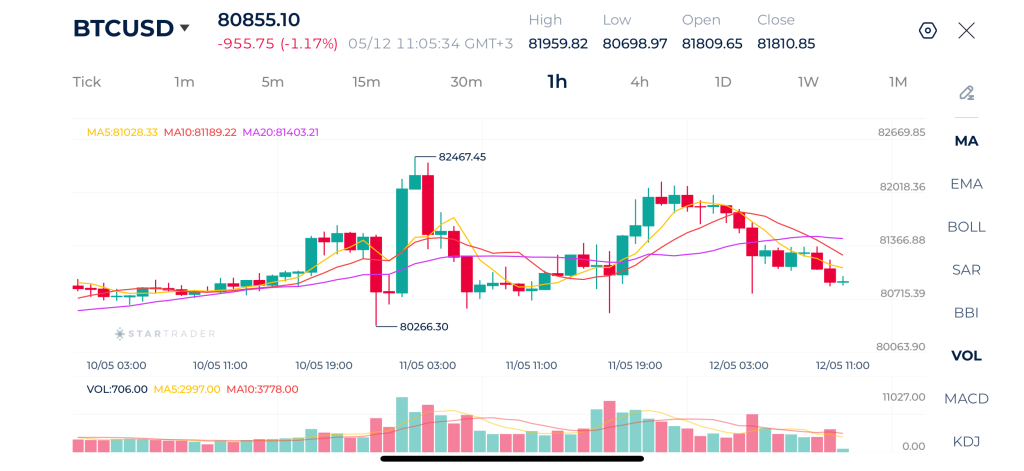
| Resistance | $81,540 | $82,145 | $82,800 |
| Support | $80,256 | $79,195 | $78,012 |
Risk Disclaimer: This material is provided for informational purposes only and does not constitute a recommendation or investment advice. Trading financial instruments on margin involves substantial risk and may not be appropriate for all investors.
Tags
Open Live Account
Please enter a valid country
No results found
No results found
Please enter a valid email
Please enter a valid verification code
1. 8-16 characters + numbers (0-9) 2. blend of letters (A-Z, a-z) 3. special characters (e.g, !a#S%^&)
Please enter the correct format
Please tick the checkbox to proceed
Please tick the checkbox to proceed
Important Notice
STARTRADER does not accept any applications from Australian residents.
To comply with regulatory requirements, clicking the button will redirect you to the STARTRADER website operated by STARTRADER PRIME GLOBAL PTY LTD (ABN 65 156 005 668), an authorized Australian Financial Services Licence holder (AFSL no. 421210) regulated by the Australian Securities and Investments Commission.
CONTINUEImportant Notice for Residents of the United Arab Emirates
In alignment with local regulatory requirements, individuals residing in the United Arab Emirates are requested to proceed via our dedicated regional platform at startrader.ae, which is operated by STARTRADER Global Financial Consultation & Financial Analysis L.L.C.. This entity is licensed by the UAE Capital Market Authority (CMA) under License No. 20200000241, and is authorised to introduce financial services and promote financial products in the UAE.
Please click the "Continue" button below to be redirected.
CONTINUEError! Please try again.

