


Dow Jones Technical Analysis
The hourly chart of Dow Jones shows a clean bullish impulse. Price is currently moving well above the 30-period moving average, which shows that the main bullish trend is healthy.
MACD and signal lines starting to converge, forming a potential bearish crossover. This usually leads to a short-term dip, not a reversal.
The index is still in a strong uptrend, but the 1H chart shows clear signs of overextension and consolidation. A small dip toward MA(10) and MA(30) is likely to happen before attempting another push upward.
Dow Jones 1H Chart
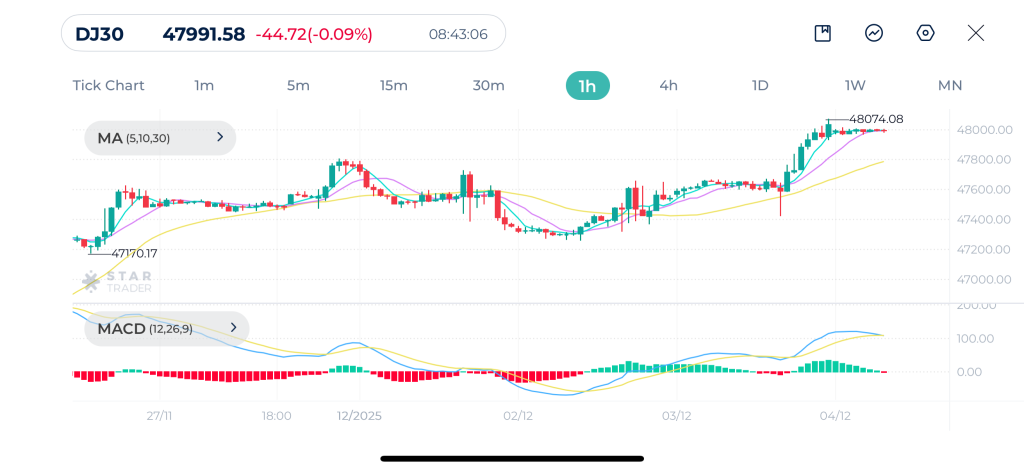
| Resistance | 48,000 | 48,192 | 48,400 |
| Support | 47,865 | 47,754 | 47,682 |
EURUSD Technical Analysis
EURUSD is trending upward on the hourly chart, forming a clean bullish structure. It’s currently showing slight bearish correction. Moving average MA(5) crossed below the 10-period moving average, signaling short-term weakness.
If price breaks below the long-term moving average MA(30), bearish momentum may accelerate toward 1.1600.
MACD shows downside pressure as the MACD line has crossed below the signal. However, the slope is shallow, indicating gradual correction, not aggressive selling
EURUSD is undergoing a short-term pullback after an extended rally. As long as it stays above 1.1625, the overall bullish trend remains intact.
EURUSD 1H Chart
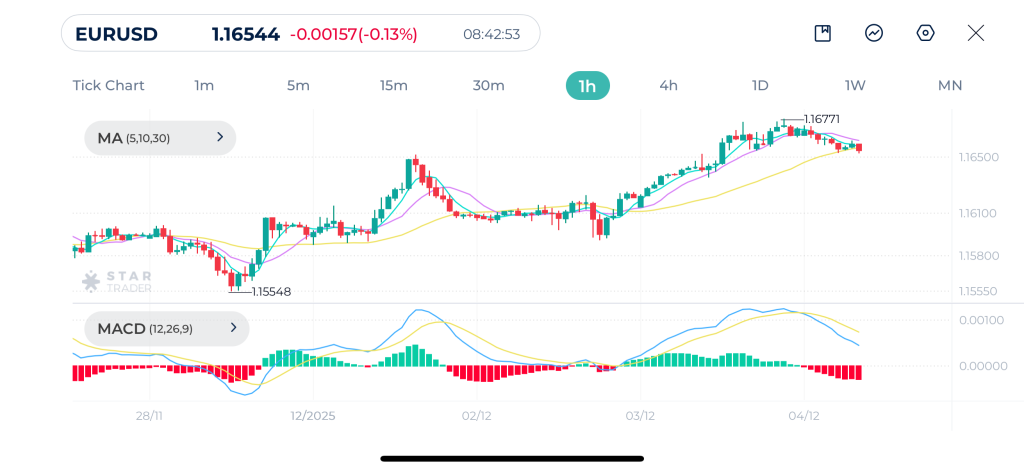
| Resistance | 1.1678 | 1.1725 | 1.1764 |
| Support | 1.1648 | 1.1626 | 1.1600 |
Bitcoin Technical Analysis
Bitcoin has shaped a V-shaped recovery on the hourly chart around $83,000 level. The market has been moving in a steady bullish structure with higher highs and higher lows.
The uptrend lost momentum near $94,000, turning into a sideways consolidation.
Moving average MA(5) crossed below the MA(10), indicating short-term cooling. Price is currently testing the long-term moving average MA(30), which is acting as a support level.
If price holds above the 30-period moving average, the uptrend remains intact.
MACD shows a bearish crossover. However, the angle of decline is mild, suggesting a correction, not a trend reversal.
Bitcoin remains bullish on higher timeframes, but the 1H chart shows cooling momentum and a short-term pullback. As long as price stays above the 30-period moving average, buyers remain in control.
Bicoin 1H Chart
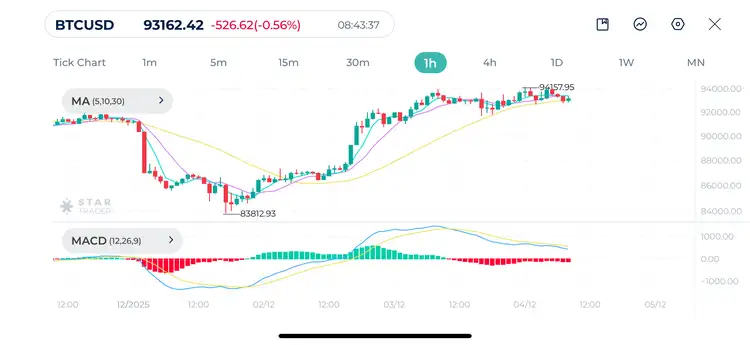
| Resistance | $94,250 | $95,940 | $97,430 |
| Support | $92,700 | $91,814 | $90,262 |
Tags
Open Live Account
Please enter a valid country
No results found
No results found
Please enter a valid email
Please enter a valid verification code
1. 8-16 characters + numbers (0-9) 2. blend of letters (A-Z, a-z) 3. special characters (e.g, !a#S%^&)
Please enter the correct format
Please tick the checkbox to proceed
Please tick the checkbox to proceed
Important Notice
STARTRADER does not accept any applications from Australian residents.
To comply with regulatory requirements, clicking the button will redirect you to the STARTRADER website operated by STARTRADER PRIME GLOBAL PTY LTD (ABN 65 156 005 668), an authorized Australian Financial Services Licence holder (AFSL no. 421210) regulated by the Australian Securities and Investments Commission.
CONTINUEImportant Notice for Residents of the United Arab Emirates
In alignment with local regulatory requirements, individuals residing in the United Arab Emirates are requested to proceed via our dedicated regional platform at startrader.ae, which is operated by STARTRADER Global Financial Consultation & Financial Analysis L.L.C.. This entity is licensed by the UAE Capital Market Authority (CMA) under License No. 20200000241, and is authorised to introduce financial services and promote financial products in the UAE.
Please click the "Continue" button below to be redirected.
CONTINUEError! Please try again.

