


Bitcoin Technical Analysis
Bitcoin has been showing a bearish movement for two weeks since it broke a new record at $124,500. The cryptocurrencies is currently consolidating near $107,000.
All three moving averages MA(5), MA(10), and MA(30) are in bearish alignment. Price is currently trading below 30-period moving average, suggesting downside pressure persists.
MACD line is below signal line, which supports bearish momentum.
Outlook is still bearish on Bitcoin unless price reclaims $110,000. A breakdown below $106,500 could accelerate selling pressure.
Bitcoin 1H Chart
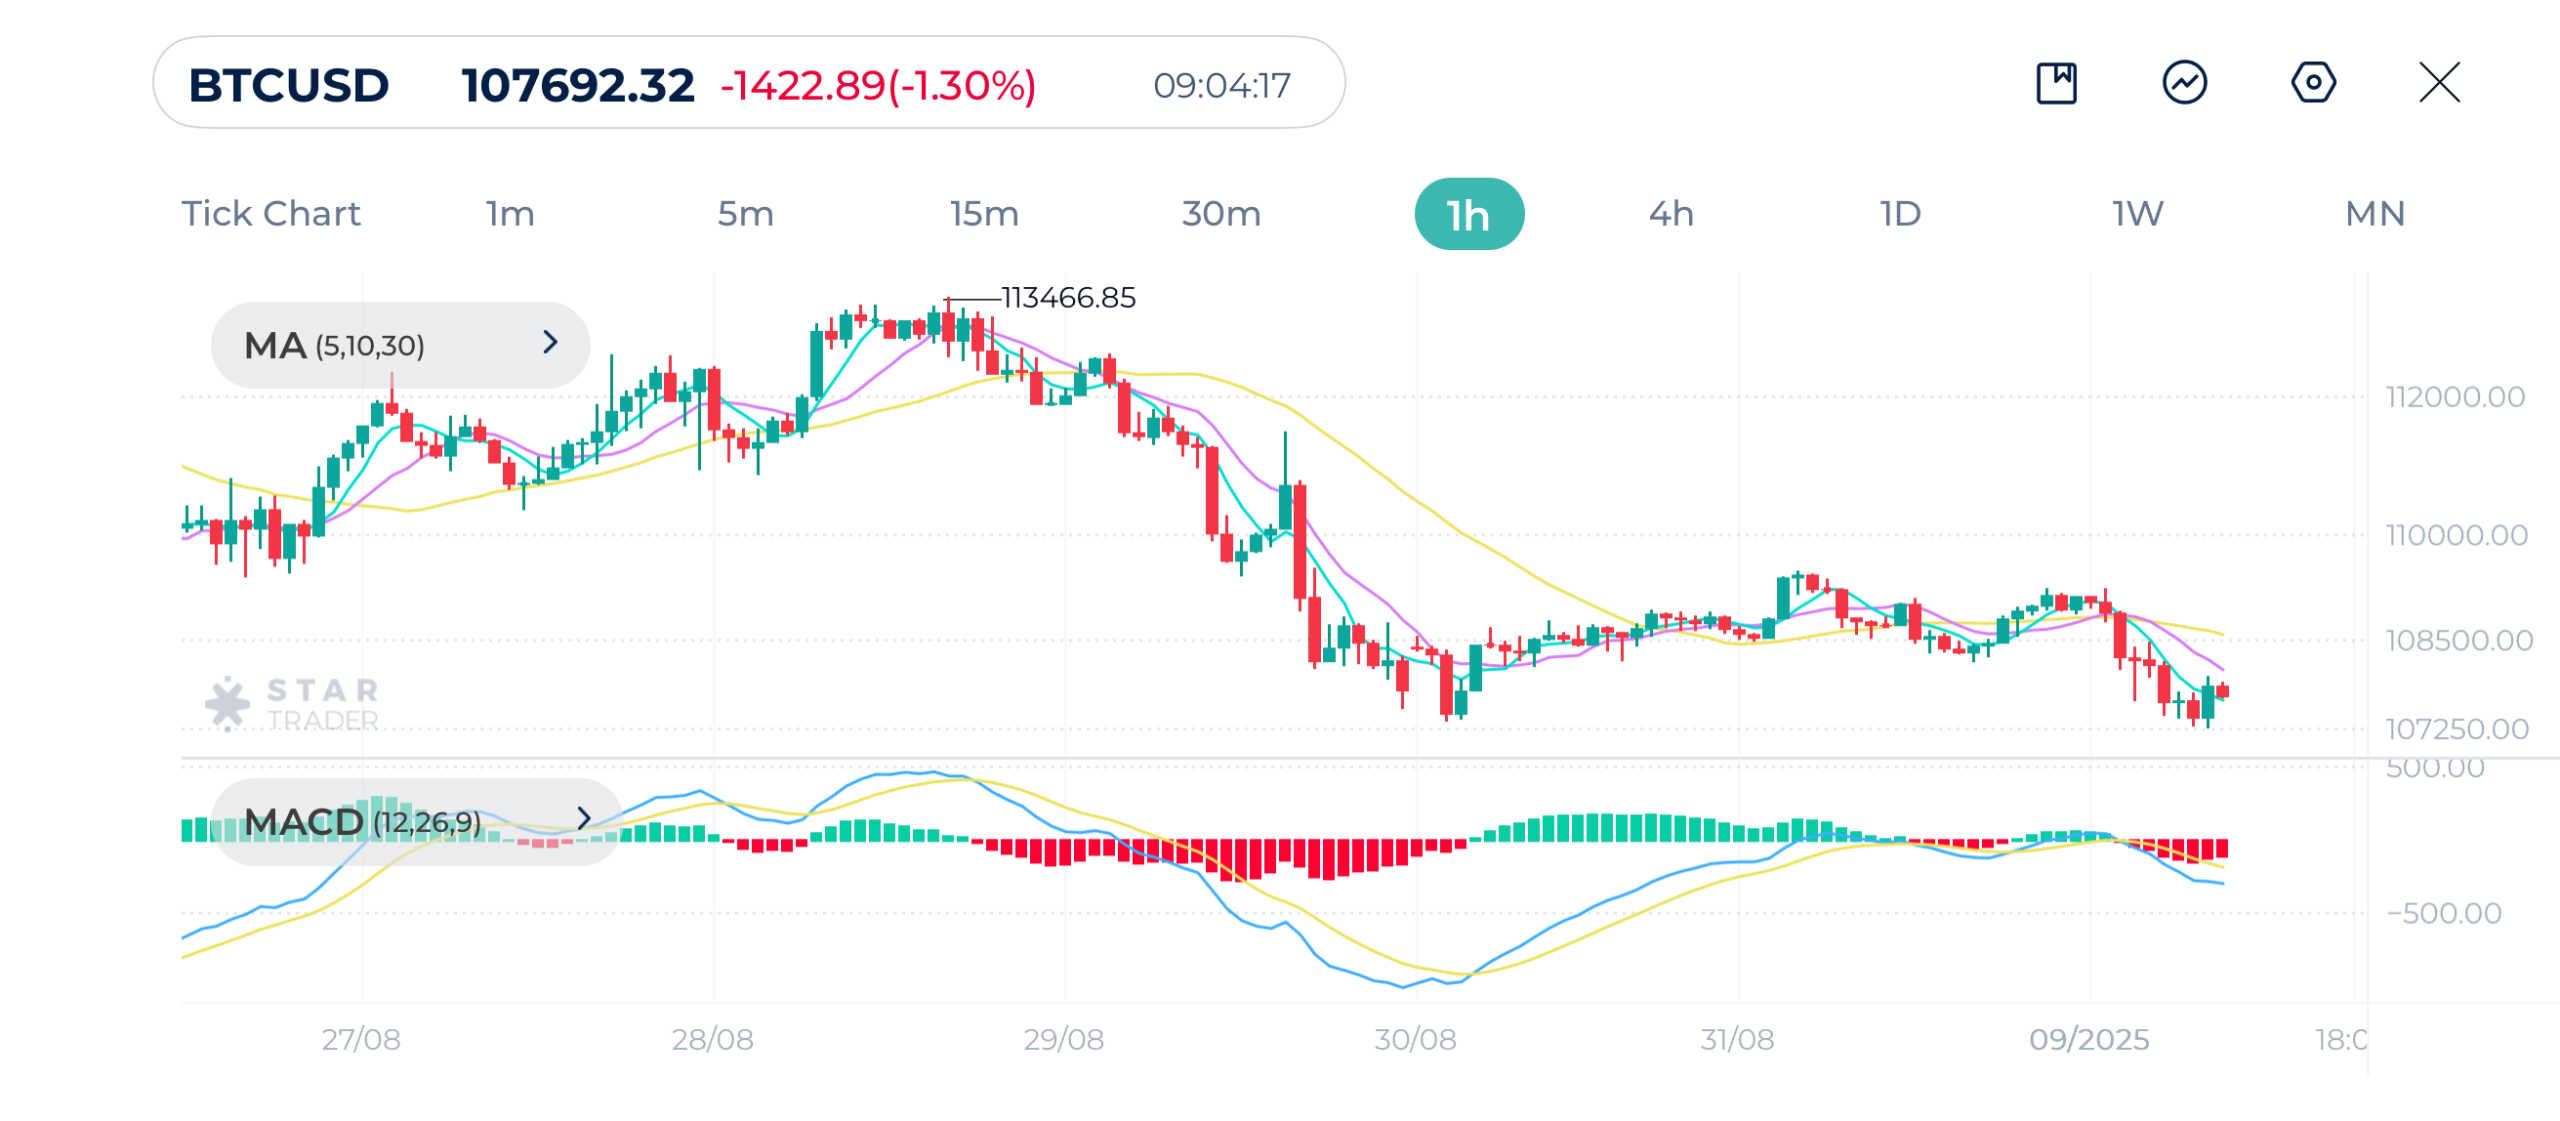
| Resistance | $109,500 | $111,417 | $113,471 |
| Support | $107,263 | $106,402 | $105,200 |
Gold Technical Analysis
Gold continues to push higher as price shows a strong sustained uptrend. Price recently hit $3,486 high. All three moving averages MA(5), MA(10), and MA(30) are in bullish alignment, indicating strong bullish momentum.
Short-term pullback is possible since price stretched above the moving averages.
MACD line is well above signal line, supporting the bullish momentum.
The outlook for gold remains bullish , but some overextension signals potential pullback. As long as $3,440 holds, buyers remain in control.
Gold (XAUUSD) 1H Chart
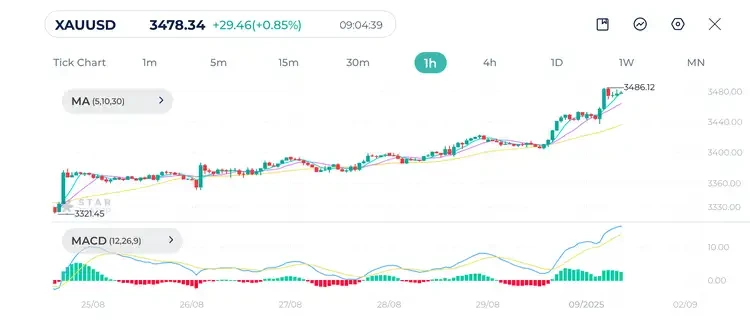
| Resistance | $3,500 | $3,520 | $3,550 |
| Support | $3,436 | $3,404 | $3,393 |
EURUSD Technical Analysis
EURUSD is moving in a clear uptrend on the hourly chart, forming higher lows and higher highs and mostly respecting the 30-period moving average.
All three moving averages MA(5), MA(10), and MA(30) are in bullish alignment. Price is trading above MA(30), showing momentum shift toward the upside.
MACD line is crossing above the signal line, which indicates that bullish momentum is building.
Short-term bias on EURUSD is bullish as long as price holds above 1.1650. A breakout above 1.1742 could push prices toward 1.1800.
EURUSD 1H Chart
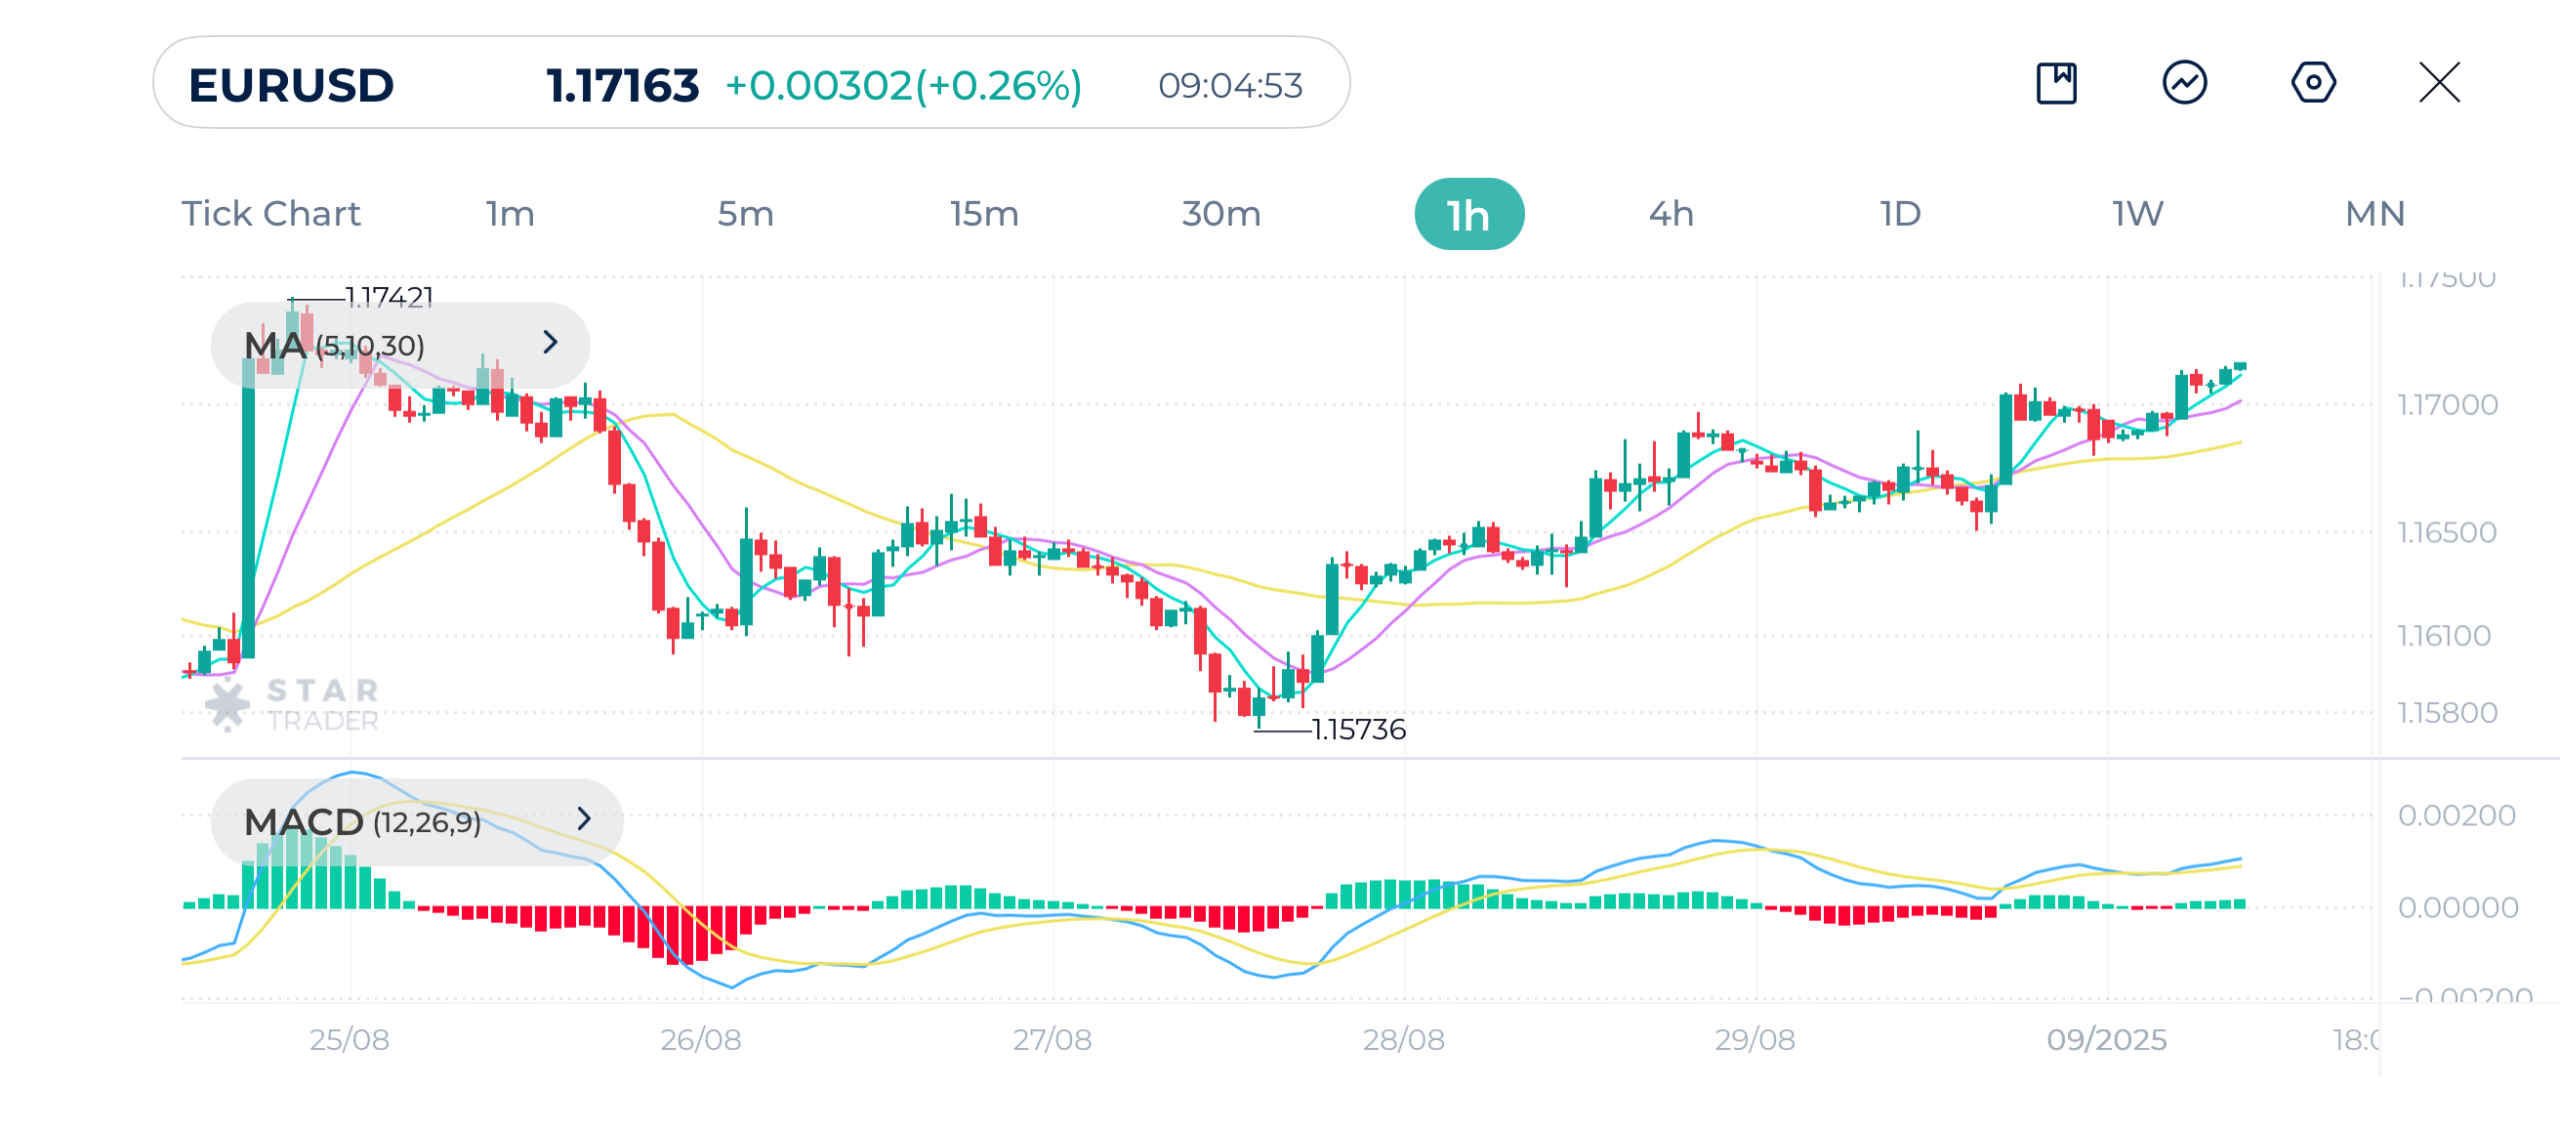
| Resistance | 1.1742 | 1.1787 | 1.1830 |
| Support | 1.1704 | 1.1681 | 1.1652 |
Tags
Open Live Account
Please enter a valid country
No results found
No results found
Please enter a valid email
Please enter a valid verification code
1. 8-16 characters + numbers (0-9) 2. blend of letters (A-Z, a-z) 3. special characters (e.g, !a#S%^&)
Please enter the correct format
Please tick the checkbox to proceed
Please tick the checkbox to proceed
Important Notice
STARTRADER does not accept any applications from Australian residents.
To comply with regulatory requirements, clicking the button will redirect you to the STARTRADER website operated by STARTRADER PRIME GLOBAL PTY LTD (ABN 65 156 005 668), an authorized Australian Financial Services Licence holder (AFSL no. 421210) regulated by the Australian Securities and Investments Commission.
CONTINUEImportant Notice for Residents of the United Arab Emirates
In alignment with local regulatory requirements, individuals residing in the United Arab Emirates are requested to proceed via our dedicated regional platform at startrader.ae, which is operated by STARTRADER Global Financial Consultation & Financial Analysis L.L.C.. This entity is licensed by the UAE Capital Market Authority (CMA) under License No. 20200000241, and is authorised to introduce financial services and promote financial products in the UAE.
Please click the "Continue" button below to be redirected.
CONTINUEError! Please try again.

