


Ethereum Technical Analysis
Ether shows a bullish structure overall on the hourly chart with a strong spike in price on Friday. Price has dropped slightly after peaking at $4,955
The bearish crossover on moving averages MA(5). MA(10) and MA(30) warns of further declines to the downside.
MACD hints at potential drop to the downside as it is moving below zero level. The overall trend on Ether remains bullish. If price breaks above $4,775, it might recapture the record high at $4,955.
However, falling below $4,620 may lead to further declines toward $4,366
ETHUSD 1H Chart
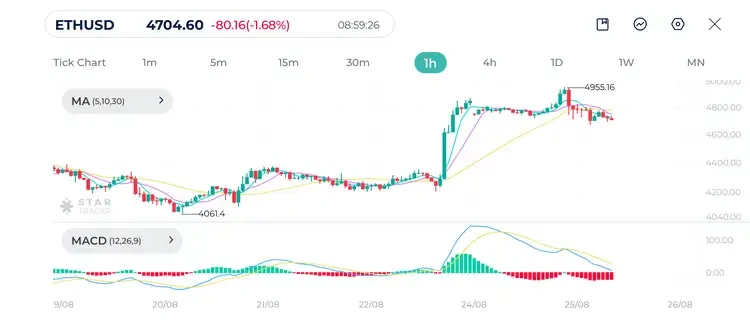
| Resistance | $4,774 | $4,820 | $4,881 |
| Support | $4,568 | $4,492 | $4,571 |
Dow Jones Technical Analysis
On Friday, Dow Jones reached a new all-time high at 45,762, but it since corrected downward to 45,544. The three moving averages MA(5), MA(10) and MA(30) show a strong bullish alignment. Price is currently in consolidation on the hourly chart.
Breaking below 45,544 may lead to further declines toward previous resistance level 45,266. If price maintains its levels above moving average MA(30), it’s likely to continue its uptrend.
However, closing below mid-term moving average MA(30) may cause further declines below 45,000 levels.
Dow Jones 1H Chart
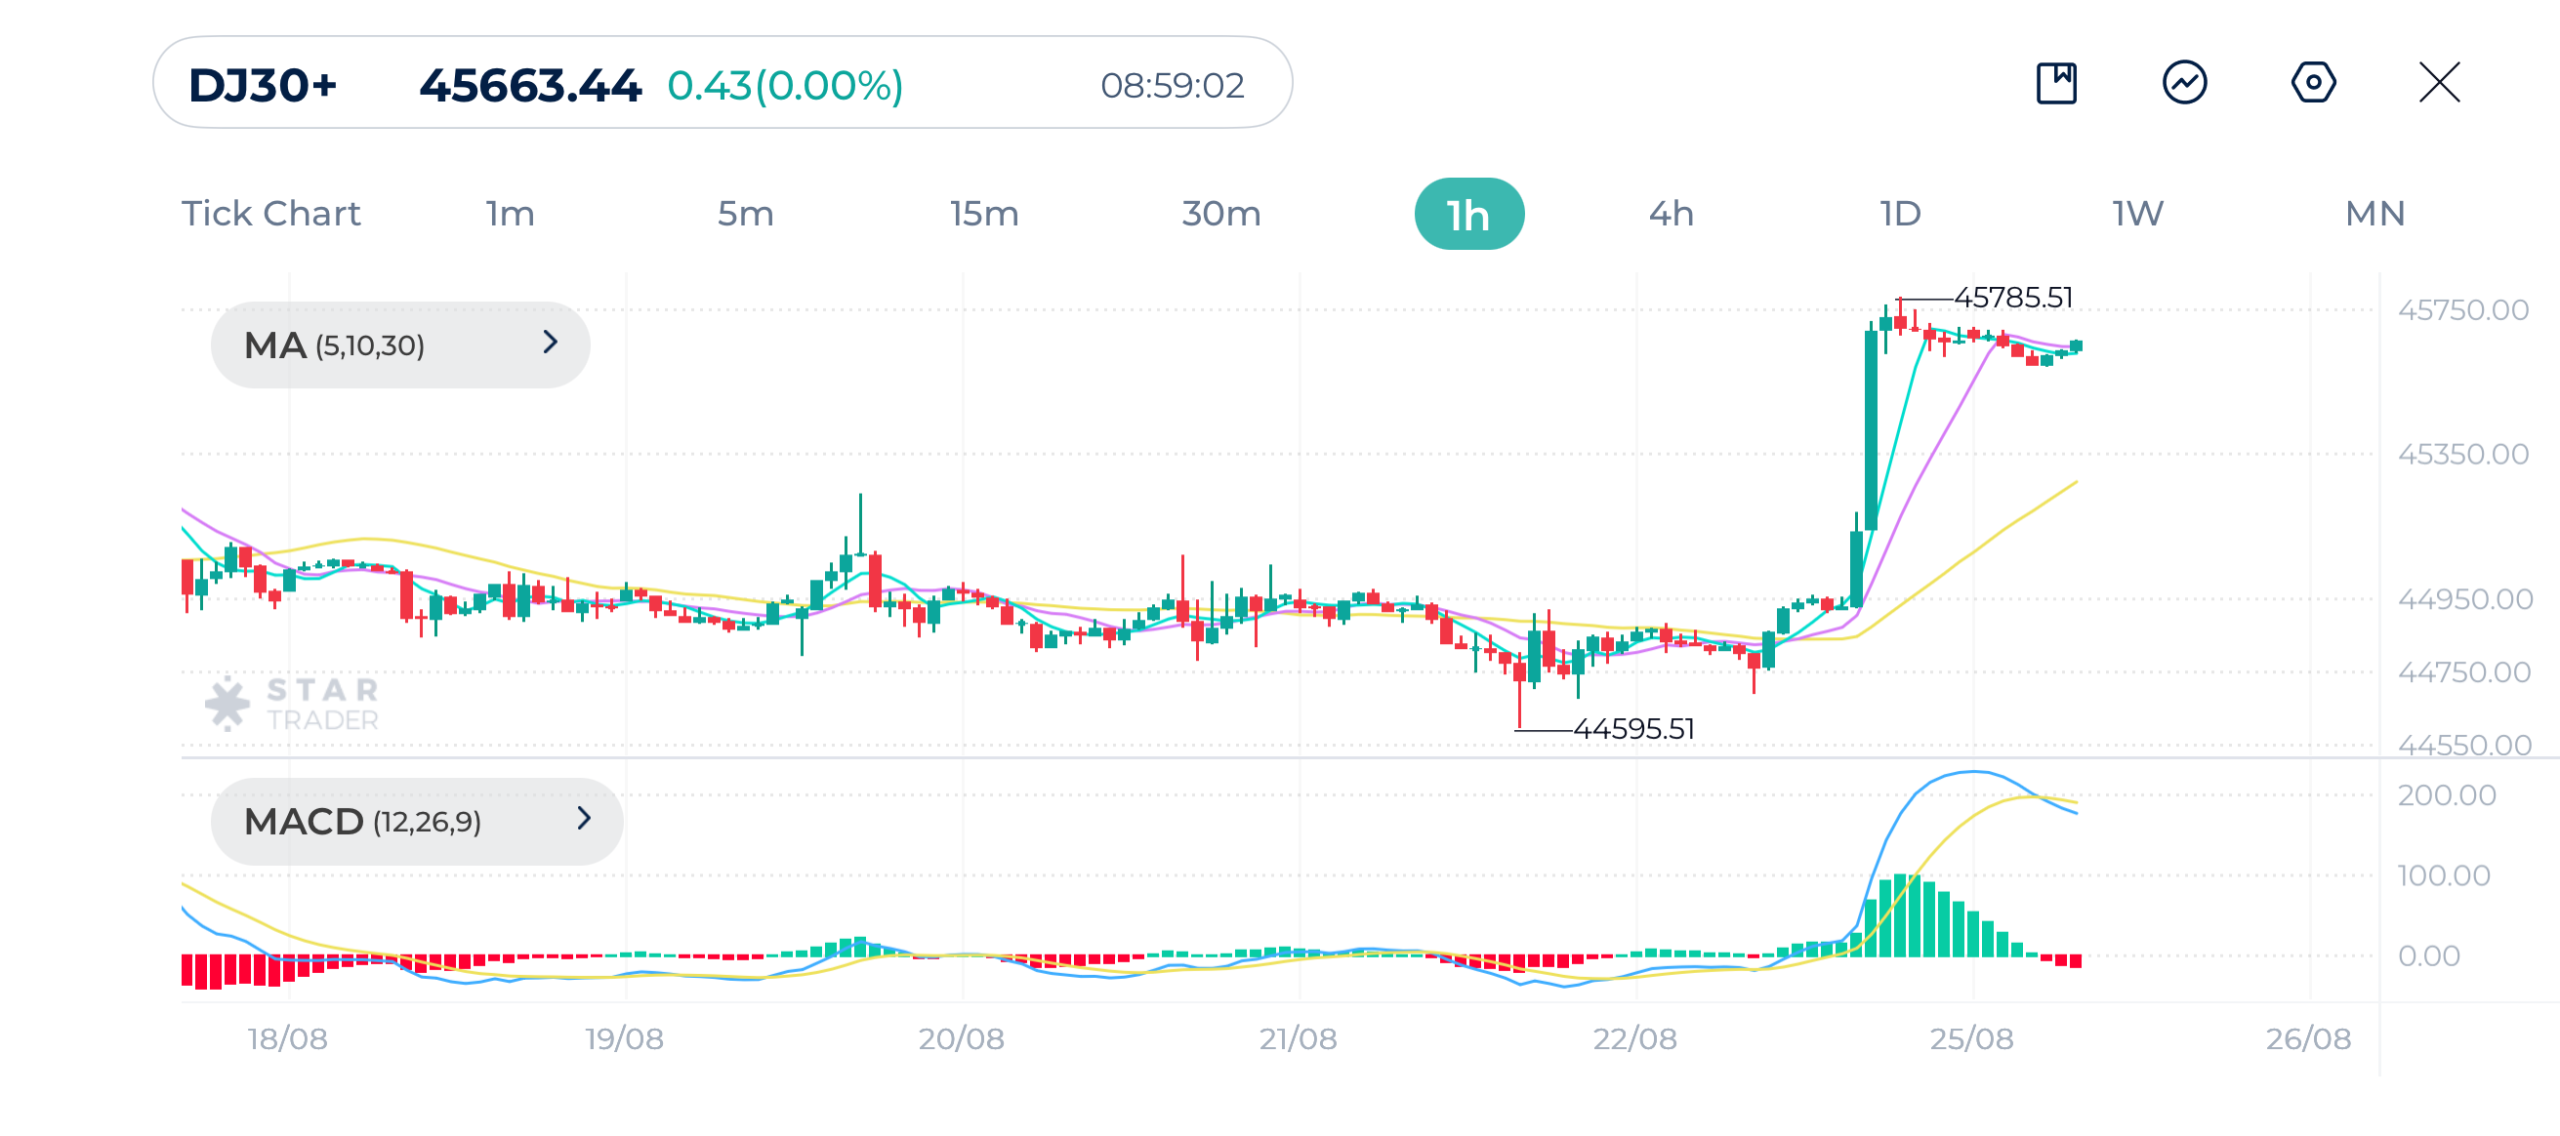
| Resistance | 45,765 | 45,832 | 45,921 |
| Support | 45,558 | 45,263 | 45,076 |
Gold Technical Analysis
Gold faced a strong resistance at $3,378 causing a drop of 0.6% to $3,359. Price may face a strong support at the 30-period moving average causing a rise toward $3,375.
MACD has fallen below the zero line with a bearish crossover seen on the daily chart.
Breaking above $3,378 may open the door for a spike toward $3,3400 price level
Gold (XAUUSD) 1H Chart
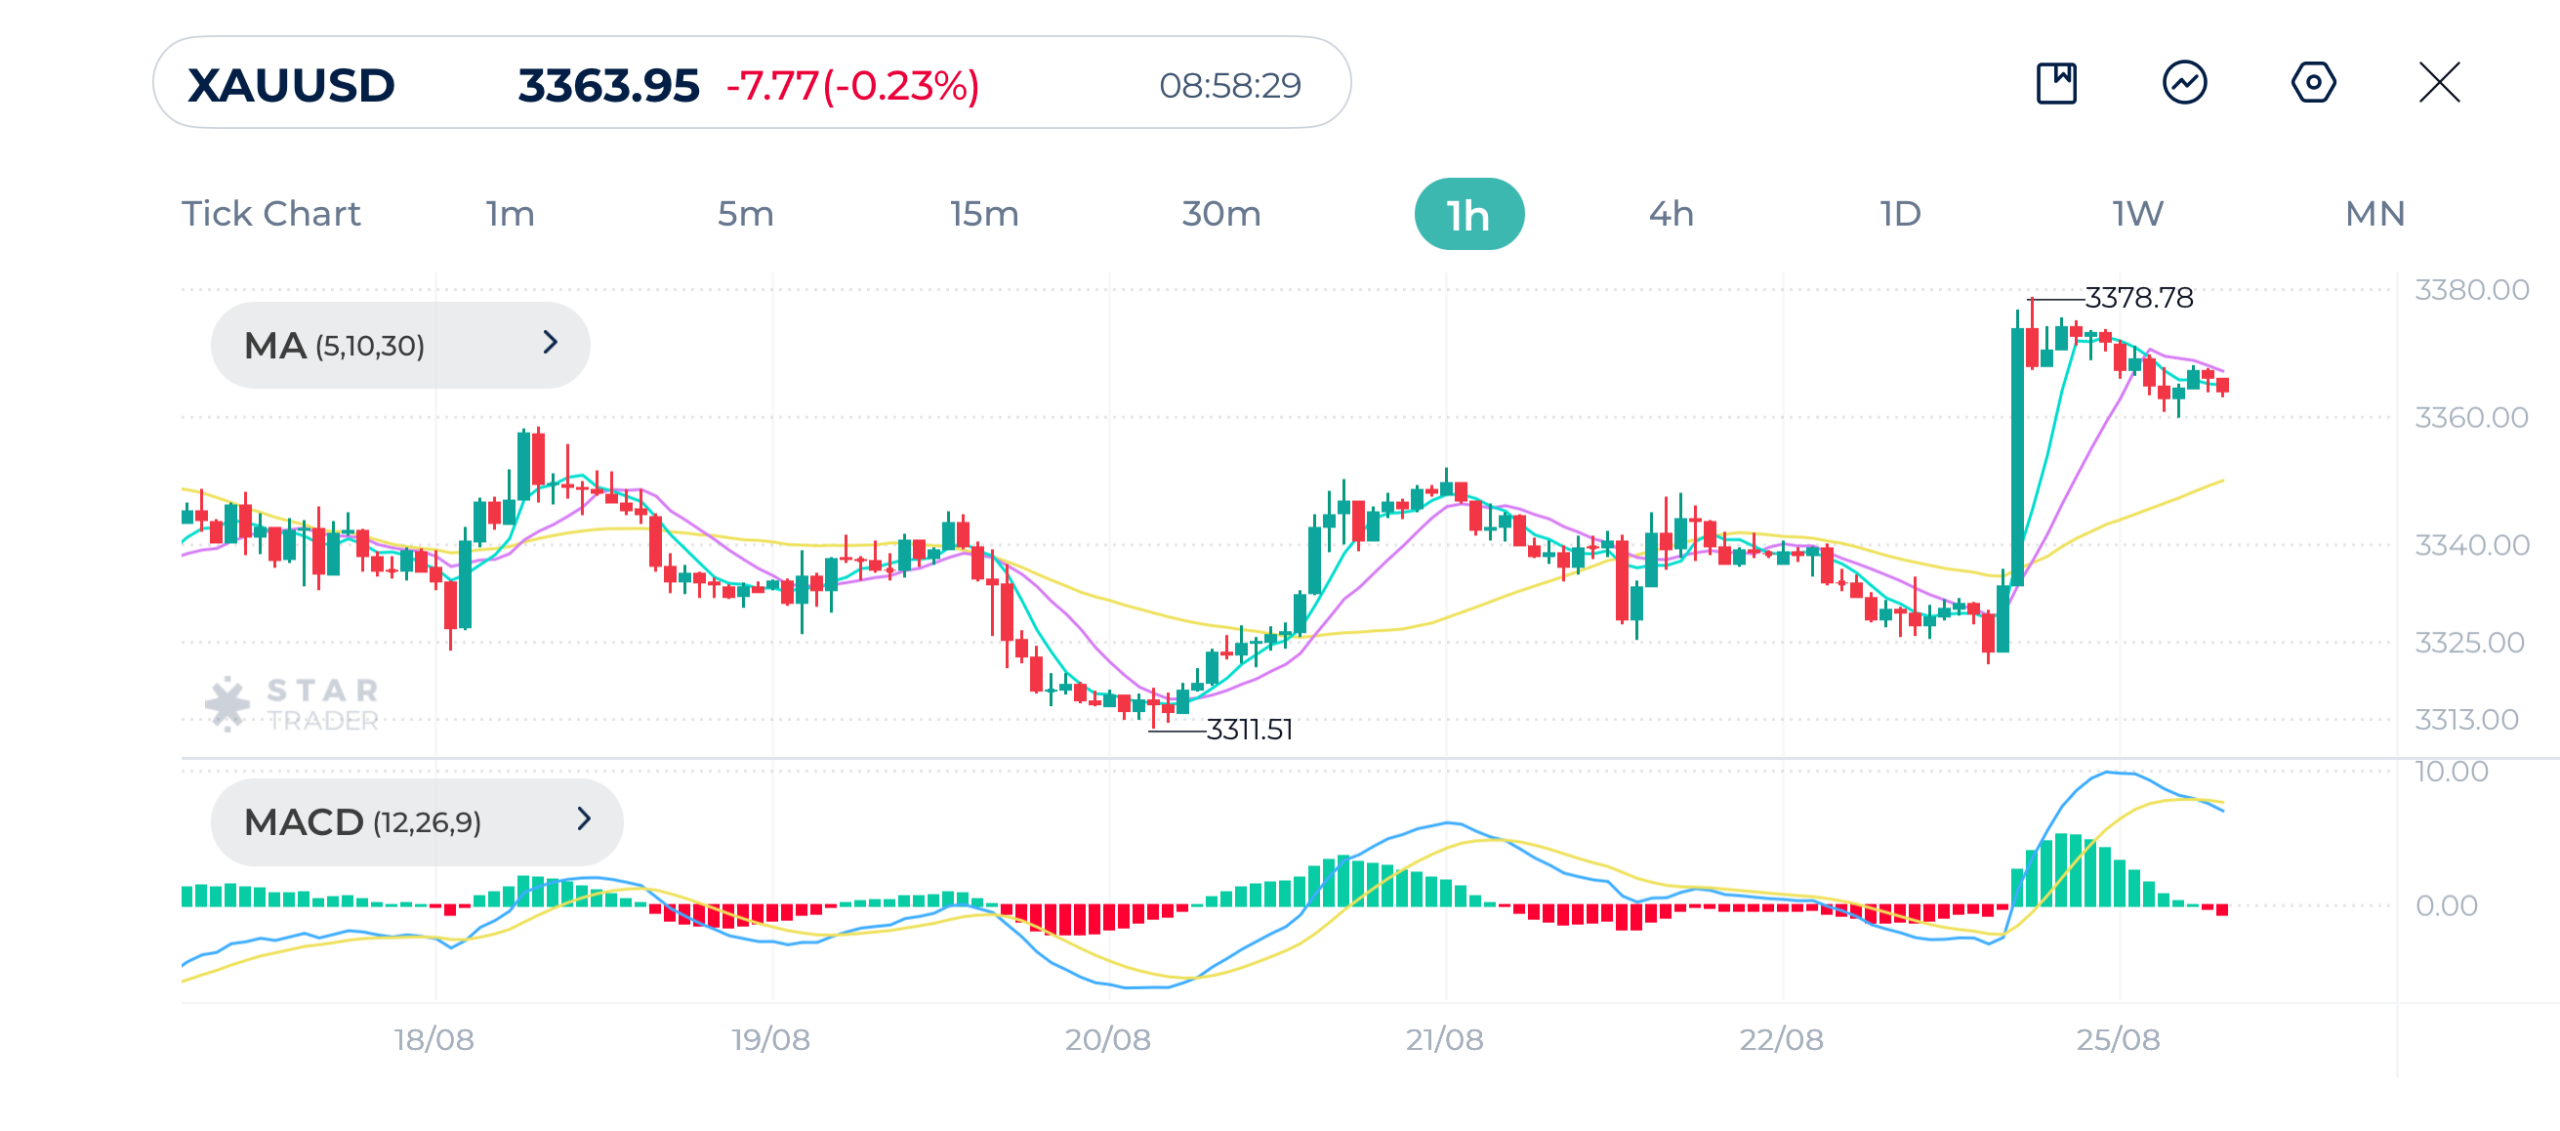
| Resistance | $3,378 | $3,392 | $3,409 |
| Support | $3,359 | $3,348 | $3,328 |
Tags
Open Live Account
Please enter a valid country
No results found
No results found
Please enter a valid email
Please enter a valid verification code
1. 8-16 characters + numbers (0-9) 2. blend of letters (A-Z, a-z) 3. special characters (e.g, !a#S%^&)
Please enter the correct format
Please tick the checkbox to proceed
Please tick the checkbox to proceed
Important Notice
STARTRADER does not accept any applications from Australian residents.
To comply with regulatory requirements, clicking the button will redirect you to the STARTRADER website operated by STARTRADER PRIME GLOBAL PTY LTD (ABN 65 156 005 668), an authorized Australian Financial Services Licence holder (AFSL no. 421210) regulated by the Australian Securities and Investments Commission.
CONTINUEImportant Notice for Residents of the United Arab Emirates
In alignment with local regulatory requirements, individuals residing in the United Arab Emirates are requested to proceed via our dedicated regional platform at startrader.ae, which is operated by STARTRADER Global Financial Consultation & Financial Analysis L.L.C.. This entity is licensed by the UAE Capital Market Authority (CMA) under License No. 20200000241, and is authorised to introduce financial services and promote financial products in the UAE.
Please click the "Continue" button below to be redirected.
CONTINUEError! Please try again.

